The food and beverage manufacturing sector is undergoing a fundamental rethink of how performance is measured. For decades, plant managers have optimized for throughput, yield, and downtime reduction — operational metrics that tell you what happened but rarely explain what it cost or earned. In 2026, the most competitive food plants are dismantling that model entirely, replacing it with revenue-centric analytics — a KPI architecture built to connect every line event, asset cycle, and process decision directly to financial outcomes. This is not an incremental upgrade to your existing dashboard. It is a structural reorientation of how manufacturing intelligence drives business strategy. To explore what this looks like inside a purpose-built platform, Book a Demo and walk through a live revenue-centric analytics configuration for your facility.
Why Traditional Food Manufacturing KPIs Are Failing in 2026
The Gap Between Operational Metrics and Financial Reality
OEE, MTBF, line utilization, and first-pass yield are not wrong metrics — they are incomplete metrics. The problem is not what they measure but what they cannot tell you: whether a production run was profitable, whether an asset investment is generating the expected return, or whether a throughput improvement is translating into margin expansion or simply absorbing cost more efficiently. Traditional KPI models were designed to optimize machines, not businesses. They report operational health in isolation from the financial architecture that gives those numbers meaning.
The food manufacturing environment of 2026 operates under fundamentally different pressure. Input cost volatility — energy, raw materials, packaging — has compressed margins to the point where operational efficiency and financial performance have diverged significantly. A plant running at 87% OEE with escalating energy costs per unit may be performing worse on a margin basis than a plant running at 79% OEE with a leaner energy consumption profile. Traditional KPI dashboards cannot surface that distinction. Revenue-centric analytics frameworks are specifically engineered to close that gap by embedding financial context into every operational measurement.
What Revenue-Centric Analytics Actually Measures — and Why It Changes Everything
From Operational Output to Profitability Intelligence
The defining characteristic of a revenue-centric KPI model is not the presence of financial data alongside operational data — it is the systematic linkage between the two. Every process event, asset condition, and production decision is evaluated not just for its operational impact but for its financial consequence. A five-minute unplanned stoppage on a high-margin SKU line carries a different revenue implication than the same stoppage on a commodity volume line. A predictive maintenance intervention that prevents a two-hour shutdown has a calculable revenue protection value, not just a downtime reduction metric. Manufacturers exploring this shift in measurement logic can Book a Demo to see how iFactory's platform maps financial outcomes to individual line events in real time.
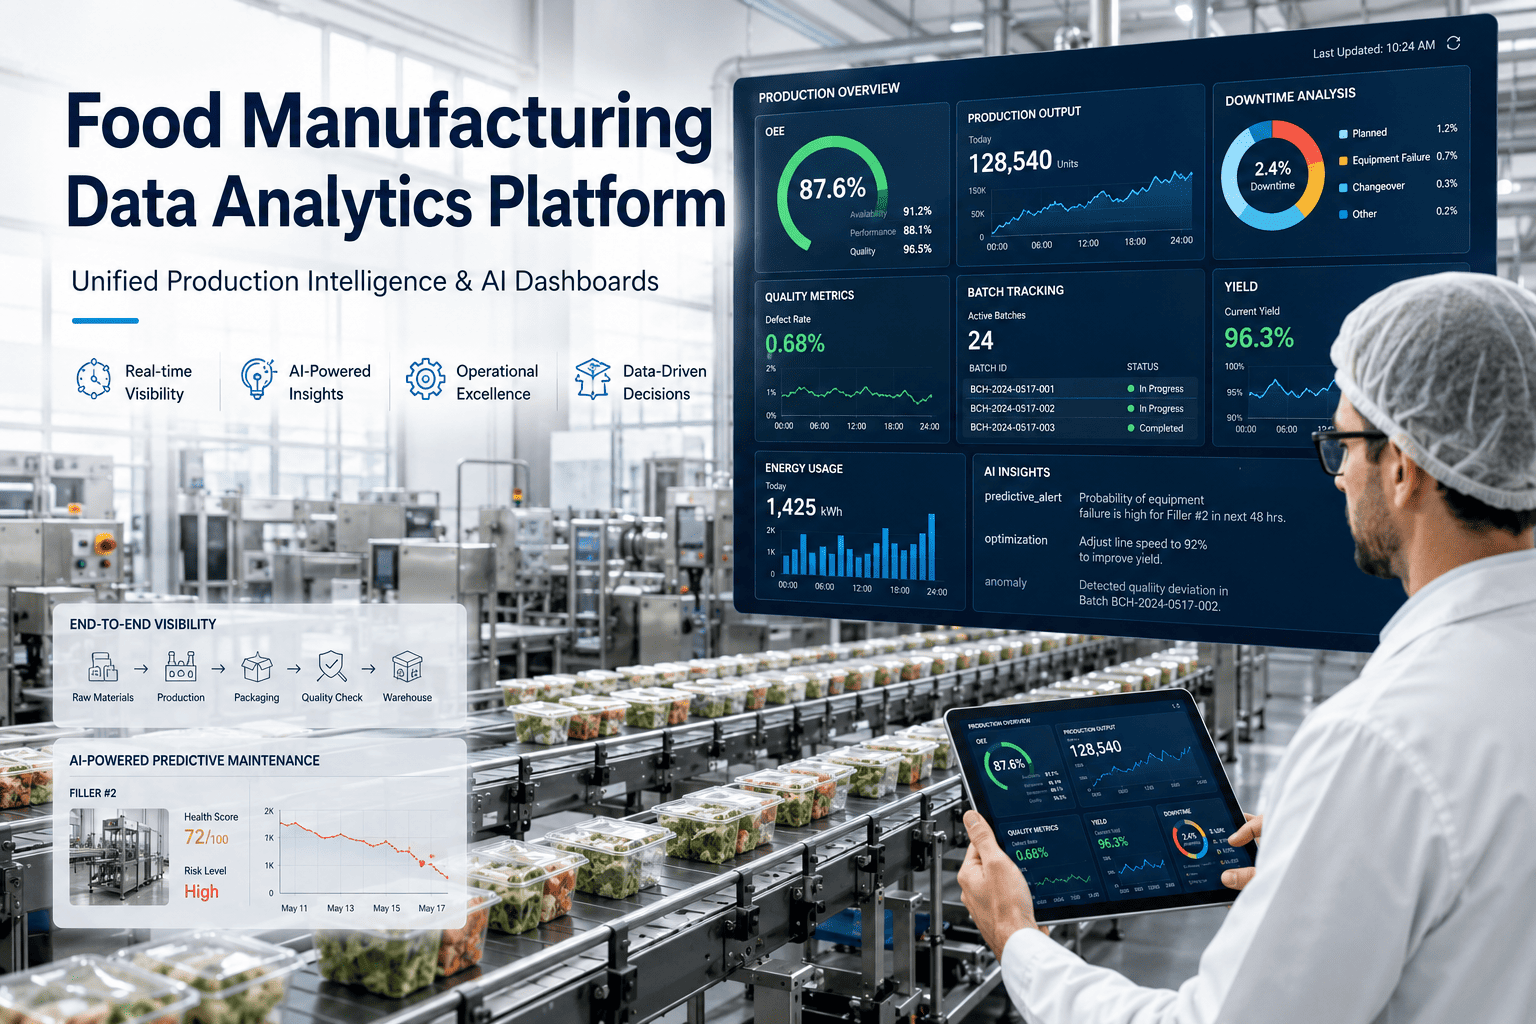
Modern AI-driven operational analytics platforms achieve this by ingesting both the production data stream — sensor outputs, cycle counts, quality records, energy consumption — and the financial data layer — SKU-level margins, standard costs, energy tariff schedules, and labor cost models. Machine learning models trained on food manufacturing profitability patterns continuously calculate a financial impact score for every operational condition, giving production managers and VP Operations teams a unified view of both how the plant is running and what it is earning per hour, per line, and per SKU category. This is the architecture that separates manufacturing intelligence software from traditional SCADA dashboards and generic ERP reporting tools.
The Five KPI Categories in a Revenue-Centric Analytics Framework
Building a Financial Impact Tracking Architecture That Drives Decisions
A revenue-centric KPI model for food manufacturing is not a single dashboard — it is a structured hierarchy of measurement categories, each designed to connect a different operational domain to its financial consequence. The five categories below represent the standard architecture deployed across enterprise food manufacturing analytics programs. Food safety directors and VP Operations teams considering this framework can Book a Demo to walk through how each category maps to their specific production lines and SKU portfolio.
AI-Driven Operational Analytics vs. Traditional KPI Systems: A Capability Comparison
Evaluating Manufacturing Intelligence Software for 2026 Financial Performance Requirements
The table below maps the critical capability dimensions across three categories of performance measurement systems in food manufacturing — from legacy operational dashboards to purpose-built AI-driven analytics platforms designed for revenue visibility and financial impact tracking.
| Analytics Capability | Legacy OEE Dashboard | Generic ERP Reporting | AI Revenue-Centric Platform |
|---|---|---|---|
| Real-Time Financial Impact per Line Event | Not Available | End-of-Period Only | Live Per-Event Scoring |
| SKU-Level Margin Analytics | No | Standard Cost Only | Actual Margin Per Run |
| Predictive Asset Financial Risk | No | No | 2–6 Hour Revenue Exposure Alerts |
| Energy Cost Intelligence | kWh Totals Only | Period Aggregate | Cost-Per-Unit at Real-Time Tariff |
| Quality Loss Financial Conversion | Yield % Only | Month-End Variance | Real-Time Margin Impact |
| Capital Investment ROI Tracking | Not Available | Manual Calculation | Automated Return Analytics |
| Multi-Site Financial Benchmarking | Not Available | Manual Consolidation | Enterprise Profitability Dashboard |
| Predictive Performance Monitoring | Post-Event Only | Post-Period Only | AI Anomaly Detection |
The Six Operational Gaps That Revenue-Centric Analytics Closes in Food Manufacturing
Where Traditional KPI Models Create Hidden Profitability Risk
Understanding why the transition to revenue-centric analytics matters requires examining the specific scenarios where traditional operational KPI frameworks create financial blind spots. Each gap below represents a documented failure mode in food plant profitability management — and the mechanism by which AI-driven analytics platforms address it. To assess which gaps are most material to your facility's current performance, Book a Demo for a live profitability gap analysis with the iFactory team.
Measured Financial Outcomes Across Revenue-Centric Analytics Deployments
Documented ROI Performance Across Food Manufacturing Enterprise Implementations
Building the Business Case for Revenue-Centric Analytics Investment
Translating Operational Intelligence Into Executive Financial Language
The most common obstacle to analytics ROI metrics adoption in food manufacturing is not technical complexity — it is the challenge of expressing manufacturing intelligence investment in the financial terms that CFOs and executive committees respond to. The transition from operational KPI reporting to revenue-centric analytics must be framed not as a technology upgrade but as a margin recovery program with a measurable payback timeline. Food manufacturing executives evaluating this investment can Book a Demo to review a facility-specific ROI model built from their own production data.
Implementation Architecture for Revenue-Centric Analytics in Food Manufacturing
Deploying Financial Impact Tracking Without Disrupting Production Operations
The most common misconception about deploying revenue-centric analytics and AI-driven operational analytics in food manufacturing is that it requires replacing existing MES platforms, rebuilding ERP data models, or taking lines offline for integration work. Purpose-built manufacturing intelligence software is specifically designed to layer over existing operational systems — ingesting data from SCADA, PLC outputs, ERP cost layers, and energy management systems through standard integration protocols to build a unified financial performance layer without modifying validated production system configurations.
For most mid-to-large food production facilities, the standard deployment architecture delivers live financial KPI visibility within four to six weeks of project kickoff. The initial phase maps existing operational data streams to financial impact models calibrated to your SKU portfolio and cost structure. The second phase deploys AI anomaly detection trained on your historical production and financial data. The third phase activates enterprise profitability dashboards for plant managers, VP Operations, and CFO-level reporting — giving every level of the organization the financial visibility layer their current operational systems were never designed to provide.
Frequently Asked Questions
What is revenue-centric analytics in food manufacturing?
Revenue-centric analytics is a KPI framework that connects every operational measurement — asset performance, energy consumption, quality yield, production scheduling — directly to financial outcomes. Unlike traditional OEE or throughput metrics, revenue-centric models assign a real-time margin impact to every line event, enabling production decisions to be evaluated for their profitability consequence rather than just their operational efficiency score.
How does AI-driven operational analytics integrate with existing food plant systems?
Purpose-built manufacturing intelligence software connects to existing SCADA platforms, PLC monitoring outputs, ERP cost data, and energy management systems through standard industrial integration protocols — including OPC-UA, MQTT, and direct ERP API connections — without requiring hardware replacement or production line modification. Most food plant infrastructure integrations are completed within three to seven days per system with zero production interruption.
How quickly can food manufacturers expect to see ROI from revenue-centric analytics deployment?
Documented deployments in food and beverage manufacturing consistently deliver measurable financial outcomes within the first operating quarter. The earliest ROI drivers are typically scheduling optimization and energy cost reduction — both of which require only the financial KPI layer to be active, not the full predictive performance monitoring suite. Full platform deployments tracking asset reliability, quality loss, and capital investment return typically demonstrate complete payback within 8 to 14 months based on measured performance data.
What data sources does a revenue-centric analytics platform require?
The core data requirements are a real-time operational data stream — from SCADA, PLC, or inline sensors — and a financial reference layer from ERP or cost accounting systems containing SKU-level standard costs, labor rates, and energy tariff schedules. Environmental monitoring, quality system, and maintenance management data are incorporated in subsequent deployment phases to activate the full financial impact tracking suite across all KPI categories.
Does deploying revenue-centric analytics require replacing existing OEE dashboards or MES platforms?
No. Revenue-centric analytics platforms are designed to extend and enrich existing operational systems — not replace them. Your current OEE dashboards, MES configurations, and SCADA structures remain in place. The analytics platform adds a financial translation layer on top of the existing operational data stream, providing margin and ROI context that current systems cannot generate without modifying any validated production system configurations.
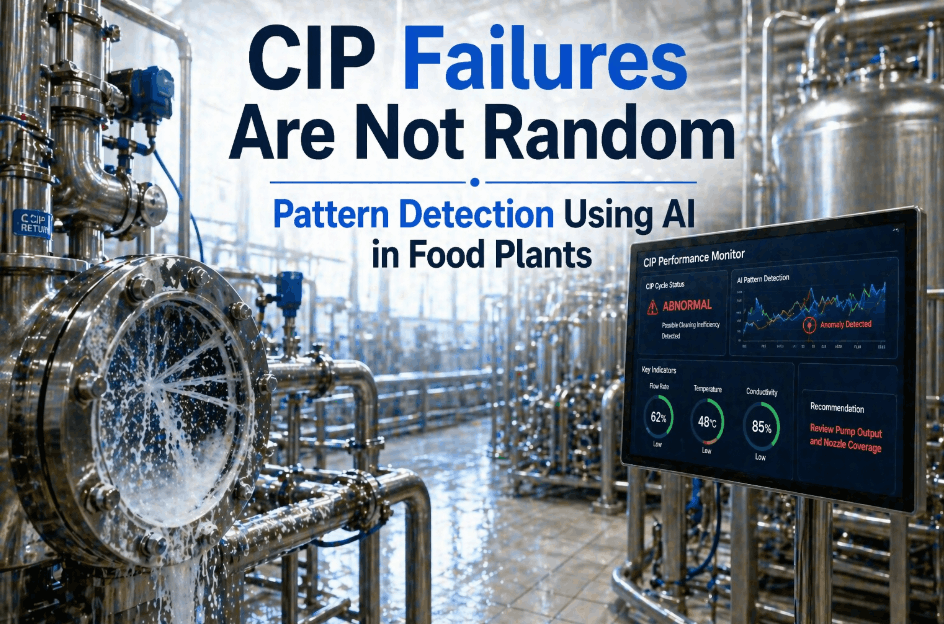
How does predictive performance monitoring differ from standard process monitoring in food manufacturing?
Standard process monitoring detects threshold breaches after they occur. Predictive performance monitoring uses machine learning models trained on historical process and financial data to identify anomaly signatures — the subtle patterns that precede an asset failure or quality deviation — typically 2 to 8 hours before any operational threshold is crossed. In a revenue-centric model, this early detection window is translated directly into revenue exposure avoided, giving production teams both the operational alert and the financial justification for intervention simultaneously.