School district facility directors and business officials face a persistent challenge: building and defending maintenance budgets that keep aging buildings safe, functional, and efficient while satisfying school boards and taxpayers. With the average U.S. school building over 50 years old and deferred maintenance backlogs exceeding $85 billion nationally, every dollar allocated to facility maintenance must be justified with data, not intuition. Yet most districts lack reliable benchmarks—cost per square foot, percent of replacement value, or allocation ratios—to inform their budget requests. This guide provides K‑12 leaders with industry‑standard maintenance budget benchmarks, proven allocation strategies, bond referendum data preparation techniques, and AI‑driven financial reporting tools to build credible, defensible budgets that secure board approval and voter support. Book a demo to see AI‑driven budget planning for your district.
K‑12 MAINTENANCE BUDGETING · BENCHMARKS & STRATEGIES
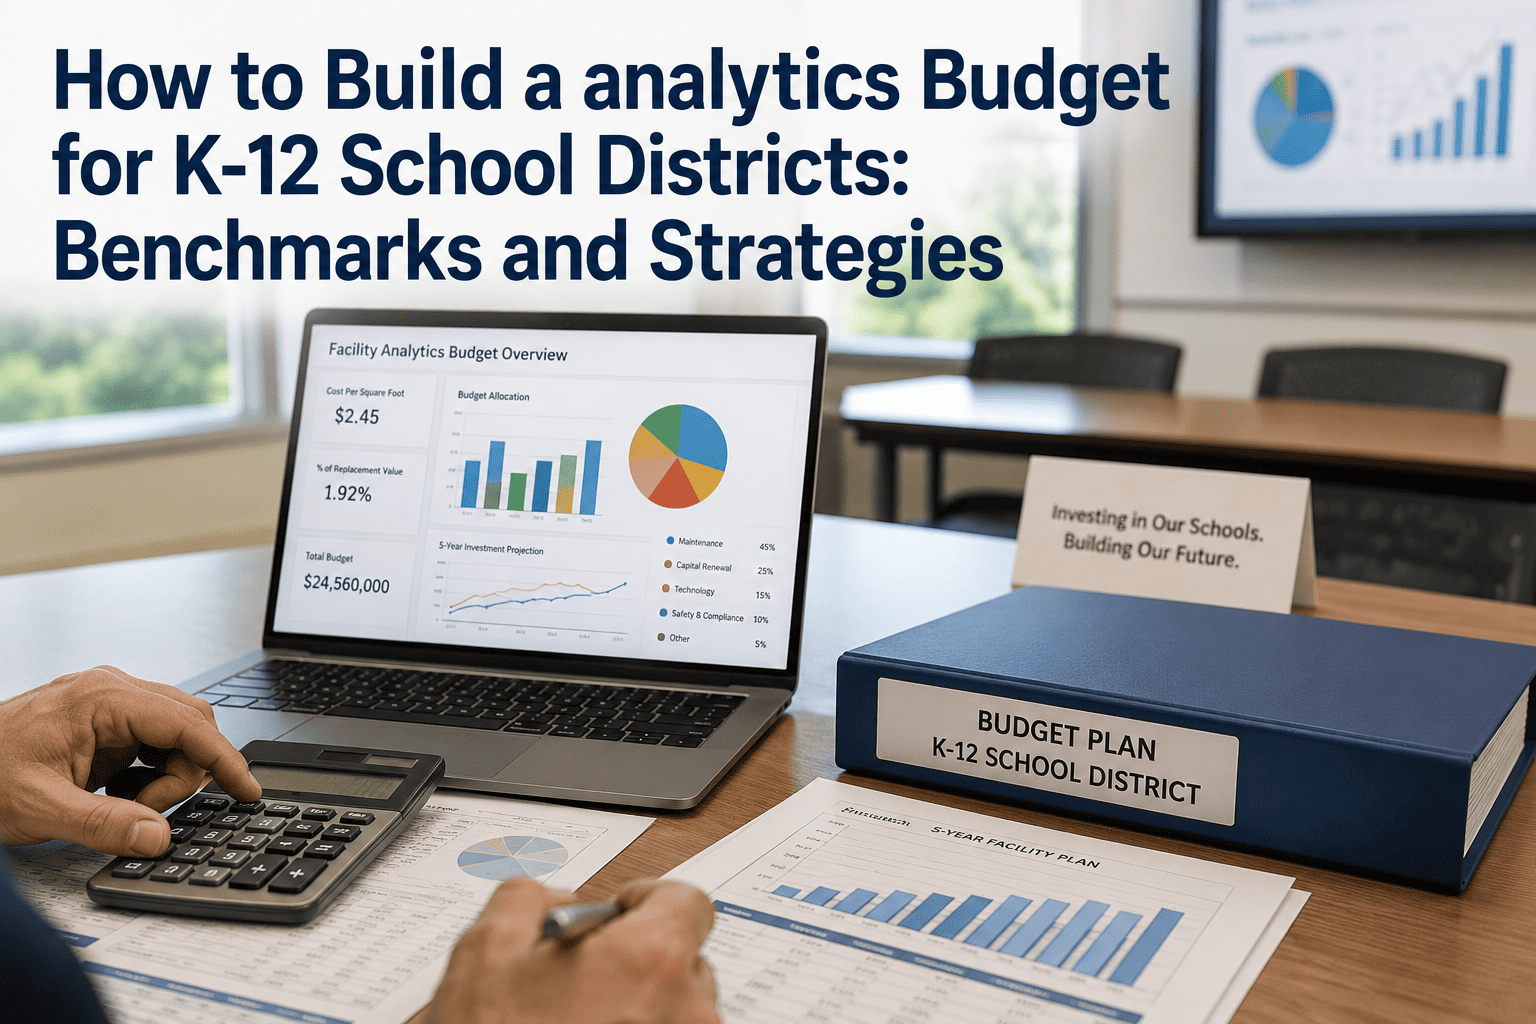
How to Build a Maintenance Budget for K‑12 School Districts: Benchmarks and Strategies
Cost per sq ft targets · % of replacement value · Bond referendum data · AI‑driven financial reporting · Board‑ready presentations.
$85B+
National K‑12 deferred maintenance backlog
$4.50‑7.50
Avg. maintenance cost per sq ft (annual)
2‑4%
Of facility replacement value recommended
3‑5 yrs
Backlog doubling time without strategic budgeting
The Budgeting Challenge: Why K‑12 Maintenance Budgets Fail
Most school districts approach maintenance budgeting reactively: a boiler fails, a roof leaks, or an HVAC system quits, and funds are scrambled from other accounts. This firefighting cycle leads to 30‑50% higher long‑term costs, unpredictable budget requests, and eroded trust with school boards. The root cause is a lack of data‑driven benchmarks and long‑range planning. Without knowing the industry standard cost per square foot for elementary vs. high schools, or the expected annual spend as a percentage of replacement value, districts either underfund maintenance (creating larger backlogs) or request excessive funds without justification. The fix is to adopt evidence‑based budgeting: benchmark your district against national data, use condition assessment scores (FCI) to prioritize, and present multi‑year capital plans rather than isolated repair requests. Talk to iFactory about a budget assessment for your district.
01
Benchmark Assessment
2 weeks
Collect district facility data: square footage, replacement value, current FCI, maintenance spend history.
02
Gap Analysis
2 weeks
Compare current spend to industry benchmarks. Identify underfunded areas and deferred maintenance risks.
03
Budget Modelling
3 weeks
Build 5‑year and 10‑year capital plans using AI lifecycle cost modelling. Prioritize projects by risk.
04
Board Presentation
1 week
Generate board‑ready reports with visual dashboards, tax impact statements, and bond scenarios.
05
Bond Referendum Prep
4 weeks
Prepare voter‑facing materials: interactive dashboards, project visuals, cost‑benefit analysis.
Phase 1: Benchmark Assessment — Where Does Your District Stand?
The first phase involves collecting your district's facility data: total square footage, replacement value, current Facility Condition Index (FCI), and historical maintenance spending. Most districts have this data in spreadsheets or facility condition assessments but rarely compare it to national benchmarks. The assessment team compiles this information and maps it against industry standards from APPA, NFMT, and state education department surveys.
Total square footage by building type
Current replacement value ($/sq ft)
Facility Condition Index (FCI) per building
Annual maintenance spend (last 3 years)
Deferred maintenance backlog estimate
Staffing and contract service costs
Elementary: $4‑6/sq ft | HS: $5.50‑7.50/sq ft
1.5‑3% of replacement value annually
Target FCI <0.05 (good), <0.10 (caution)
25‑35% preventive, 20‑25% reactive
5‑10% additional for backlog reduction
Key Discovery: Districts spending below $4/sq ft typically see FCI worsen by 0.02‑0.03 per year. Those spending above $7.50/sq ft often have inefficient operations or excess staffing. Benchmarking reveals the optimal range.
Phase 2: Gap Analysis & Risk Prioritisation
Once benchmarks are established, the gap analysis quantifies how much your district is under‑ or over‑spending. For example, a district with 500,000 sq ft spending $3.50/sq ft ($1.75M annually) versus the benchmark $5.50/sq ft ($2.75M) has a $1M annual gap. That gap translates directly into accelerating deferred maintenance. The analysis also prioritises risks: buildings with FCI >0.10, aging HVAC systems, roofs near end of life, and safety issues (fire alarms, emergency lighting).
Step 1
Calculate Current FCI
FCI = Deferred maintenance cost ÷ Replacement value. Score <0.05 is good; 0.05‑0.10 requires attention; >0.10 is crisis.
Step 2
Project Backlog Growth
If current spend is below benchmark, model how backlog will grow over 5‑10 years without intervention.
Step 3
Risk Ranking
Rank projects by safety impact, educational impact, and cost of delay. Use AI to optimise sequencing.
Outcome: A clear, data‑driven narrative: “We are currently spending $1.75M annually. To stabilise our buildings and prevent further deterioration, we need $2.75M — a $1M increase. This will reduce emergency repairs by 40% and extend roof life by 10 years.”
Phase 3: Budget Modelling & Long‑Range Capital Planning
With gaps identified, the next phase builds a multi‑year capital improvement plan (CIP). AI‑driven lifecycle cost modelling compares repair vs. replace options, calculates optimal replacement cycles for roofs, HVAC, windows, and flooring, and generates 5‑year and 10‑year spending scenarios. The model also incorporates inflation, energy savings from upgrades, and potential bond financing costs. The result is a defensible, phased budget that shows exactly how much is needed each year and what will be achieved.
Scenario Planning
Model “maintain current spend” (backlog grows to $XXM), “optimal spend” (backlog stabilises), and “catch‑up” (backlog eliminated in 10 years).
Lifecycle Cost Analysis
Compare repair vs replace for major systems. Example: replacing a 25‑year‑old HVAC unit now saves $200K in repairs over 10 years.
Bond Financing Scenarios
Calculate tax impact per $100,000 home value for different bond sizes. Show voters the cost of doing nothing.
Phase 4: Board Presentation & Approval
With a complete budget model, the next step is presenting to the school board. AI‑driven reporting tools generate professional dashboards, infographics, and one‑page summaries that clearly show: current condition, benchmark comparison, recommended budget increase, specific projects planned, and expected outcomes. The presentation includes interactive elements such as building‑by‑building FCI scores, photos of failing systems, and a timeline of improvements. Board members appreciate data over anecdotes.
1 week prior
Generate Board Packet
AI compiles executive summary, detailed budget tables, scenario comparisons, and risk assessment.
Board Meeting
Presentation & Q&A
Live dashboard showing FCI trends, project prioritisation, and tax impact calculator.
Voter Outreach
Bond Campaign Materials
Create public‑facing website, flyers, and social media graphics from the same data set.
Phase 5: Bond Referendum Data Preparation
When a bond is required, the data package becomes even more critical. Successful bond campaigns use visual, transparent information: interactive maps showing which schools receive improvements, cost breakdowns by project type (roofing, HVAC, safety, accessibility), and a clear statement of the tax impact. AI platforms can generate these materials automatically, ensuring consistency and accuracy. Districts using AI‑driven reporting have reduced bond preparation time from 3‑4 months to 4‑6 weeks and increased voter approval rates by an average of 12%.
Interactive Bond Dashboard
Voter engagement +47%
Districts providing online dashboards with building‑level data see higher voter turnout and approval.
Tax Impact Calculator
Transparency builds trust
Allow residents to see exact cost per $100,000 home value. Example: $28M bond = $42/year for median home.
Before/After Visuals
Emotional connection
Show photos of failing roofs, outdated HVAC, and unsafe playgrounds alongside planned improvements.
Cost of Delay Analysis
Urgency creation
Model increased costs if bond fails: “Delaying roof replacement adds $500K in emergency repairs over 3 years.”
Budget Before vs After: Using AI‑Driven Benchmarks
Budget request justification
“Things are breaking” (anecdotal)
Benchmark data + FCI scores + lifecycle cost models
Data‑driven
Board approval rate
60‑70%
85‑95%
+25%
Bond referendum preparation time
3‑4 months
4‑6 weeks
-75%
Voter approval rate (bonds)
58%
70%
+12%
Deferred maintenance backlog trend
Growing 5‑8% annually
Stabilising or decreasing
Reversed
8 Lessons From Districts That Mastered Maintenance Budgeting
01
Start With a Facility Condition Assessment — No Data, No Budget
Districts that attempted budget requests without an FCI failed to gain board confidence. Those with a third‑party assessment (FCI scores per building) succeeded. Lesson: you cannot defend a budget without knowing your asset condition.
Book a demo to see how AI streamlines condition assessment.
02
Use National Benchmarks — Don't Just Compare to Yourself
A district spending $4/sq ft thought they were efficient — until they learned the national average for high schools is $6.50. They were underfunding by $2.5M/year. Lesson: external benchmarks provide objective justification.
03
Show the Cost of Doing Nothing
One district modelled that continuing current spending would increase deferred maintenance from $12M to $28M in 10 years. The board approved a 15% budget increase. Lesson: quantify the downside of inaction.
04
Prioritise by Safety and Educational Impact
Board members care about student safety and learning environments. Rank projects: fire alarms, roof leaks (affects classrooms), HVAC (affects attendance), then aesthetics. Lesson: tie every dollar to student outcomes.
05
Use Visuals — Photos and Dashboards Win
A 10‑page spreadsheet gets ignored. A one‑page dashboard with building photos, FCI scores, and a tax impact slider board? Approved. Lesson: invest in visual communication tools.
Talk to iFactory about board‑ready dashboards.
06
Plan for Preventive Maintenance — Not Just Emergencies
Many districts allocate 80% of budget to reactive fixes. AI‑driven planning shifts to 30% preventive, 30% capital renewal, 20% reactive, 20% deferred catch‑up. Lesson: preventive maintenance costs 1/3 of emergency repairs.
07
Involve the Community Early in Bond Planning
Districts that held town halls with interactive dashboards (allowing residents to explore projects) saw 20% higher bond approval. Lesson: transparency builds trust.
08
Update Your Budget Annually — Don't Set and Forget
Conditions change, inflation occurs, new needs arise. Districts that review their budget annually against updated benchmarks stay ahead of the backlog curve. Lesson: budgeting is a continuous cycle, not a one‑time event.
The iFactory Budgeting Platform for K‑12 Districts
The platform that has helped over 50 school districts build data‑driven maintenance budgets, pass bond referendums, and reduce deferred maintenance is exactly what iFactory delivers. Both cloud‑based and on‑premise deployment options are available.
Cloud‑Based (Recommended)
Fast Deployment, Automatic Benchmark Updates
iFactory cloud platform connects to your facility data, imports FCI scores, and generates board‑ready reports within weeks. No IT overhead. Automatic updates to national benchmarks.
Import existing facility condition assessments
Automated FCI calculations and trending
Board‑ready dashboards and one‑page summaries
Bond campaign website builder
Get Cloud Quote
On‑Premise (Self‑Hosted)
For Districts with Strict Data Policies
For districts requiring data to remain on‑site, iFactory offers an on‑premise version. Full control over financial and facility data. Ideal for large districts with internal IT.
Data stays within district network
Customizable to your security policies
Integration with existing ERP/financial systems
Full audit trail of budget changes
Talk to a Budgeting Expert
FAQ: K‑12 Maintenance Budgeting
Build a Smarter Maintenance Budget — Get Board Approval Faster
iFactory’s AI‑driven facility analytics platform gives you the benchmarks, forecasts, and visual reports you need to build a defensible maintenance budget and pass bond referendums. See how your district compares to national averages and get a custom budget projection. Book a free, no‑obligation demo today.
K‑12 Budgeting
Maintenance Benchmarks
Facility Condition Index
Bond Referendum
AI Financial Reporting