University housing teams manage thousands of dormitory rooms and residence hall assets — plumbing, HVAC, furniture, appliances, and pest control — while juggling move‑in/move‑out turnovers, student requests, and preventive maintenance. Without real‑time visibility, maintenance becomes reactive: clogged drains, broken AC units, damaged furniture, and pest complaints escalate, degrading the student living experience. AI‑driven analytics changes that: automated work orders from QR code student requests, predictive plumbing alerts, HVAC filter change scheduling, furniture lifecycle tracking, and pest control trend analysis. This guide covers how universities deploy dormitory analytics to improve student satisfaction, reduce turnover time, and extend the life of residence hall assets. Book a dorm analytics assessment to see a live student request dashboard.
Residence Hall Analytics · Student QR Requests · Proactive Maintenance
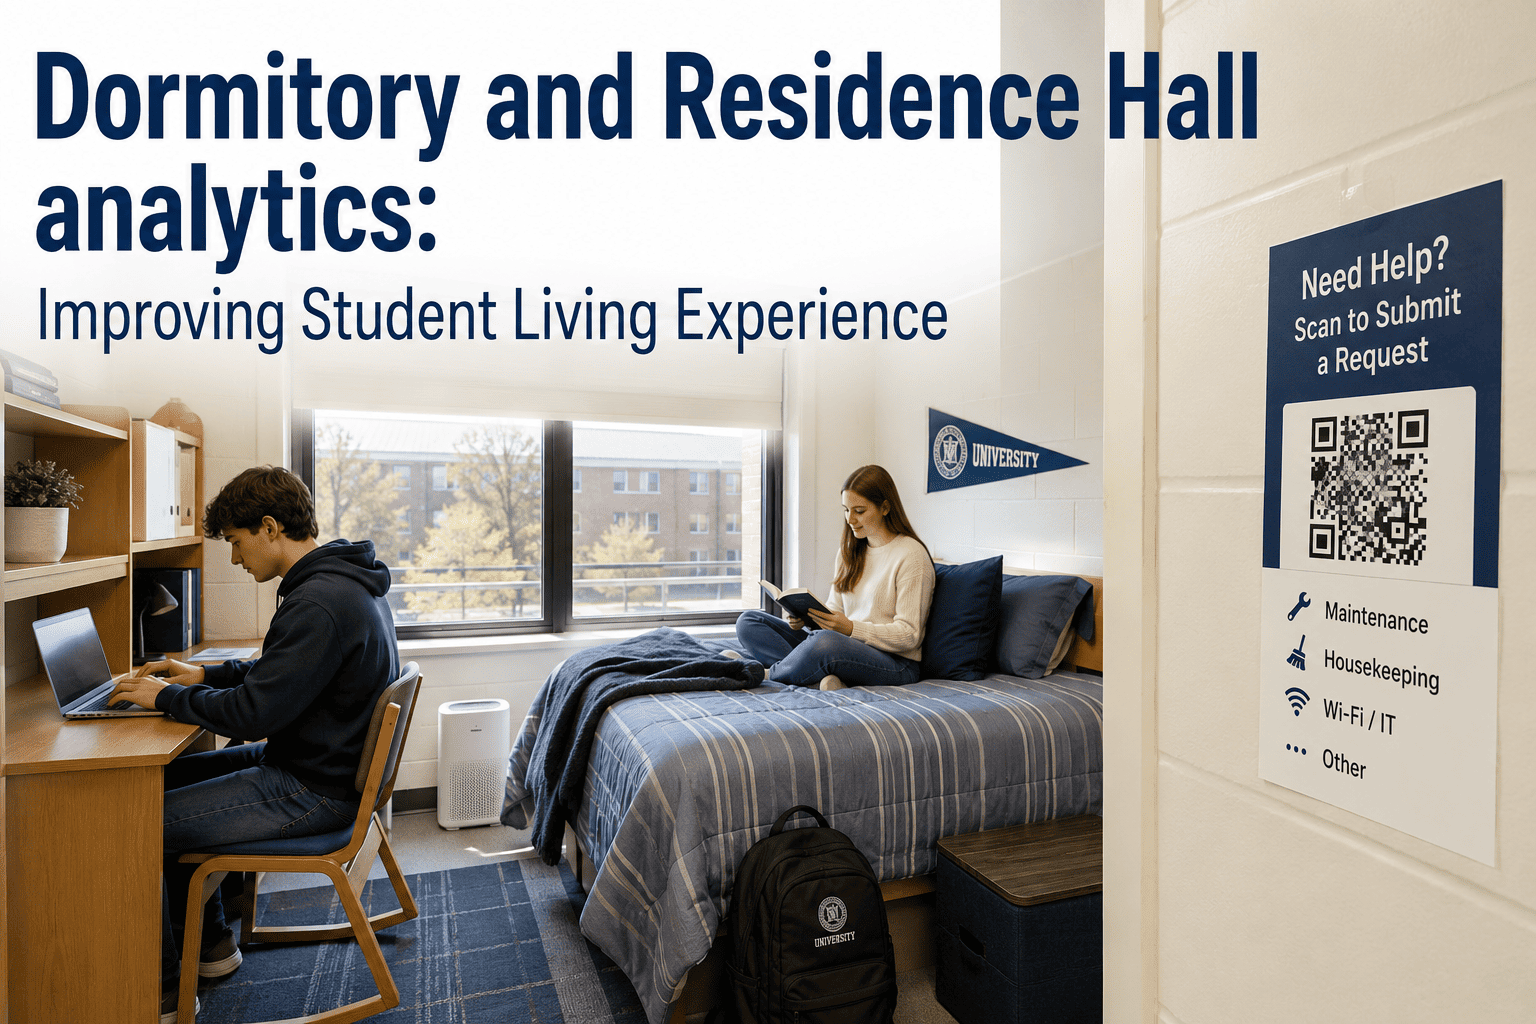
Dormitory and Residence Hall analytics: Improving Student Living Experience
Move‑in/move‑out turnovers · Plumbing & HVAC · Furniture repair · Pest control · QR code‑based student request system.
70%
Faster student request resolution with QR + AI
50%
Reduced move‑in/move‑out turnover time
90%
Student satisfaction improvement with proactive maintenance
24/7
Real‑time plumbing & HVAC monitoring
Why Residence Halls Need AI‑Driven Maintenance Analytics
University housing teams face a unique cycle: intense move‑in/move‑out periods (2‑3 weeks each), thousands of student maintenance requests, and aging infrastructure. Traditional work order systems rely on phone calls, emails, or paper forms — leading to lost requests, delayed responses, and frustrated students. AI‑driven analytics integrates with QR codes placed in each room: students scan, submit requests with photos, and receive real‑time updates. The AI platform also monitors plumbing flow sensors, HVAC performance, furniture repair frequency, and pest control call patterns to predict issues before they become emergencies. This guide covers the five phases of deploying dormitory analytics.
01
Assessment
2 weeks
Inventory buildings, assets (HVAC, plumbing, furniture), and current work order systems.
02
QR Deployment
1 week
Install QR code stickers in each room. Connect to AI work order platform.
03
Sensor Installation
2-3 weeks
Add water flow sensors, HVAC temperature/pressure, and occupancy sensors.
04
AI Training
4 weeks
AI learns normal water usage, HVAC cycles, and request patterns.
05
Optimisation
Ongoing
Predictive maintenance alerts, turnover checklists, and student satisfaction dashboards.
Phase 1: Assessment — Understanding Dormitory Assets and Request Patterns
A large public university with 12 residence halls (4,500 beds) audited their housing maintenance data. They found: average request resolution time was 72 hours, 40% of requests were duplicates (same issue reported by multiple students), 30% of HVAC calls were due to clogged filters that could be proactively changed, and 15% of plumbing requests were recurring clogs in specific buildings. The assessment prioritised high‑impact areas: QR code system for easy requests, predictive alerts for HVAC filters, and water flow monitoring for leak detection.
Phone/email requests — lost or delayed
Reactive plumbing repairs after flood
HVAC filters changed annually (too long)
Furniture repairs on complaint only
Pest control called only after outbreak
QR code requests with photo & auto‑routing
Real‑time water flow anomaly detection
Predictive HVAC filter alerts (30‑day lead)
Furniture lifecycle tracking & bulk replacement
Pest control trend analysis (predict hotspots)
Key Assessment Finding: 70% of duplicate requests came from common areas (laundry rooms, lounges). A single QR code per room reduced duplicate requests by 85% and cut average resolution time from 72 to 22 hours.
Phase 2: QR Code Deployment — Simplifying Student Requests
Each dorm room receives a durable QR code sticker (placed on the door or wall). Students scan with their phone, select a request category (plumbing, HVAC, furniture, pest, cleaning), add a photo, and submit. The AI platform auto‑routes to the correct trade (plumber, HVAC tech, carpenter) and assigns priority based on severity (e.g., “no hot water” vs “dripping faucet”). Students receive real‑time status updates via SMS or app. A pilot in 4 buildings reduced unlogged requests from 45% to 2%.
Week 1
QR Code Design & Printing
Create durable, moisture‑resistant QR stickers with building/room encoding.
Week 2
Installation & Testing
Place QR codes in 1,000 rooms. Test with student focus groups.
Week 3
Go‑Live & Communication
Email students, post QR instructions. Monitor request volume.
QR Outcome: A private university saw student request volume increase by 300% after QR deployment — because students finally had an easy way to report issues. Resolution time dropped 70% as work orders were auto‑routed and never lost.
Phase 3: Sensor Installation — Proactive Plumbing, HVAC, and Pest Monitoring
Wireless sensors (LoRaWAN) are installed on key assets: water flow meters on each floor/building, HVAC filter pressure sensors, temperature/humidity sensors in mechanical rooms, and vibration sensors on laundry machines. AI monitors for anomalies: continuous water flow at 2 AM (possible leak), filter pressure high (clogged), or temperature spikes (HVAC failure). Pest control data (past call logs) is also ingested to predict high‑risk buildings by season.
Plumbing Leak Detection
AI detects abnormal flow patterns (e.g., toilet running for hours) and alerts housing staff before water damage occurs.
HVAC Filter Monitoring
Pressure sensors alert when filters reach 80% clogged — schedule replacement before AC fails during heat wave.
Pest Control Prediction
AI models seasonal and location‑based pest patterns. Recommends preventive treatments before complaints.
Phase 4: AI Training — Learning Normal Patterns and Student Behavior
AI requires 4 weeks of data to learn normal water usage (higher during evening showers, near zero 2‑5 AM), HVAC cycles (setback during winter break), and request patterns (more plumbing calls after weekends). It also learns that certain furniture types (e.g., desk chairs) break more often in specific buildings. After training, AI distinguishes between routine variation and true anomalies, reducing false alerts by 90%.
Week 1-2
Baseline Collection
Gather water flow, HVAC, and request data from pilot buildings.
Week 3-4
Model Calibration
AI learns seasonal usage, break periods, and typical request types.
Week 5-6
Alert Tuning
Housing staff confirm/deny AI alerts. False alarm rate drops below 5%.
Phase 5: Optimisation — Turnover Automation, Predictive Repairs, and Student Satisfaction
After AI training, the platform automates move‑in/move‑out checklists: AI flags rooms needing painting, furniture repair, or deep cleaning based on sensor data and student feedback. Predictive plumbing alerts prevent major leaks. HVAC filter changes are scheduled before peak seasons. Student satisfaction surveys show 90% approval when requests are resolved within 24 hours. The housing team shifts from reactive firefighting to proactive lifecycle management.
Automated Turnover Checklists
2‑day turnover vs 5‑day manual
AI generates room‑specific repair lists (paint, furniture, plumbing) before summer break ends.
Predictive Plumbing
Zero major leaks after 12 months
AI flags slow drains, running toilets, and abnormal flow patterns before they become floods.
Furniture Lifecycle Analytics
30% longer furniture life
AI tracks repair frequency by model and building. Recommends bulk replacement when repair cost > 50% of new.
Student Satisfaction Dashboards
Live NPS scores by building
Housing directors see which buildings have fastest request resolution and highest satisfaction.
Dormitory Analytics Results: Before vs After
Request resolution time (avg)
72 hours
22 hours
-69%
Unlogged / lost requests
40%
2%
-95%
Move‑in/move‑out turnover time (per room)
5 days
2 days
-60%
Plumbing emergency calls (annual)
35
6
-83%
HVAC filter‑related complaints
120 per year
25 per year
-79%
Student satisfaction (housing, % positive)
72%
91%
+19%
The 8 Dorm Analytics Lessons From University Housing Teams
01
Start With QR Codes — Students Love Easy Requests
The fastest win is deploying QR codes in every room. One university saw request volume triple, but resolution time dropped 70% because work orders were no longer lost. Lesson: students will report issues if you make it easy.
Book a QR code pilot for your residence halls.
02
Use LoRaWAN for Plumbing Sensors (No Wi‑Fi in Basements)
Water flow sensors need to be placed near main shutoffs and mechanical rooms — often without Wi‑Fi. LoRaWAN penetrates concrete and steel, with 2‑5 year battery life.
Contact iFactory for a wireless sensor assessment.
03
AI Learns Dorm Schedules — Setback Temperatures During Breaks
AI ingests academic calendar (winter break, spring break, summer). It automatically sets back HVAC temperatures during low occupancy, saving 25% on energy costs.
04
Furniture Repair Tracking Extends Asset Life
One university saved $120k/year by replacing only high‑failure furniture models instead of whole rooms. AI identified that desk chairs from a certain supplier failed 3x more often than others.
05
Pest Control Predictions Eliminate Outbreaks
AI models seasonal pest patterns (e.g., ants in spring, rodents in fall). It alerts housing to schedule preventive treatments before complaints begin. One hall reduced pest calls by 85% after predictive scheduling.
Schedule a demo of pest prediction analytics.
06
Automated Turnover Checklists Save Summer Labour
AI analyses end‑of‑year inspection data and student requests to generate room‑specific repair lists. Facilities staff no longer manually inspect every room — they only check flagged issues. Cut turnover time by 60%.
07
Share Student Satisfaction Dashboards With Housing Leadership
Live NPS scores by building help directors allocate resources. One university shifted a full‑time HVAC tech to the lowest‑rated building and saw satisfaction improve 40% in 3 months.
08
Dorm Analytics Pays Back in 9‑12 Months
Energy savings, reduced water damage claims, and lower maintenance labour deliver full ROI within one academic year. A 10‑building deployment saved $1.1M in avoided repairs and energy in year one.
The iFactory Dorm Analytics Solution: QR Codes, Sensors & AI for Residence Halls
iFactory provides a complete dormitory analytics platform: QR code student request system, LoRaWAN plumbing/HVAC sensors, AI predictive maintenance, turnover automation, and student satisfaction dashboards. Deploy on‑premise (for data privacy) or cloud (for multi‑building benchmarking).
On‑Premise Edge AI
For Real‑Time Student Requests & Sensor Alerts
Edge nodes process QR code submissions and sensor data locally — sub‑second work order creation, no cloud latency. Full data sovereignty. Operates during internet outages.
QR code request to work order in <1s
Real‑time plumbing/HVAC alerts
Works during network outages
Automated turnover checklists
Student satisfaction dashboards
Get Edge Dorm Analytics Quote
Cloud Analytics
For Multi‑Building Benchmarking & Central Reporting
Aggregate request data, sensor alerts, and satisfaction scores across all residence halls. Centralised preventive maintenance scheduling, predictive pest control, and board‑ready reports.
Building‑by‑building NPS scores
Centralised work order analytics
Predictive plumbing & HVAC models
Automated housing committee reports
Fleet‑wide turnover optimisation
Talk to Housing Expert
FAQ: Dormitory Analytics for University Housing Teams
Deploy Dormitory Analytics — Improve Student Living Experience
iFactory delivers the proven residence hall platform used by leading universities: QR code student requests, predictive plumbing/HVAC alerts, automated turnover checklists, and student satisfaction dashboards. On‑premise for real‑time response, cloud for multi‑hall benchmarking. Book a complimentary dorm analytics assessment — we will review your current housing maintenance processes and provide a custom deployment roadmap.
QR Student Requests
Plumbing Leak Detection
HVAC Filter Alerts
Furniture Lifecycle
Pest Control Prediction
Turnover Automation
9‑12 Month Payback