Campus technicians spend more time walking to computers and filling out paper logs than diagnosing equipment. A typical school district facilities team member completes 8 to 12 work orders per day, but each one requires returning to an office workstation to close out the task, look up asset history, or log inspection results. That is 60 to 90 minutes of lost productivity per technician per day. Mobile analytics for campus technicians solves this by putting asset data, work order management, and AI-driven fault intelligence directly on the devices technicians already carry — their phones. This guide explains what a mobile analytics app does for education facilities, which features matter most for technicians in the field, and how iFactory delivers a purpose‑built mobile experience for K‑12 and university operations teams. See the iFactory mobile analytics app for campus technicians — Book a Demo.
Empower your field technicians with real‑time asset data, AI‑driven fault alerts, and instant work order management — all from their mobile devices. Stop making technicians walk back to a computer to close a work order.
Why Campus Technicians Need a Mobile Analytics App
Facility management software has traditionally been designed for desktop computers — for managers sitting in offices, not technicians walking buildings. This creates a productivity gap. A technician responding to an HVAC alarm in a classroom needs immediate access to that unit's maintenance history, fault codes, and energy trends. Instead, they radio the office, wait for someone to look up the information, or walk back to a workstation. The result is delayed diagnosis, extended downtime, and technician frustration.
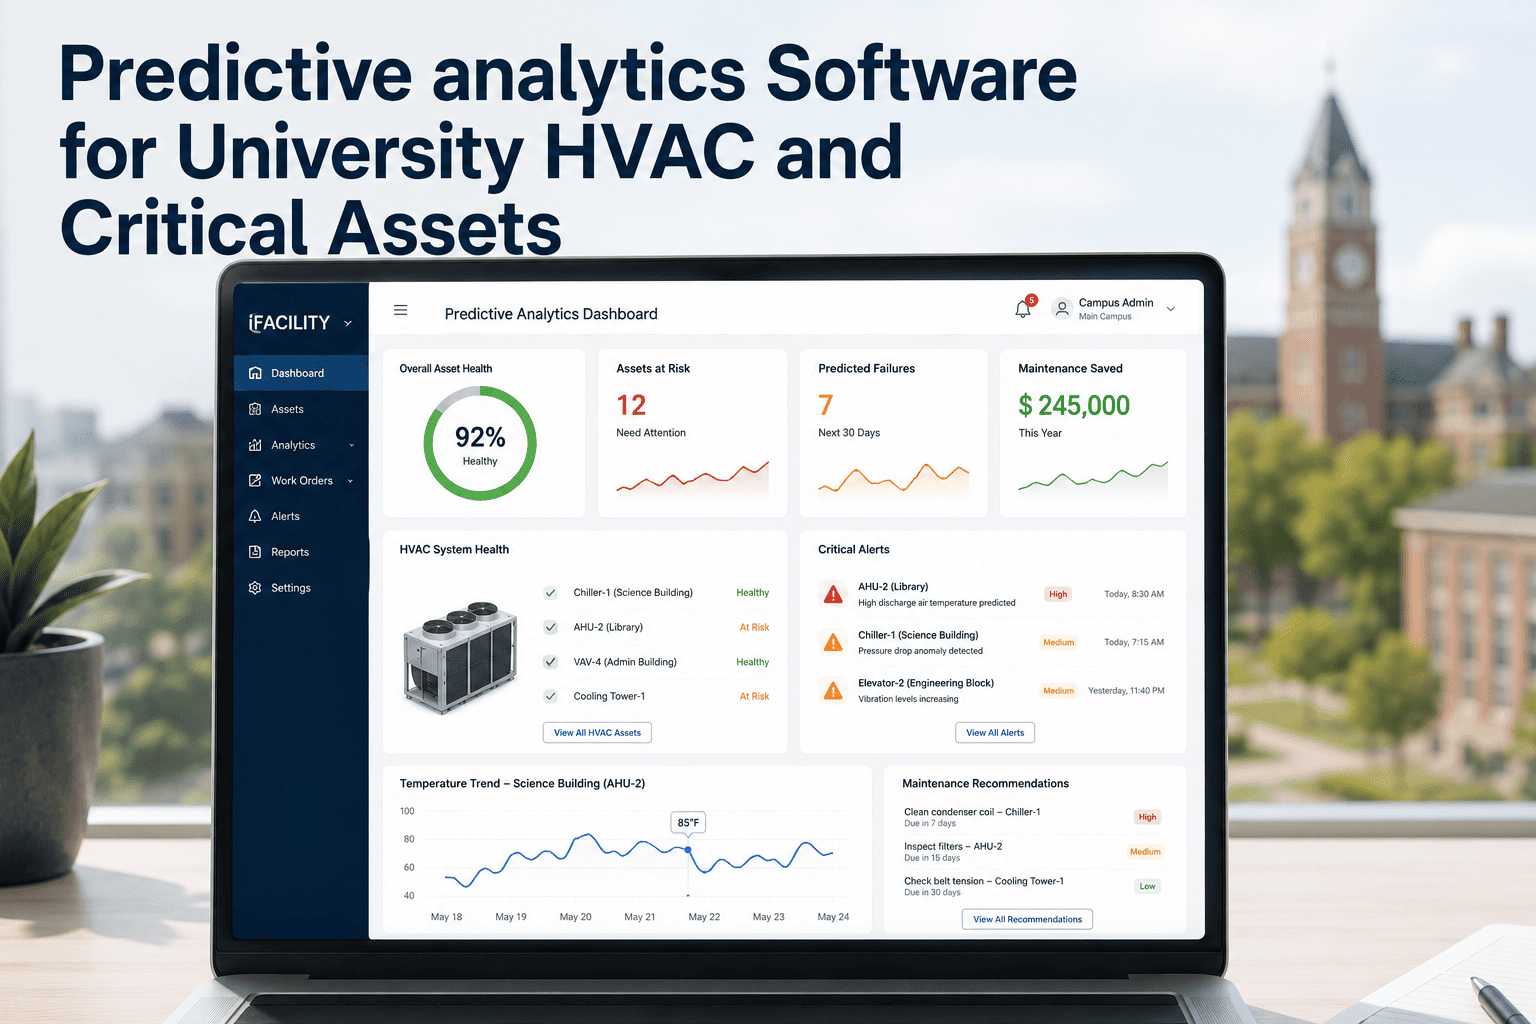
A mobile analytics app changes this by putting the facility intelligence layer directly on the technician's phone or tablet. The same AI fault detection that runs on the central platform surfaces as a mobile alert: "Air handler AHU‑12 supply fan vibration exceeds threshold — recommended inspection." The technician sees the alert, opens the asset record, reviews recent trends, closes the work order on‑site, and logs inspection photos — all without leaving the mechanical room. For a district with 10 technicians, reclaiming 60 minutes per day each adds up to over 2,000 productive hours annually.
Key Features of a Mobile Analytics App for Campus Technicians
Not all mobile facility apps are equal. A mobile analytics app must do more than display a work order list — it must provide the analytical intelligence that helps technicians diagnose problems faster, document work completely, and close tasks without returning to an office. The features below are the minimum requirements for a technician‑facing mobile analytics solution in education facilities.
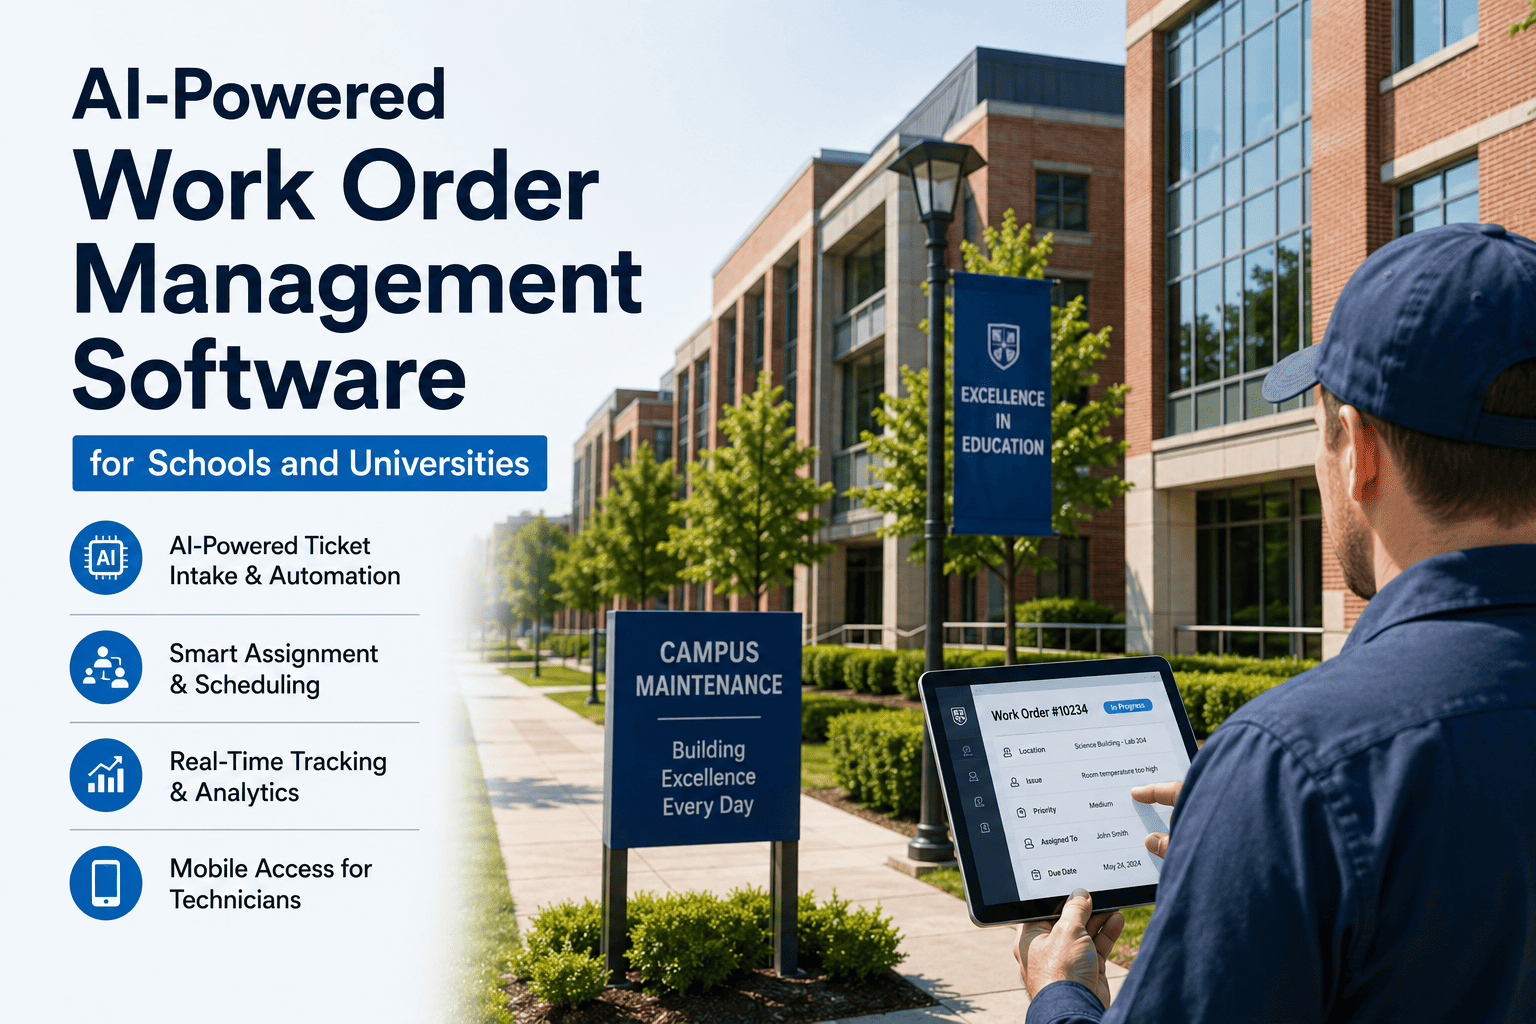
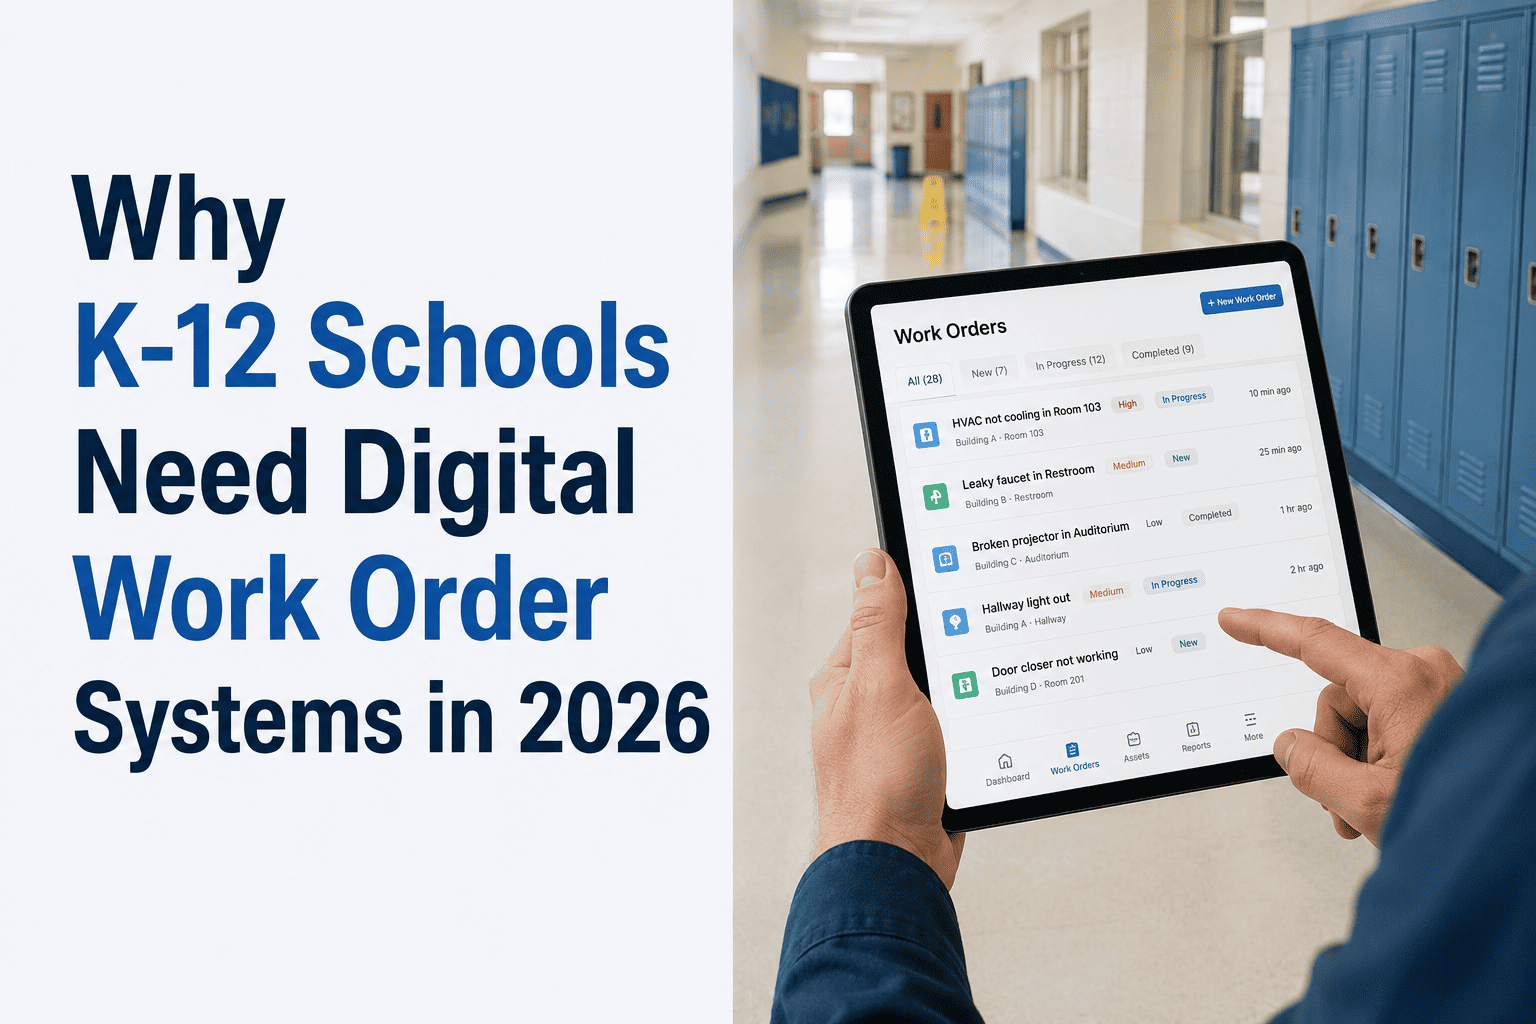
Create, assign, update, and close work orders directly from mobile. Add notes, photos, and parts used. Status changes sync instantly with the central CMMS.
Scan a QR code or NFC tag on any asset to pull up maintenance history, past work orders, warranty info, and manufacturer documentation.
Push notifications for active faults detected by analytics. Technicians see "Chiller CH‑3 efficiency drop" before the building gets warm.
Customizable forms for daily rounds, weekly PMs, and compliance checks. Complete on‑device, attach photos, sign off electronically.
Caches work orders and asset data locally. Syncs automatically when connectivity returns. No lost data in dead zones.
View real‑time and historical trends — supply air temperature, pressure, energy use, vibration — directly on mobile.
Work Order Management on Mobile: From Assignment to Closure
The work order lifecycle for a campus technician should be entirely manageable from a mobile device. A technician arrives at the jobsite, opens the assigned work order, reviews attached notes and photos, performs the repair or inspection, logs parts and time, adds completion notes and photos, and closes the work order — all without opening a laptop or returning to a shop. When work orders can be closed on‑site, administrative overhead drops by 70‑80%.
Asset Access and QR/NFC Integration for Campus Equipment
One of the most powerful features of a mobile analytics app is instant asset access via QR codes or NFC tags placed on equipment. A technician walking into a mechanical room points their phone at a QR code on the chiller control panel. Instantly, they see the complete asset record — installation date, last service, known fault history, warranty status, and a link to the manufacturer's manual. They can also view live trends from the BAS and recent analytics alerts specific to that asset.
For a campus with hundreds of assets, QR code tags cost less than $1 each to produce and apply. The time savings from eliminating manual asset search — walking back to a computer, navigating a CMMS, typing an asset ID — pays for the entire tagging project within weeks. Schools implementing mobile asset access typically see a 50‑70% reduction in time spent locating asset information before starting a repair.
Print weather‑resistant QR code labels for each major asset. Affix near the equipment's control panel or nameplate.
Technician opens iFactory mobile app, taps "Scan Asset," and points camera at QR code. Asset record loads in under 2 seconds.
Asset dashboard shows open work orders, recent analytics alerts, live BMS trends, parts inventory, and maintenance history.
From the asset record, technician can create a new work order, log an inspection, view fault history, or check warranty status.
Inspection Logging and Compliance Documentation on Mobile
Regulatory compliance — OSHA logs, NFPA testing, EPA refrigerant tracking, local fire code inspections — requires documented evidence that inspections occurred on schedule and results met standards. Paper logs and spreadsheet tracking leave compliance records vulnerable to loss, illegibility, and audit failure. Mobile inspection logging solves this by capturing inspection data at the point of execution, with timestamps, geolocation, and photo evidence attached automatically.
iFactory's mobile app includes configurable inspection checklists for daily rounds, weekly PMs, monthly fire system checks, and annual compliance surveys. When a technician completes an inspection on mobile, the results are immediately written to the asset's permanent record and can be included in compliance reports with a single click. No manual data entry, no lost paperwork, and no audit anxiety.
What iFactory's Mobile Analytics App Delivers for Campus Technicians
iFactory provides a purpose‑built mobile experience for campus technicians and facility teams. The mobile app is not a scaled‑down desktop interface — it is designed from the ground up for field use, with large touch targets, offline operation, and deep integration with the iFactory analytics engine. Technicians get the same AI fault detection, asset intelligence, and work order management that facility managers see on desktop, but optimised for phone‑first workflows.
Technicians using iFactory mobile close 95% of work orders without returning to a computer — administrative time reduced by over 80%.
Scan any tagged asset to see complete maintenance history, live trends, and open work orders — information that previously took 5‑10 minutes.
Cached work orders, asset data, and inspection forms work in basements and remote buildings — syncs automatically when network returns.
Technicians receive proactive alerts when analytics detect deterioration — before failure causes a comfort complaint.
Frequently Asked Questions
iFactory mobile gives campus technicians instant asset access, AI fault alerts, and work order management from any smartphone. Core features live in 2 weeks, full deployment in 60 days.