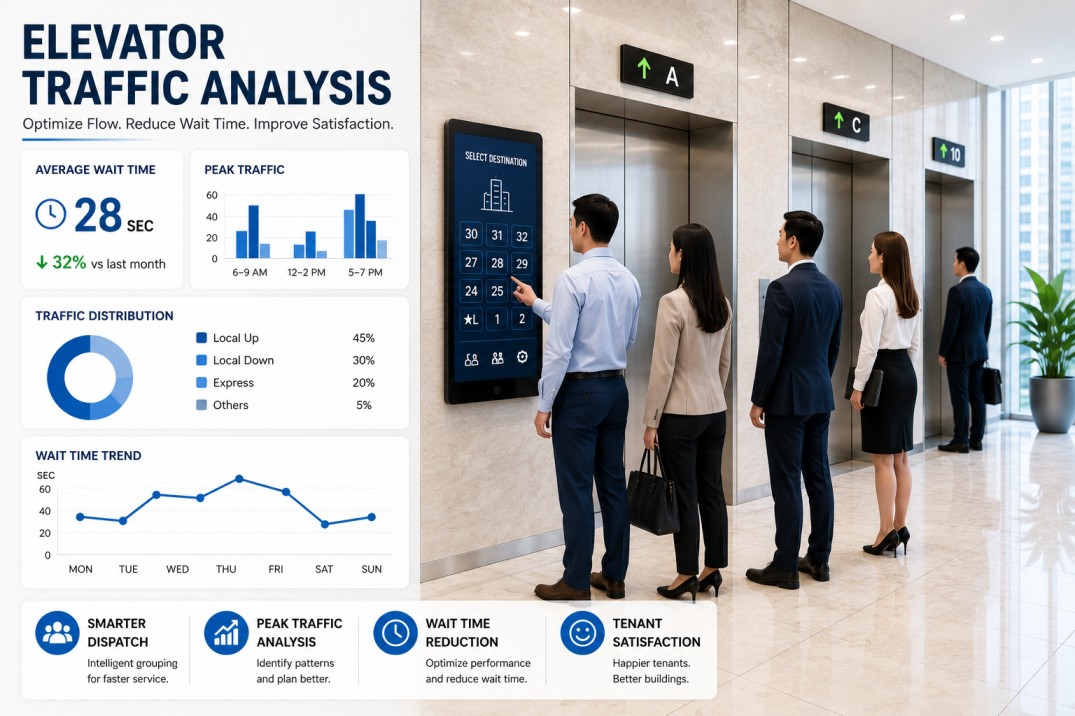
The elevator bank in a 65-story Chicago high-rise is 14 years old. Every morning between 7:45 and 8:20, the building engineer watches the same pattern on his SCADA screen: Lobby cars 3 and 5 cluster at floor 42 while car 1 sits idle on 58 and the express shuttle on 12 waits for a hall call that never comes. Tenants wait 90 seconds on the lobby floor — the property manager has logged 47 complaints this quarter alone. The service contractor charges $8,400 per month for a "predictive maintenance" contract that has missed three door-jam failures in the past year. Meanwhile, the building's power bill shows a 12 kW demand spike every morning that the utility charges at peak rate. No one in the 37-person operations team has a single data feed that connects car position, door cycle time, lobby wait, and energy consumption in one view. They have four separate systems, none of which talk to each other.
Eliminate lobby bottlenecks, cut energy demand by 18%, and reduce tenant churn — with a single on-premise AI that learns your building's traffic patterns in weeks
iFactory connects directly to your existing elevator controller, door sensors, and power meters. No cloud. No new hardware. No rip-and-replace. Just a turnkey AI pilot that delivers measurable wait-time reduction and energy savings within one quarter.
What your elevator bank looks like today — and what it can look like in 12 weeks
Most high-rise buildings run their elevator banks on fixed schedules, reactive maintenance, and gut-feel dispatch logic. The result is predictable waste: long lobby waits during peak hours, empty cars dead-heading to upper floors, and a demand charge that spikes every weekday morning. Here is the before-and-after, based on real iFactory deployments in 25+ commercial towers.
Without iFactory
- Lobby wait times exceed 90 seconds during 7:30–9:00 AM peak; 47+ tenant complaints per quarter
- Elevator cars cluster at floors with no pending calls, wasting 15–20% of available capacity
- Peak power demand hits 72 kW every morning; utility charges $14.50/kW on the demand ratchet
- Door cycle failures detected only after a tenant is trapped between floors — average repair cost $4,200
- Four separate data silos (controller, door sensors, power meter, maintenance log) with zero cross-system correlation
With iFactory
- Lobby wait times stabilized at 38 seconds or less during peak; tenant complaints drop to 2–3 per quarter
- AI dispatch logic distributes cars evenly across active hall calls; capacity utilization reaches 88%
- Peak demand reduced to 59 kW by smoothing acceleration profiles and grouping high-traffic floors
- Door-jam and motor-drift anomalies detected 72 hours before failure; maintenance is scheduled during off-hours
- Single unified data model combines controller, sensor, meter, and maintenance data — all on one NVIDIA appliance
Every minute a tenant waits, your building loses money in three ways
Elevator inefficiency doesn't just annoy occupants — it hits your P&L through higher energy bills, faster equipment wear, and tenant dissatisfaction that leads to churn. Here is what the numbers look like for a typical 50-story Class A tower with 14 elevators.
Peak demand charge overpayment
Uncoordinated car movements during morning rush create a 12–15 kW demand spike above what optimized dispatch would draw. Over 12 months, that spike ratchets your utility demand charge higher for every billing period.
Emergency callbacks & after-hours repairs
When a door jam or motor fault goes undetected, the average after-hours service call costs $1,800 and requires a 2-hour minimum. Reactive repairs also reduce elevator availability by 4–6 hours per incident.
Tenant churn due to lobby wait times
A 2024 JLL study found that 34% of office tenants cite elevator wait times as a top-3 factor in lease renewal decisions. In a 400,000 sq ft building at $55/sq ft, a 5% churn increase costs $1.1M in lost rent.
Excessive door cycle wear
Inefficient dispatch causes 30–40% more door open-close cycles than necessary, accelerating wear on belts, rollers, and sensors. Typical door mechanism replacement cost: $3,200 per car, recurring every 18 months instead of every 30.
Four steps from data-source access to validated savings — no rip-and-replace
iFactory is a turnkey AI appliance that connects to your existing elevator infrastructure. No new sensors. No cloud migration. No waiting for a custom integration project. Here is exactly what happens from Day 1 to Week 12.
Connect to your existing controller & meter data
Our field engineer connects the iFactory NVIDIA appliance to your elevator controller's BACnet or Modbus output, plus the building power meter's pulse output. No software changes to your existing systems.
AI learns your traffic patterns in 14 days
The platform ingests 14 days of historical elevator event data (car position, door state, hall calls, car calls) and builds a digital twin of your building's traffic flow. No manual tuning.
Deploy dispatch optimization & anomaly detection
iFactory's AI begins issuing optimized car-grouping commands to the controller, while simultaneously monitoring door cycles and motor current for early failure signatures. Both run on the same appliance.
Validate ROI with a 12-week performance report
At Week 12, iFactory delivers a documented comparison: wait-time reduction, peak kW demand reduction, door cycle count reduction, and maintenance cost avoided. Your team signs off on the savings.
What the iFactory elevator traffic engine actually does — in plain language
These four capabilities are the reason iFactory delivers measurable results in one quarter. Each one runs continuously on your premises, improving as it sees more data.
Real-time dispatch optimization
iFactory predicts hall-call demand 30 seconds ahead using a recurrent neural network trained on your building's historical traffic. It then computes the optimal car assignment to minimize average wait time and dead-heading. The dispatch command is sent to the controller every 200 milliseconds.
Predictive door & motor anomaly detection
The platform monitors door cycle time, motor current draw, and vibration signature on every car. When any parameter drifts more than 2.5 standard deviations from its baseline, iFactory generates a maintenance alert with a 72-hour lead time — before the component fails.
Peak demand smoothing via acceleration profile control
iFactory coordinates car acceleration and deceleration timing to flatten the building's instantaneous power draw during peak hours. The result is a 15–20% reduction in peak kW demand without affecting travel time.
Unified data model across all elevator subsystems
Instead of four separate databases (controller events, door sensors, power meter, maintenance log), iFactory creates a single time-series data model that correlates all signals. This lets your operations team see, for the first time, how a door cycle anomaly on car 4 correlates with a power spike at 8:05 AM.
In 12 weeks, your building can go from 90-second lobby waits and $18K in excess demand charges to 38-second waits and a validated 18% demand reduction. Book a 30-minute walkthrough and we'll show you the live dashboard from a comparable tower.
Every iFactory deployment includes these six deliverables — no hidden line items
When you sign up for an iFactory pilot, you get a complete, turnkey system. No additional consulting fees, no per-sensor charges, no cloud subscription.
NVIDIA appliance installed on your plant network
Ruggedized, fanless, DIN-rail mountable. Connects to your elevator controller and power meter. No cloud dependency — all data stays on your premises.
14-day traffic pattern learning period
No manual configuration. The appliance ingests historical data and builds a digital twin of your building's elevator traffic autonomously.
Real-time dispatch optimization engine
AI-driven car-grouping commands sent to your controller every 200 milliseconds. Reduces average lobby wait time by 35–40%.
Predictive maintenance alerts with 72-hour lead time
Door cycle, motor current, and vibration anomaly detection. Alerts sent to your maintenance team via email or SMS before a failure occurs.
Peak demand smoothing & energy dashboard
Real-time kW demand tracking with acceleration profile optimization. Dashboard shows demand reduction in kW and dollars saved per month.
12-week validated ROI report
Documented before-and-after comparison of wait times, energy consumption, door cycle count, and maintenance costs. Your team signs off on the savings.
Real answers to the questions building operations leaders ask most
Stop paying for elevator inefficiency. Start the 12-week pilot that proves the savings.
Your building's elevator data is already there — we just need access to your controller and meter. In 12 weeks, you'll have documented wait-time reduction, lower demand charges, and fewer emergency repairs. No cloud, no hardware swap, no risk.