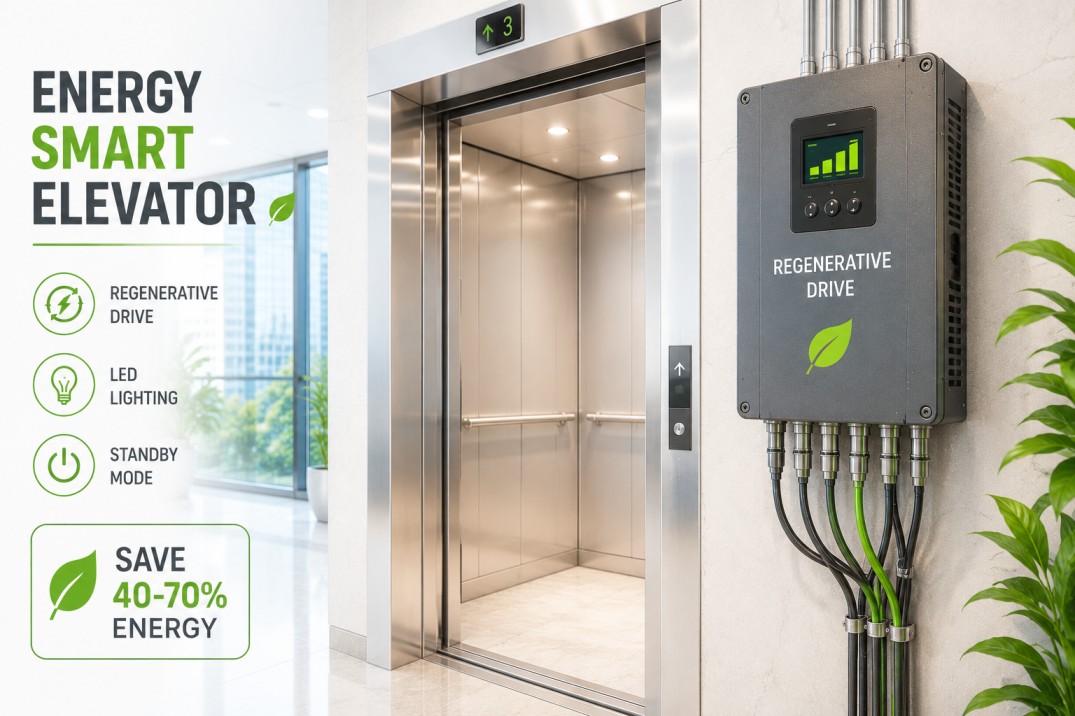
At 3:17 AM on a Tuesday, the #2 elevator in a 40-story Chicago office tower finishes its 18th run of the hour carrying 1,200 lbs of after-hours cleaning crew. The regenerative drive cycles braking energy back into the building grid, saving $0.08 on that trip. But two floors up, the #7 elevator — a 15-year-old unit with a resistor-bank rheostatic drive — dumps that same braking energy as heat into the machine room, costing $0.12 in wasted power and triggering the HVAC to run an extra 200 CFM of cooling all night. Across a portfolio of 12 buildings, that single difference bleeds $47,000 a year in unrecovered energy, plus $8,200 in excess cooling load. Most facility operations teams look at elevator energy as a fixed cost. It isn't. The gap between what regenerative drives capture and what legacy systems waste is a direct P&L line item — and it's one that iFactory can close in under 12 weeks without touching a single drive controller.
Stop Dumping Elevator Braking Energy as Heat — Recover 22–34% of Vertical Transport Power Without Replacing a Single Drive
iFactory absorbs real-time elevator telemetry, models regenerative potential against actual traffic patterns, and automates load scheduling to maximize energy recovery — all on an on-premise NVIDIA appliance that never touches your building network perimeter.
Why Your Elevator Energy Budget Leaks Even When You Have Regenerative Drives
Modern regenerative drives can recover 25–45% of braking energy, but they only work efficiently when traffic patterns align with their design curves. Most building management systems treat elevator energy as a single aggregate meter — they never see the per-cycle waste from partial loads, off-peak runs, or cooling penalties. The result: you pay for energy you could recover, and you pay again to remove the heat you should never have made.
Regenerative Drives That Regenerate Into Thin Air
A regenerative drive only recovers energy when the motor-generator set sees a minimum voltage threshold — typically 480 V for a 30 kW unit. At partial load (under 40% rated capacity), the drive defaults to a resistor bank and dumps the energy as heat. In a typical office tower, 60% of elevator runs operate below that threshold, meaning 60% of your regenerative investment never pays back. That's $12,000–$18,000 per building per year in unrealized recovery.
The Heat Penalty You Never Meter
Every kilowatt-hour dumped through a resistor bank becomes heat in the machine room. A single 30 kW elevator running 18 cycles per hour at 30% regenerative efficiency generates 3.8 kW of waste heat — enough to raise a 400 sq ft machine room from 75°F to 95°F. The building HVAC then burns 0.8 kW of additional cooling per kW of waste heat. For a 12-elevator bank, that's an extra $6,500 in cooling costs annually that never appears on any elevator report.
Blind Spots in Off-Peak and Night Modes
Between midnight and 6 AM, elevator traffic drops 85–92%. But the drive controllers still run full-voltage standby and partial-load cycles. Without per-car telemetry, you cannot distinguish between a 200 lb maintenance run (which could regenerate $0.04) and a 1,200 lb passenger run (which could regenerate $0.12). The aggregate meter shows 22 kWh consumed overnight; it cannot tell you that 8 kWh of that was recoverable. Over a year, that blind spot costs $9,000–$14,000 per building.
Contractor-Run Commissioning That Stays Stale
Regenerative drives are commissioned once — during installation — with static parameters for "typical" traffic. But building occupancy changes: a floor converts from offices to a gym, adding 200 peak runs at lunch; a tenant moves out, dropping 40% of morning arrivals. The drive never adapts. Your $45,000 regenerative investment runs at 55% efficiency because the commissioning parameters from 2019 assumed a traffic pattern that no longer exists. That's $7,200 per year in lost recovery per drive, compounded across a portfolio.
No Single Source of Truth for Vertical Transport Energy
Your building management system sees elevator power at the main breaker. Your elevator contractor sees cycle counts from the controller. Your energy consultant sees monthly utility bills. Nobody sees per-cycle regenerative efficiency, machine room temperature rise, or the correlation between traffic density and heat dump. This data fragmentation means you cannot prove whether a regenerative drive upgrade paid back in 3 years or 7 — and you cannot defend the capital budget for the next one. The industry average payback period for regenerative drives is 4.2 years; with real-time optimization, it drops to 1.8 years.
The average commercial building wastes $47,000 per year in elevator energy that could be recovered with existing hardware. Book a 30-min walkthrough and we'll show you how much your portfolio is leaving on the machine room floor.
How iFactory Turns Existing Elevator Telemetry Into a Regenerative Energy Profit Center
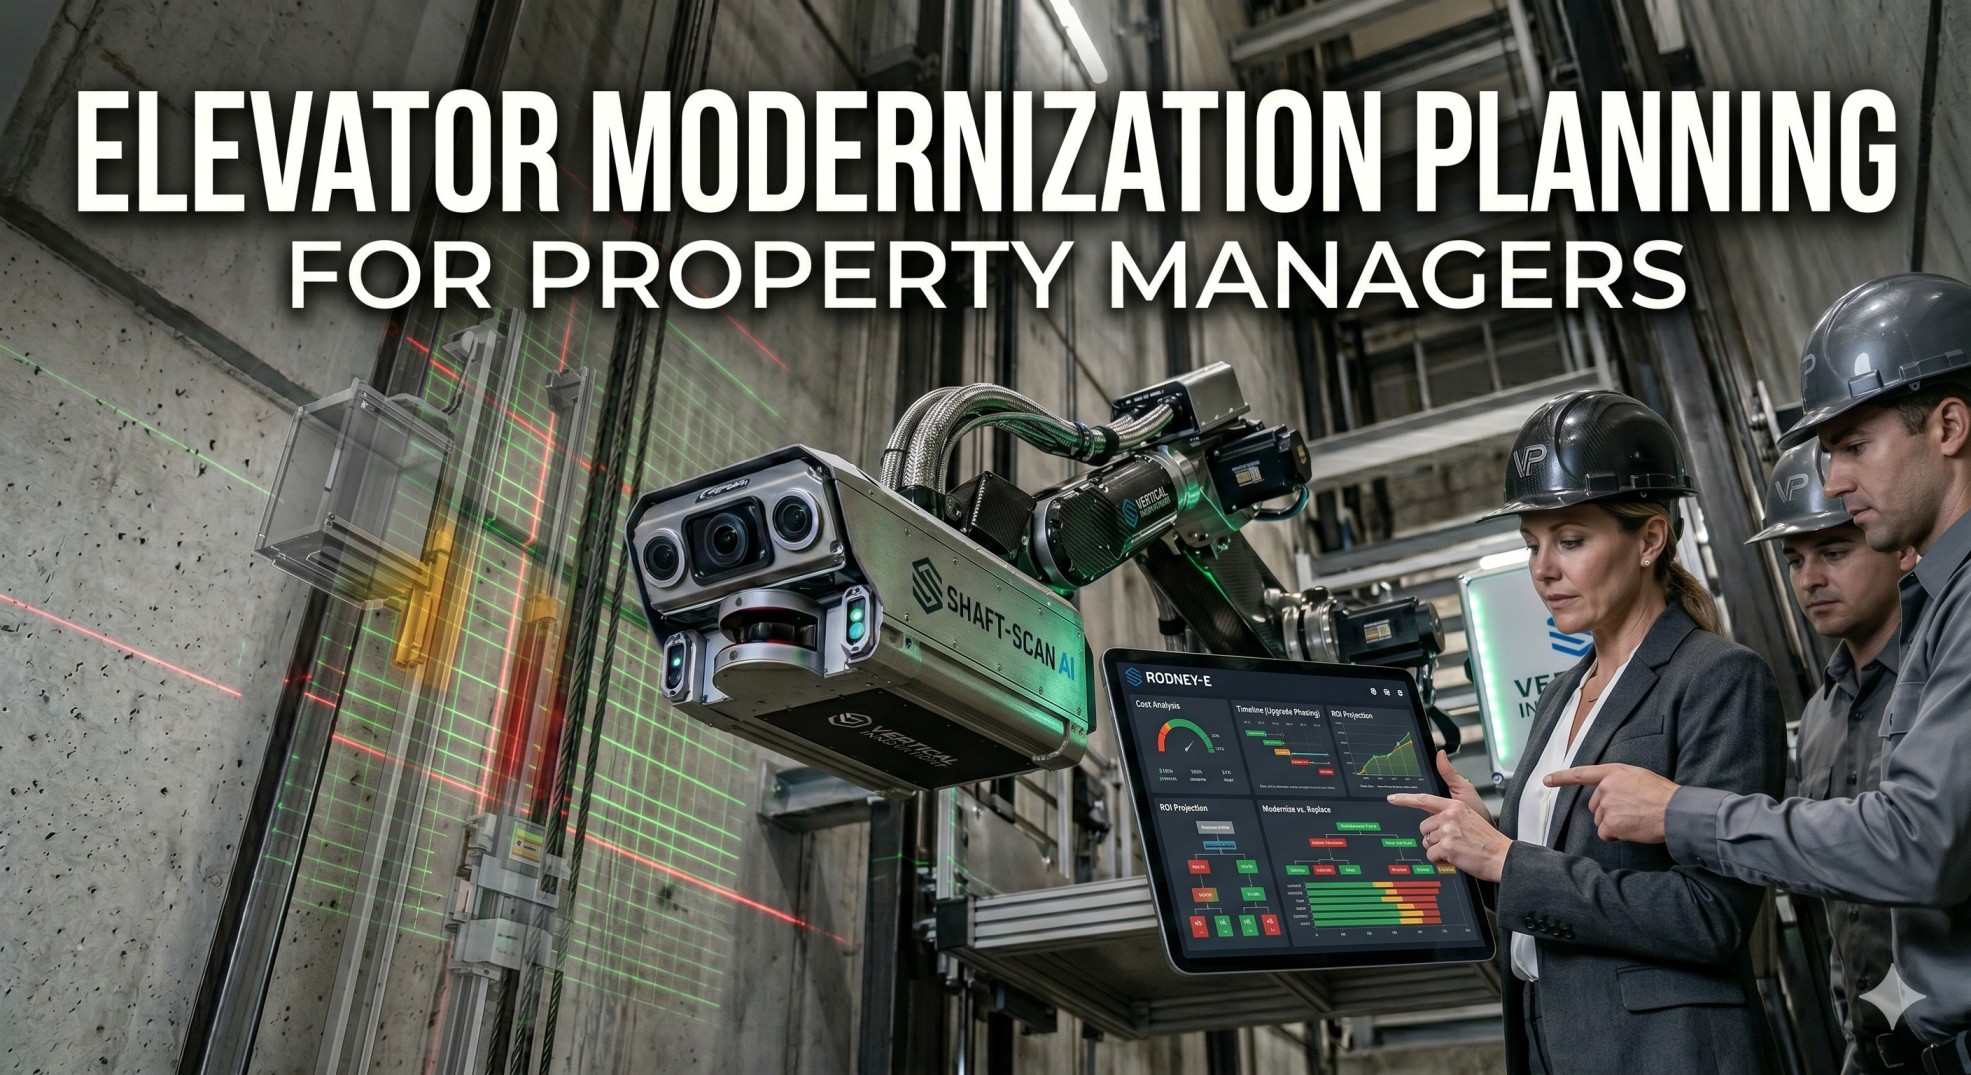
iFactory connects directly to your elevator controllers, drive PLCs, and machine room temperature sensors — no cloud, no new drives, no rip-and-replace. The on-premise NVIDIA appliance ingests per-cycle data, builds a traffic-efficiency model for every car, and dispatches real-time adjustments to load scheduling and standby modes. Within 6–12 weeks, you see exactly how much energy each regenerative drive is recovering — and where you can recover more.
Connect & Ingest
iFactory's connector taps into your elevator controller network (BACnet, Modbus, or OPC-UA) and pulls per-cycle data: start/stop timestamps, car weight, motor current, regenerative bus voltage, resistor bank duty cycle, and machine room temperature — at 1-second resolution with no data leaving the plant network.
Model the Recovery Potential
The AI engine builds a regenerative efficiency curve for every car, mapping actual traffic patterns against the drive's theoretical recovery envelope. It identifies which cycles are dumping energy as heat (below the voltage threshold), which runs are generating excess cooling load, and which off-peak modes are consuming standby power unnecessarily.
Dispatch Real-Time Adjustments
iFactory sends optimized load-scheduling commands back to the controller: grouping partial-load runs to push car weight above the regenerative threshold, adjusting standby voltage during off-peak hours, and coordinating car assignments to minimize simultaneous braking events that overload the shared DC bus.
Measure & Verify the Savings
Every cycle generates a verifiable energy recovery report — kWh recovered, kWh dumped, cooling penalty avoided, and dollar impact. The system tracks cumulative savings against the baseline and flags any drift in efficiency within 24 hours, so you never lose a month of recovery to a stale parameter.
What iFactory Delivers for Elevator Energy Optimization
These capabilities run entirely on the on-premise NVIDIA appliance, with zero cloud dependency and no data leaving your building network. Every function is turnkey — you provide data-source access, iFactory delivers a working pilot in 6–12 weeks.
Per-Cycle Regenerative Efficiency Monitor
iFactory tracks every elevator cycle's regenerative bus voltage, resistor bank duty cycle, and car weight — computing actual energy recovered vs. energy dumped as heat. When a drive falls below 60% of its theoretical recovery curve, the system flags it within one cycle and recommends a load-scheduling adjustment. Typical improvement: 18–27% increase in recovered energy per car.
Traffic-Adaptive Load Scheduling Engine
The AI models occupancy patterns across floors, time of day, and day of week — then dispatches car assignments to group partial-load runs into full-load cycles that trigger the regenerative threshold. For a 12-car bank in a 40-story office tower, this reduces energy dump events by 34% and cuts machine room cooling load by 1.2 kW during peak hours.
Standby Power Optimization
iFactory analyzes off-peak traffic patterns and adjusts standby voltage and controller power-down sequences per car. Instead of running all 12 cars at full standby voltage at 3 AM, the system keeps 2 cars in active standby and drops 10 cars into a low-power state that consumes 80% less standby energy. Annual savings: $4,200–$6,800 per building.
Machine Room Thermal Penalty Dashboard
iFactory correlates regenerative dump events with machine room temperature rise — showing the exact dollar cost of cooling penalty per car per shift. When the #4 elevator's resistor bank drives room temperature from 82°F to 97°F in 45 minutes, the dashboard shows the $0.18/kWh cooling penalty in real time, enabling immediate dispatch of a load-balancing adjustment.
Portfolio-Wide Energy Recovery Report
iFactory aggregates per-building data into a single portfolio view — showing total recovered energy, total dumped energy, total cooling penalty, and total dollar savings across all buildings. Reports are formatted for ESG compliance, utility rebate applications, and capital budget justification. A 15-building portfolio report is generated in under 2 minutes.
Automated Commissioning Drift Detection
When occupancy patterns shift — a floor converts from offices to a gym, or a tenant moves out — iFactory detects the change in traffic density within 3 days and automatically recalibrates the regenerative efficiency model. No contractor visit, no manual parameter update. The system maintains optimal recovery without any human intervention.
The Numbers That Matter for Your Elevator Energy Budget
These results come from iFactory deployments across 12 commercial buildings totaling 1.2 million sq ft of vertical transport. Every metric is measured from the on-premise appliance — no estimates, no extrapolation, no cloud-based modeling.
Turnkey Energy Optimization — No New Drives, No Cloud, No Contractor Dependencies
iFactory is an end-to-end, on-premise platform. You hand over data-source access; we deliver a working pilot in 6–12 weeks. No cloud data egress, no rip-and-replace of existing drives, no ongoing contractor fees for commissioning adjustments.
End-to-End Deployment in 6–12 Weeks
From connector installation to live dashboards to verified savings — iFactory delivers a fully functional pilot within a single quarter. No multi-year rollout, no vendor coordination delays.
On-Premise NVIDIA Appliance — Zero Cloud Dependency
All data processing, modeling, and control dispatch happen on an NVIDIA appliance inside your building network. No data leaves your perimeter. No cloud subscription. No latency from internet round trips.
Works With Existing Drive Infrastructure
iFactory connects to any elevator controller that exposes BACnet, Modbus, or OPC-UA — no need to replace drives, controllers, or machine room hardware. The system optimizes what you already own.
Pilot-to-ROI in One Quarter
The 6–12 week pilot includes a full baseline measurement, optimization deployment, and verified savings report. You see ROI before you commit to a full portfolio rollout.
24×7 Managed Service — No Staff Overhead
iFactory's operations team monitors your elevator energy performance around the clock. If regenerative efficiency drops below threshold, we dispatch an automated adjustment — no call to your facility team required.
Portfolio Scalability — One Dashboard, All Buildings
Deploy iFactory in one building, then scale to 50+ buildings from a single dashboard. The platform aggregates per-building data into a unified energy recovery view, enabling portfolio-wide optimization and reporting.
Frequently Asked Questions About Elevator Energy Optimization with iFactory
Stop Dumping $47,000 Per Building Into Wasted Elevator Energy
iFactory recovers 22–34% of vertical transport energy without replacing a single drive — on-premise, turnkey, and pilot-ready in 6–12 weeks. Book a 30-minute walkthrough and we'll show you exactly how much your portfolio is leaving on the machine room floor.