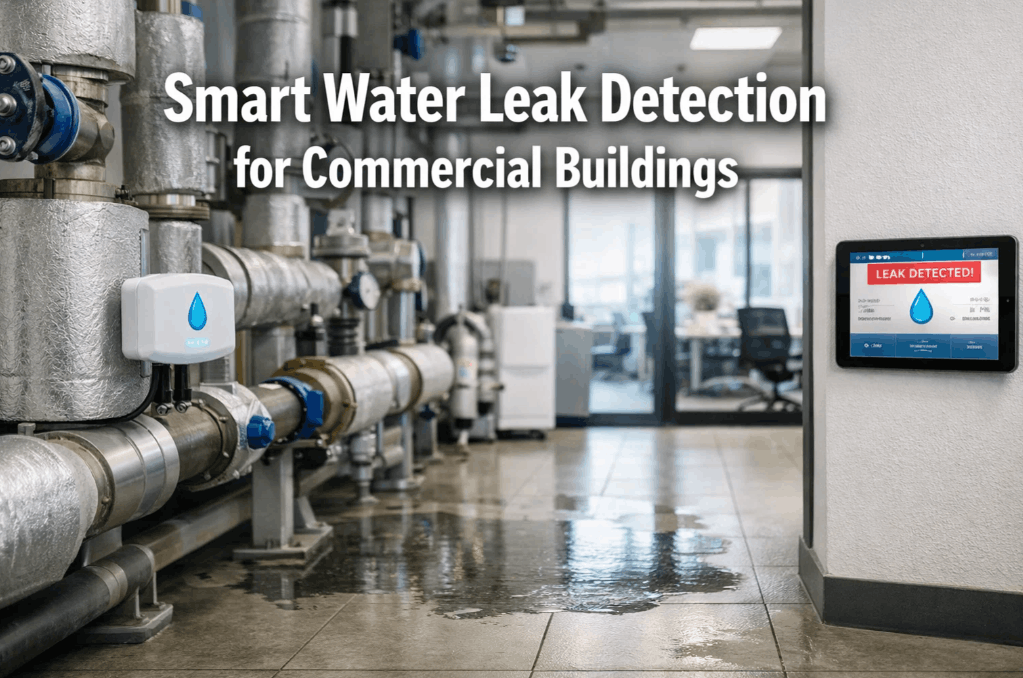
Commercial buildings waste an average of 30% of the water they consume — most of it through leaks, inefficient fixtures, and operational practices that never get measured because nobody is watching the meter between billing cycles. The Environmental Protection Agency estimates that water-efficient buildings can reduce consumption by 20-40% with payback periods under two years. iFactory Water Intelligence combines sub-metering integration, AI-driven consumption analytics, and automated leak detection into one platform — giving facility managers real-time visibility into every gallon flowing through their buildings. Book a demo to see how structured water analytics turns consumption data into conservation action and operational savings.
Monitor Every Drop Across Every Building in Your Portfolio
Stop discovering water waste through utility bill surprises. Combine sub-metering integration, AI consumption analytics, and automated leak alerts into one platform built for commercial facility teams.
Commercial Buildings Are Drowning in Water Waste That AI Can Detect
Water is the most undervalued utility expense in commercial real estate. Unlike electricity, where every kilowatt is metered and monitored, water consumption is typically measured once a month at the master meter. Between billing cycles, leaks run, fixtures waste, and operating practices go unchecked. AI-powered analytics changes this entirely — turning continuous consumption data into actionable insights that identify waste patterns no periodic walk-through can catch.
Where Water Actually Goes in a Commercial Building
Understanding consumption patterns requires knowing where water is used. The distribution varies by building type, but commercial office, retail, and mixed-use properties follow broadly predictable patterns. AI analytics applied at the sub-meter level reveals whether your building aligns with these benchmarks — and where the waste is hiding.
Building a Water Sub-metering Program: Four Steps to Granular Visibility
Sub-metering is the foundation of water analytics. Without measurement at the end-use level, consumption patterns remain invisible and waste goes undetected. The four-step approach below mirrors best practices from the International Water Association and leading commercial property managers.
Audit & Zone Mapping
Map all water supply branches, identify major end-use categories (restrooms, cooling tower, irrigation, kitchen), and determine optimal sub-meter locations. A complete zone map is the prerequisite for meaningful analytics.
Meter Selection & Installation
Specify meters with pulse output or digital communication capability — analog meters without data output cannot support real-time analytics. Ultrasonic and electromagnetic meters offer the highest accuracy for building applications.
Data Integration & Baseline
Connect sub-meters to the analytics platform. Establish 30-60 day consumption baselines for each zone at 15-minute intervals. Baseline data trains AI models to recognize normal consumption patterns by time of day and day of week.
Threshold & Alert Configuration
Set consumption thresholds and deviation parameters for each zone. Configure automated alerts for continuous flow flags, overnight consumption anomalies, and consumption spikes that exceed learned patterns by defined margins.
Turn Water Consumption Data Into Conservation Action Across Your Portfolio
Our team maps your water infrastructure, configures sub-metering integration, and builds AI consumption analytics in iFactory — so your facility teams know exactly where water is going, where it's being wasted, and what to do about it.
What AI Water Analytics Detects That Manual Monitoring Misses
AI-powered consumption analysis identifies patterns invisible to human operators. By learning normal consumption profiles for each zone at every hour of the day, AI models detect anomalies the moment they deviate from expected patterns — not when the next utility bill arrives.
Continuous Flow Detection
Water flowing continuously at low volume for hours — the signature of a running toilet, stuck fill valve, or dripping fixture. AI flags any zone where consumption does not return to zero during expected idle periods.
Overnight Consumption
Usage during unoccupied hours — the most reliable indicator of leaks, malfunctioning equipment, or unauthorized use. AI compares overnight consumption against learned baselines calibrated to each day of the week.
Consumption Spike Analysis
Sudden increases above learned consumption patterns. AI distinguishes between expected spikes (scheduled irrigation, cooling tower cycles) and anomalous spikes that indicate burst pipes, stuck valves, or equipment failure.
Cooling Tower Drift & Bleed
Inefficient cooling tower operation wastes significant water through excessive bleed and drift. AI correlates water consumption with cooling load and weather data to flag towers operating outside optimal efficiency ranges.
Irrigation Waste
Over-watering, broken sprinkler heads, and irrigation running during rain events. AI correlates irrigation zone consumption with weather data, soil moisture estimates, and ET rates to identify inefficient watering patterns.
Tenant Billing Discrepancies
Discrepancies between master meter reads and submetered tenant consumption. AI reconciles total consumption against submetered values and flags unexplained differences that indicate unmetered usage or meter drift.
Water Analytics ROI: What the Numbers Look Like for Commercial Properties
Water analytics programs deliver measurable financial returns through three channels: direct savings from reduced consumption, avoided costs from leak damage, and operational efficiencies from automated monitoring. The framework below shows typical ROI ranges across different building profiles.
Consumption Reduction
Direct water savings from leak repair, fixture retrofit, and operational optimization identified through analytics. Average payback of 8-18 months.
Leak Damage Avoided
Average cost avoided per major leak detected early by continuous flow monitoring and overnight consumption alerts. Detection within hours vs. days.
Tenant Billing Recovery
Revenue recovered through accurate sub-metered billing previously lost to estimated consumption or master-meter allocation methods.
Utility Rebate Revenue
One-time utility rebates for sub-metering installation and water efficiency upgrades. Many jurisdictions offer 20-50% rebate on qualifying water conservation investments.
Water Analytics Program Build: A Phased Approach
Implementing water analytics across a portfolio follows a logical progression. Each phase delivers measurable value independently while building the foundation for the next. The full program typically completes in three to six months depending on portfolio size.
Master Meter Analytics
Connect existing master water meters to the analytics platform. Establish building-level consumption baselines and configure automated leak detection at hourly resolution. Zero capital expenditure required.
Sub-meter Deployment
Install sub-meters on major end-use branches. Configure zone-level analytics, overnight monitoring, and tenant consumption tracking. Phase by highest-waste zones first.
AI Model Training
Train consumption models on zone-level baselines. Configure automated anomaly detection, weather-corrected irrigation analytics, and cooling tower efficiency models.
Reporting & Optimization
Configure portfolio dashboards, tenant billing integration, and sustainability reporting. Ongoing optimization cycle of detect, repair, verify, and repeat.
Frequently Asked Questions
What is the difference between master metering and sub-metering for water?
Master metering measures total water consumption at the building entry point — it tells you how much water the entire building uses but provides no visibility into where it goes. Sub-metering places meters on individual branches or end-use zones — restrooms, cooling towers, irrigation, kitchens — enabling zone-level consumption tracking, leak localization, and tenant billing. Sub-metering is the prerequisite for meaningful water analytics.
How much water can AI analytics actually save in a commercial building?
EPA data and industry case studies consistently show 20-40% consumption reduction within 12-24 months of implementing a comprehensive water analytics program. The largest savings typically come from leak repair (30-50% of total savings), cooling tower optimization (20-30%), fixture retrofit prioritization (15-25%), and irrigation scheduling improvements (10-15%). Buildings starting from a low-efficiency baseline generally see the highest percentage savings.
What equipment is needed to support water consumption monitoring?
The minimum requirement is a master water meter with pulse output or digital communication capability. For sub-metering, each zone requires a compatible sub-meter with data output. Meters should be connected to a data acquisition gateway that transmits readings at 15-minute intervals or higher frequency. Ultrasonic clamp-on meters offer non-invasive installation for retrofit applications. The analytics platform receives the data stream and performs the consumption analysis, anomaly detection, and alerting.
Can water analytics integrate with existing building management systems?
Yes — modern water analytics platforms integrate with BACnet, Modbus, and API-based building management systems. Sub-meter data can flow through existing BAS controllers or through dedicated water analytics gateways. The analytics layer sits above the BMS, correlating water consumption data with HVAC operations, weather data, and occupancy schedules to produce insights no standalone BMS can generate.
How does iFactory help manage water consumption analytics across a portfolio?
Each building's water infrastructure is mapped with master meter and sub-meter locations, zone assignments, and consumption baselines. Sub-meter data streams are integrated at 15-minute resolution. AI models learn consumption patterns for each zone and trigger alerts on continuous flow, overnight usage, and consumption spikes. Facility managers see portfolio-wide consumption trends, anomaly summaries, and leak alerts in one dashboard — with automated work order generation triggered by confirmed anomalies.
Turn Water Waste Into Water Savings Across Every Building You Manage
Stop managing water through monthly utility bills and reactive leak repairs. Combine sub-metering integration, AI consumption analytics, and automated anomaly detection into one platform built for commercial facility portfolios.