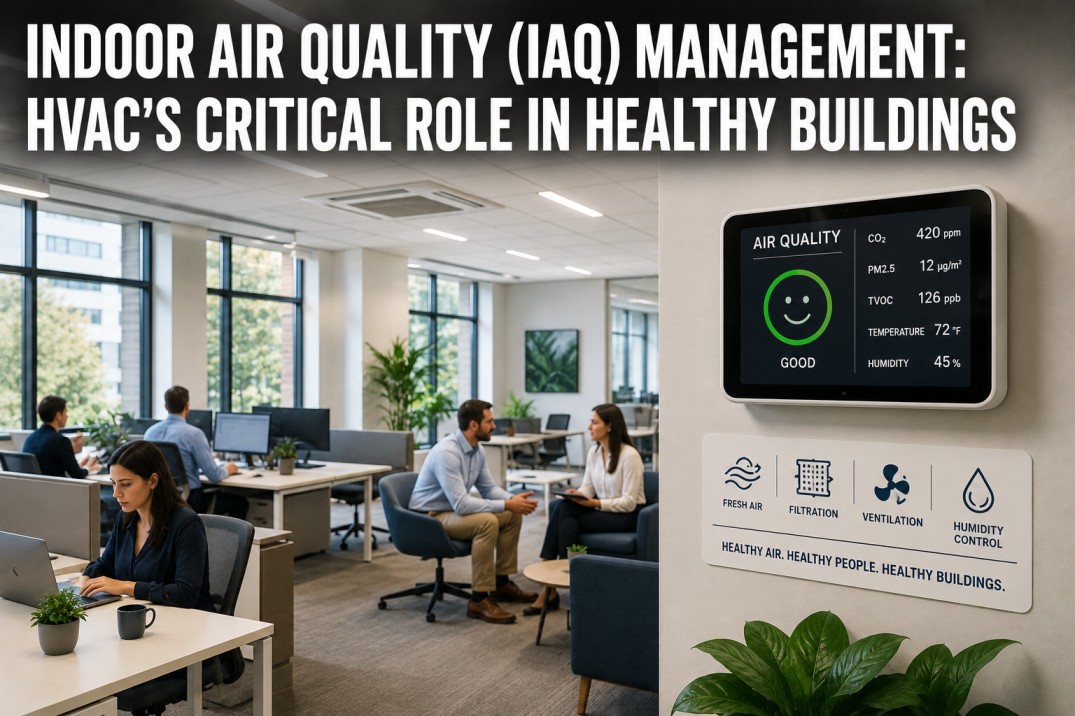
HVAC systems are the backbone of indoor air quality, controlling not just temperature but the ventilation, filtration, humidity, and air circulation that determine whether building occupants breathe clean, healthy air or recirculated contaminants. With post-pandemic awareness of airborne disease transmission, growing evidence linking IAQ to cognitive performance, and tightening ASHRAE standards for ventilation and filtration, IAQ management has become a core responsibility for facility managers. A comprehensive IAQ strategy integrates HVAC design, operation, and real-time monitoring to deliver measurable improvements in occupant health, comfort, and productivity while reducing energy consumption through demand-controlled ventilation and optimized filtration.
Monitor and Manage Indoor Air Quality With IoT Sensors
iFactory's IoT Integration module provides real-time IAQ monitoring with CO2, PM2.5, TVOC, humidity, and temperature sensors. Book a demo to see how continuous IAQ monitoring creates healthier buildings.
Core IAQ Parameters: What to Measure and Why
Effective IAQ management starts with understanding the key parameters that determine air quality and occupant experience.
Particulate Matter (PM2.5, PM10)
Fine particles from combustion, dust, pollen, and microbial sources. PM2.5 penetrates deep into lungs. Sources: outdoor pollution, indoor activities, HVAC system dust. Target: PM2.5 under 12 ug/m3 annual, PM10 under 35 ug/m3. Measured with optical particle counters.
CO2 Concentration
Indicator of ventilation effectiveness and occupancy. Elevated CO2 above 1,000 ppm correlates with reduced cognitive function. Target: under 800 ppm for optimal performance, under 1,000 ppm minimum. Measured with NDIR sensors. Primary driver of demand-controlled ventilation.
Total Volatile Organic Compounds (TVOC)
Chemical pollutants from building materials, cleaning products, furniture, and occupant activities. Target: under 500 ug/m3. Sources: paints, adhesives, carpets, printers, cleaning supplies. Measured with photoionization detectors or metal oxide sensors.
Relative Humidity
Affects comfort, microbial growth, and virus transmission. Target: 40-60% RH. Below 30%: increased respiratory illness, static electricity. Above 60%: mold and dust mite growth. Measured with capacitive humidity sensors. Controlled by humidification and dehumidification systems.
Ventilation Strategies: Delivering Fresh Air Effectively
Proper ventilation is the most important HVAC factor for IAQ. ASHRAE 62.1 defines minimum ventilation rates.
| Strategy | How It Works | IAQ Impact | Energy Impact | Best For |
|---|---|---|---|---|
| Fixed Minimum Outdoor Air | Damper set to minimum position based on design occupancy | Baseline: meets code minimum | Constant: 10-25% of total airflow | Simple systems, constant occupancy |
| Demand-Controlled Ventilation (DCV) | CO2 sensors modulate OA damper based on actual occupancy | Optimal: fresh air when needed | 15-40% energy savings vs fixed | Variable occupancy: offices, retail, schools |
| Economizer (Free Cooling) | Uses OA for cooling when conditions are favorable | Excellent: high OA rates during economizing | 20-60% cooling energy savings | Mild climates, buildings with cooling loads |
| Energy Recovery Ventilator (ERV) | Transfers heat and moisture between exhaust and OA | Enables higher OA rates without energy penalty | 60-80% energy recovery efficiency | Extreme climates, high OA requirements |
Optimize Ventilation and Filtration Based on Actual Conditions
iFactory's platform integrates IAQ sensor data with HVAC controls enabling demand-controlled ventilation and filter condition monitoring. Book a demo to see how data-driven IAQ management balances air quality and energy efficiency.
Filtration Standards: MERV, HEPA & Beyond
Filtration is the primary defense against particulate contaminants. Selecting the right filter involves balancing efficiency, pressure drop, and cost.
Minimum Standard: MERV 8
ASHRAE 62.1 minimum for commercial buildings with mechanical cooling. Captures 70-85% of 3-10 micron particles. Pressure drop: 0.2-0.4 in. w.g. when clean. Replacement: 1-3 months. Cost: $3-8 per filter. Adequate for equipment protection but insufficient for optimal IAQ.
Recommended: MERV 11-13
ASHRAE 62.1 recommended minimum for improved IAQ. Captures 85-95% of 1-3 micron particles including mold spores and some bacteria. Pressure drop: 0.4-0.8 in. w.g. Replacement: 3-6 months. Cost: $8-20 per filter. Best balance of IAQ improvement and energy cost for most commercial buildings.
Enhanced: MERV 14-16 + Bipolar Ionization
For healthcare, clean rooms, and highest IAQ requirements. Captures 95-99% of particles including fine PM2.5. Often combined with UV-C for microbial control or bipolar ionization for air cleaning. Pressure drop: 0.6-1.2 in. w.g. Verify system fan capacity can handle additional static pressure.
IAQ Monitoring Systems: Sensors, Dashboards & Alerts
Continuous IAQ monitoring transforms air quality from guesswork into data-driven management.
Sensors per Zone
Monitor: CO2, PM2.5, TVOC, temperature, humidity, and pressure. Wall-mounted in occupied spaces and return air ducts. Calibration: annually for CO2, every 2-3 years for PM and TVOC sensors.
Data Collection Frequency
Display on dashboard: current values, trends, and time above threshold. Alert thresholds: CO2 >1,000 ppm, PM2.5 >15 ug/m3, TVOC >500 ug/m3, RH <30% or >65%. Immediate alerts for critical exceedances.
Reporting Requirements
LEED EQ credits: minimum MERV 13 and CO2 monitoring. WELL: 5 IAQ parameters minimum, real-time display. RESET: continuous monitoring required, third-party data validation. All require documentation of monitoring and corrective actions.
IAQ-Energy Optimization
CO2-based DCV saves 15-40% on conditioning OA while maintaining IAQ. Filter pressure monitoring enables condition-based replacement. Integrated IAQ and energy dashboard enables trade-off analysis.
Building an IAQ Improvement Plan: Step-by-Step Implementation
A systematic approach to IAQ improvement prioritizes actions by impact, cost, and implementation complexity.
Assessment Phase (Weeks 1-4)
Conduct baseline IAQ assessment: measure CO2, PM2.5, TVOC, temperature, and humidity across representative zones. Review existing ventilation rates and filtration levels. Identify critical areas with highest occupancy or most vulnerable occupants. Benchmark against ASHRAE 62.1, WELL, and LEED standards.
Immediate Actions (Weeks 4-8)
Upgrade filters to minimum MERV 11, MERV 13 recommended. Verify minimum outdoor air meets ASHRAE 62.1 rates. Fix any ventilation system deficiencies. Install CO2 sensors in high-occupancy zones. Establish IAQ monitoring program with continuous data collection and dashboard.
Ongoing Optimization (Months 2-12)
Implement DCV to optimize ventilation based on actual occupancy. Add PM2.5 and TVOC monitoring for comprehensive IAQ tracking. Develop corrective action procedures for IAQ exceedances. Train facility staff on IAQ management. Document improvements for WELL or LEED certification.
Frequently Asked Questions
What are the key parameters of indoor air quality?
Five core parameters define IAQ: CO2 concentration (indicator of ventilation adequacy, target under 800 ppm), particulate matter PM2.5 and PM10 (target PM2.5 under 12 ug/m3 annual), total volatile organic compounds TVOC (target under 500 ug/m3), relative humidity (target 40-60%), and temperature (target 72-78F cooling, 68-74F heating). Additional parameters for specific situations: carbon monoxide, radon, ozone, formaldehyde, and biological contaminants.
What ventilation rate does ASHRAE 62.1 require?
ASHRAE 62.1-2022 requires minimum ventilation rates based on occupancy and floor area. Typical rates: office spaces 17 cfm/person + 0.06 cfm/sq ft, classrooms 10 cfm/person + 0.06 cfm/sq ft, retail 7.5 cfm/person + 0.06 cfm/sq ft, healthcare 20-30 cfm/person depending on area. Total ventilation = people-based rate + area-based rate. Rates can be modulated by DCV when CO2 sensors indicate lower actual occupancy.
What MERV rating is recommended for good IAQ?
ASHRAE recommends minimum MERV 8 for equipment protection and MERV 11-13 for improved IAQ. For optimal IAQ: MERV 13 in commercial offices, schools, and healthcare, MERV 14-16 in hospitals, clean rooms, and spaces with vulnerable occupants. WELL certification requires minimum MERV 13. LEED EQ credits reward MERV 13 or better. Higher MERV ratings increase pressure drop verify system fan capacity before upgrading.
How does humidity affect indoor air quality?
Relative humidity affects comfort, health, and building integrity. Below 30% RH: increased respiratory infection transmission, dry eyes and throat, static electricity. Above 60% RH: mold and dust mite growth, increased VOC emissions from materials. Optimal: 40-60% RH for comfort, health, and building protection. HVAC systems must include humidification in dry climates and dehumidification in humid climates to maintain this range.
How do I start monitoring indoor air quality?
Start with CO2 monitoring in high-occupancy zones (conference rooms, classrooms, open offices). CO2 is the most informative single IAQ parameter because it directly indicates ventilation effectiveness relative to occupancy. Add PM2.5 monitoring to assess filtration effectiveness. Add TVOC to detect chemical pollutants. Use wall-mounted sensors connected to a central dashboard. Monitor for 2-4 weeks to establish baseline, then implement corrective actions for any exceedances.
Complete IAQ Management With iFactory
iFactory's IoT Integration delivers end-to-end IAQ management from sensor deployment and real-time monitoring through ventilation optimization, filter tracking, and compliance documentation. Book a demo to see how IoT-driven IAQ management creates healthier, more productive buildings.