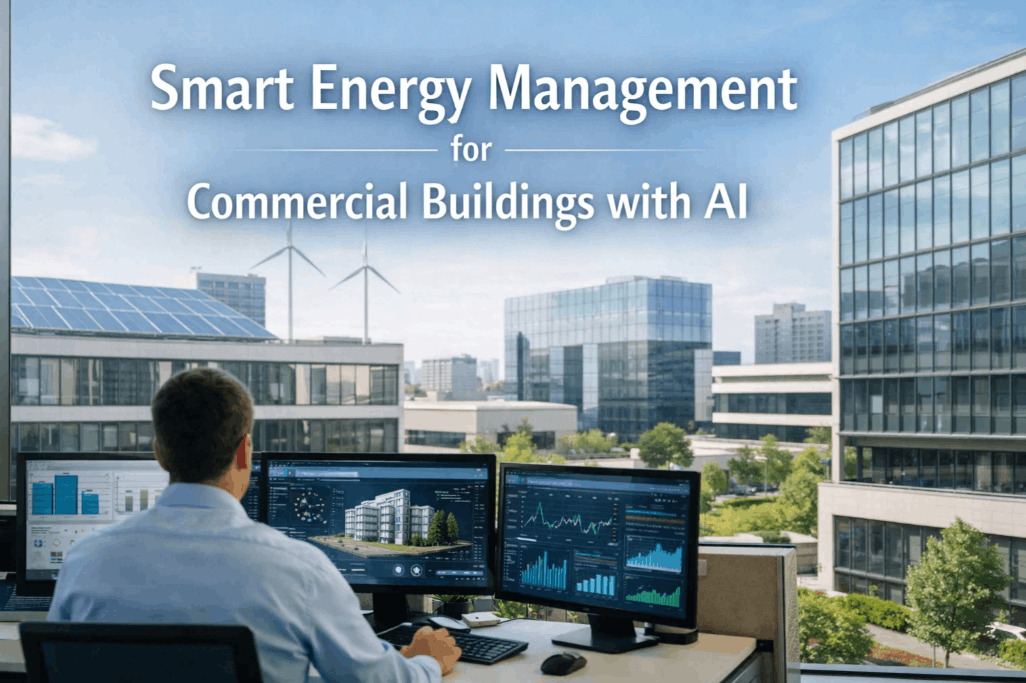
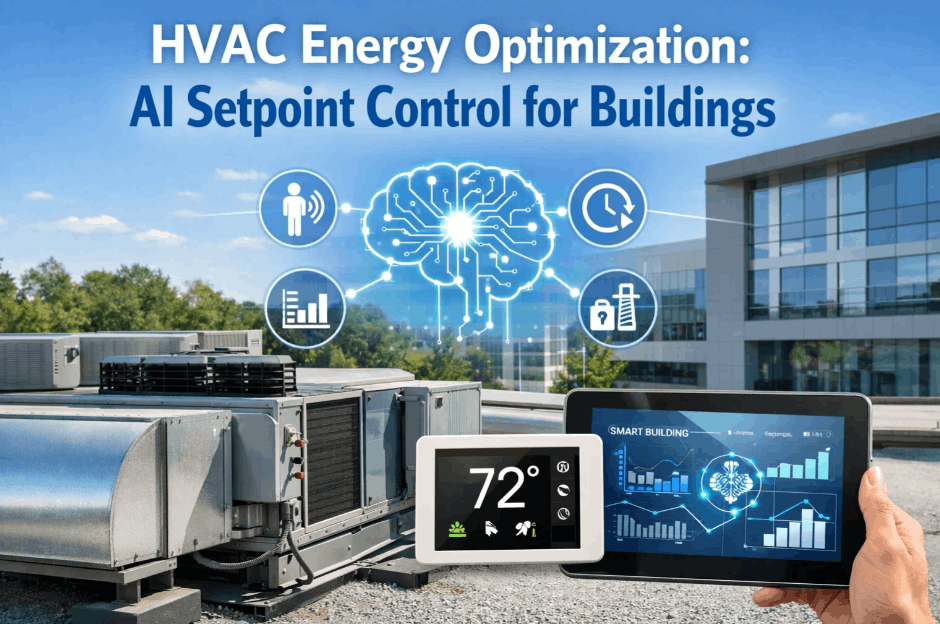
A 38-floor Class A office tower cut HVAC energy consumption by 28% in nine months — without replacing a single chiller, AHU, or VAV box. The secret wasn't new hardware. It was finally connecting the building's IoT sensors and BMS to an AI-driven optimization layer that caught what the engineering team couldn't see. iFactory Energy Intelligence made the savings measurable, repeatable, and ownership-ready. Book a demo to walk through this exact case study and see how it maps to your building portfolio.
28% HVAC Energy Saved in 9 Months
A real-world look at how AI setpoint optimization, fault detection, and BMS-CMMS integration combined to recover energy savings the building had been bleeding for years — without touching a single piece of equipment.
The Building Behind the Numbers
A representative deployment showing what's possible when modern AI energy optimization meets an existing commercial office building — not a new construction, not a retrofit budget, just smarter use of the systems already in place.
The Numbers That Changed in Nine Months
A side-by-side look at the building's HVAC performance before iFactory deployment and after the AI optimization layer was fully tuned. Every metric is sourced from BMS data and utility meter reads — not estimates.
Pre-Optimization Baseline
Months -12 to 0
Post-Optimization Steady State
Months +6 to +9
What Was Quietly Wasting $400K Every Year
Before the optimization layer went in, the engineering team knew energy spend was too high — but couldn't pinpoint where it was going. Three hidden issues accounted for the bulk of the waste. None were visible without correlating BMS data with energy consumption.
Cooling Setpoint Drift on 16 Floors
Tenant facility coordinators had quietly adjusted setpoints 2–4°C below building baseline over the years. No one was comparing BMS setpoints against energy data, so the overcooling went undetected.
Chiller Sequencing Out of Spec
Two chillers running at partial load when one chiller at higher load would have been more efficient. The BMS logic hadn't been tuned since commissioning.
Pre-Conditioning Started Too Early
HVAC ramped up at 4:30am to hit occupied setpoint by 7:00am — but real occupancy data showed most floors didn't reach 30% occupancy until 8:30am.
See What's Quietly Bleeding Energy in Your Portfolio
In a 30-minute walkthrough, our team reviews your BMS architecture and recent utility data — and shows you where AI optimization typically finds the largest savings in office buildings of your size.
How the 14-Week Implementation Unfolded
The deployment ran in three distinct phases. Each had its own measurable outcome before moving to the next — a sequence designed to build engineering team confidence and ownership buy-in alongside the technical work.
BMS Integration & Data Foundation
iFactory connector module deployed to the existing Siemens Desigo CC BMS. Bidirectional data link established. 40,000+ data points per day flowing into the unified platform for baseline establishment.
Setpoint Audit & Correction Program
All 38 floors audited for setpoint drift. 16 floors found out-of-spec. Coordinated tenant communication, setpoint reset, and validation against energy consumption trends.
AI Optimization & Continuous Tuning
Machine learning models began optimizing supply air temperature and chiller sequencing every 15 minutes based on occupancy, weather, and historical load patterns. Predictive pre-conditioning replaced fixed schedules.
The ROI Math That Sold the Project to Ownership
The investment paid for itself in 7.2 months from project completion — driven primarily by energy savings, but with measurable additional value in tenant comfort, equipment longevity, and ESG reporting positioning.
Direct utility cost reduction from year one onwards. Compounds with annual utility rate increases.
From project completion to full investment recovery. Below the 12-month threshold most CFOs require for ops-tech approval.
Software, implementation, and configuration. No equipment purchases or capital improvements required.
Improved building rating supports ESG reporting and lease premium positioning with tenants prioritizing sustainability.
Five Takeaways for Any Office Building Owner
The 28% savings weren't because of magic technology. They came from disciplined execution of five principles that any portfolio owner can apply to their own buildings — starting with the next budget cycle.
Don't Replace Hardware First
Most existing BMS infrastructure can deliver 20–30% energy savings with software-only optimization. Capital replacement should follow exhaustion of optimization, not precede it.
Setpoint Drift Is the #1 Hidden Cost
In multi-tenant buildings, setpoint creep over years almost always exists. A systematic audit is the highest-ROI first action and surfaces issues no one is actively looking for.
Connect BMS to CMMS Directly
When BMS faults auto-generate CMMS work orders, problems get fixed in hours instead of weeks. The integration is where most savings actually compound over time.
Measure Against Weather-Normalized Baselines
Raw consumption comparisons mislead. Mild winters look like savings; harsh summers look like failures. Weather normalization is the only credible way to prove AI value to ownership.
Communicate Savings to Tenants
Tenants notice the comfort improvement before they hear about energy. Proactive communication about sustainability gains converts the upgrade into a documented lease renewal asset.
Frequently Asked Questions
Does this kind of result require a brand-new BMS or modern equipment?
No. The case study building had a Siemens Desigo CC BMS installed in 2019 — capable but not state-of-the-art. iFactory integrates with most major BMS platforms via BACnet, Modbus, or API. Buildings with BMS systems as old as 10–12 years routinely achieve 20–30% savings without any equipment replacement.
What's the typical investment range for a building this size?
For commercial office buildings in the 200,000–800,000 sq ft range, a BMS-CMMS integration project typically runs $80K–$180K all-in — including software licensing, implementation, and configuration. Payback usually lands between 8 and 15 months, with savings compounding as the AI model accumulates more data.
How are tenant complaints handled during the optimization period?
In this case, tenant complaints actually dropped 60% during deployment — the opposite of the typical fear. Most buildings have been overcooled or unevenly conditioned for years, so optimization corrects existing comfort issues rather than creating new ones. Conservative implementation with thermal violation thresholds protects against any negative shift.
Can the AI deliver consistent savings across very different building types?
Class A office and mixed-use buildings typically see 20–35% HVAC savings. Schools and government buildings often exceed 30% due to predictable occupancy patterns. Industrial buildings vary widely (10–25%) depending on process load. The model learns each building's unique pattern, so results scale across portfolios with diverse asset classes.
How is energy savings actually verified — not just estimated?
Measurement and Verification (M&V) runs continuously against a weather-normalized baseline established before AI activation. Actual consumption is compared to baseline-predicted consumption each month, with utility meter data as the ground truth. Monthly reports show kWh saved, therms reduced, and dollars recovered — verified against bills, not estimates.
Apply This Playbook to Your Office Portfolio
Stop overspending on HVAC energy you don't need to consume. Combine BMS-CMMS integration, AI setpoint optimization, and continuous M&V into one operational layer that pays for itself before year one closes.