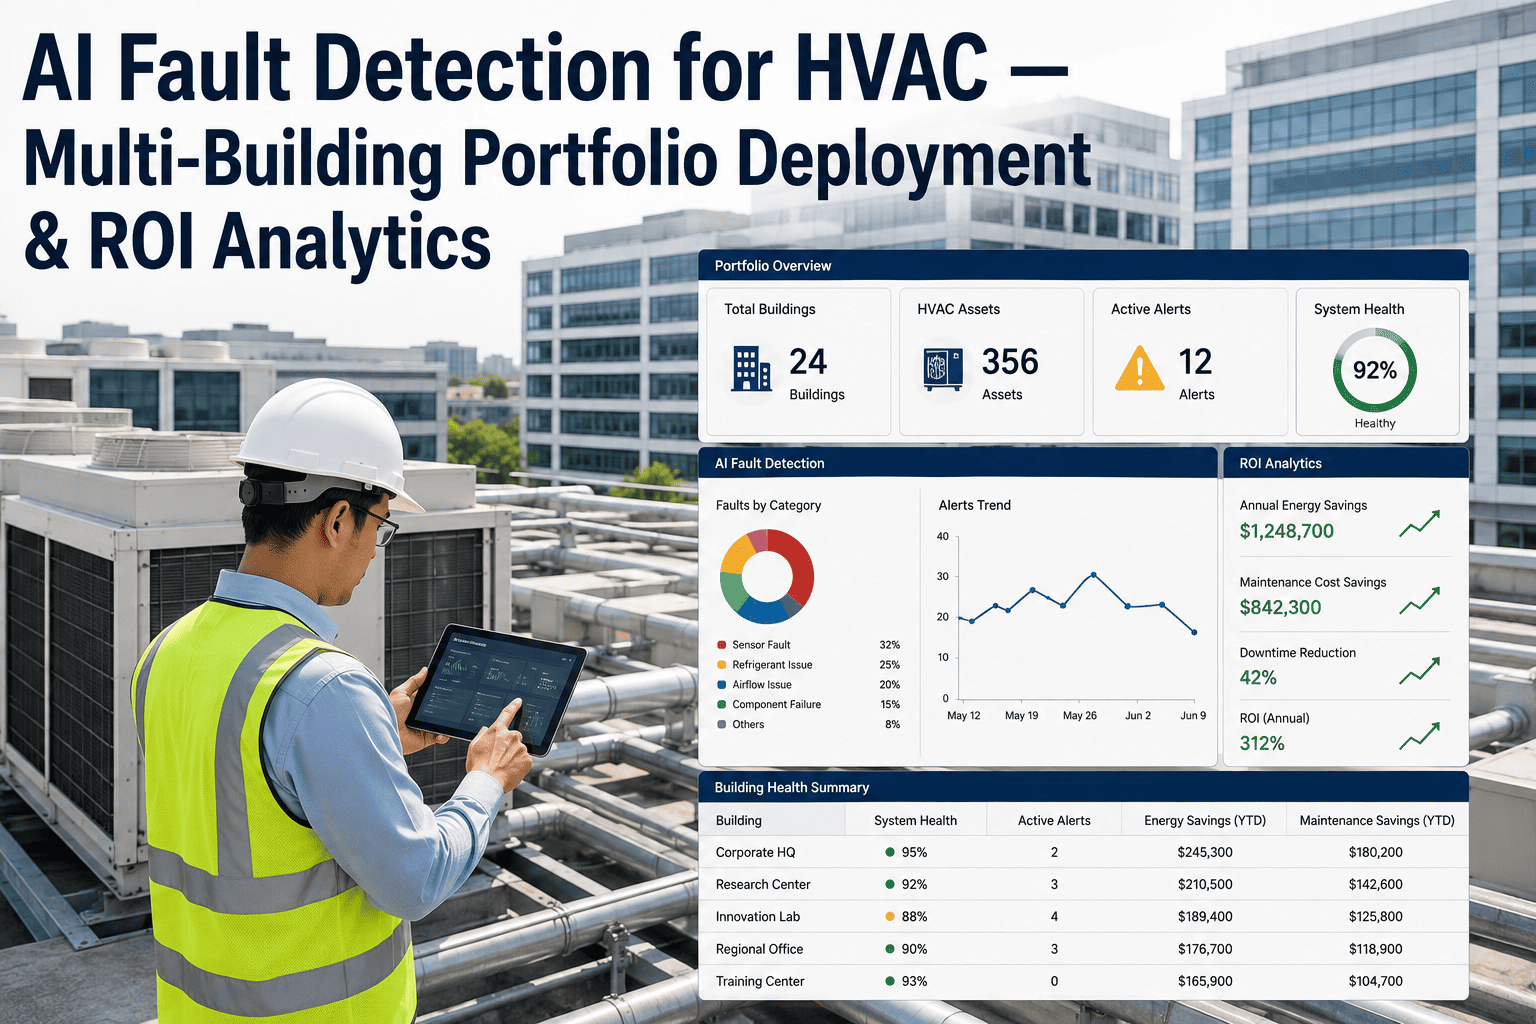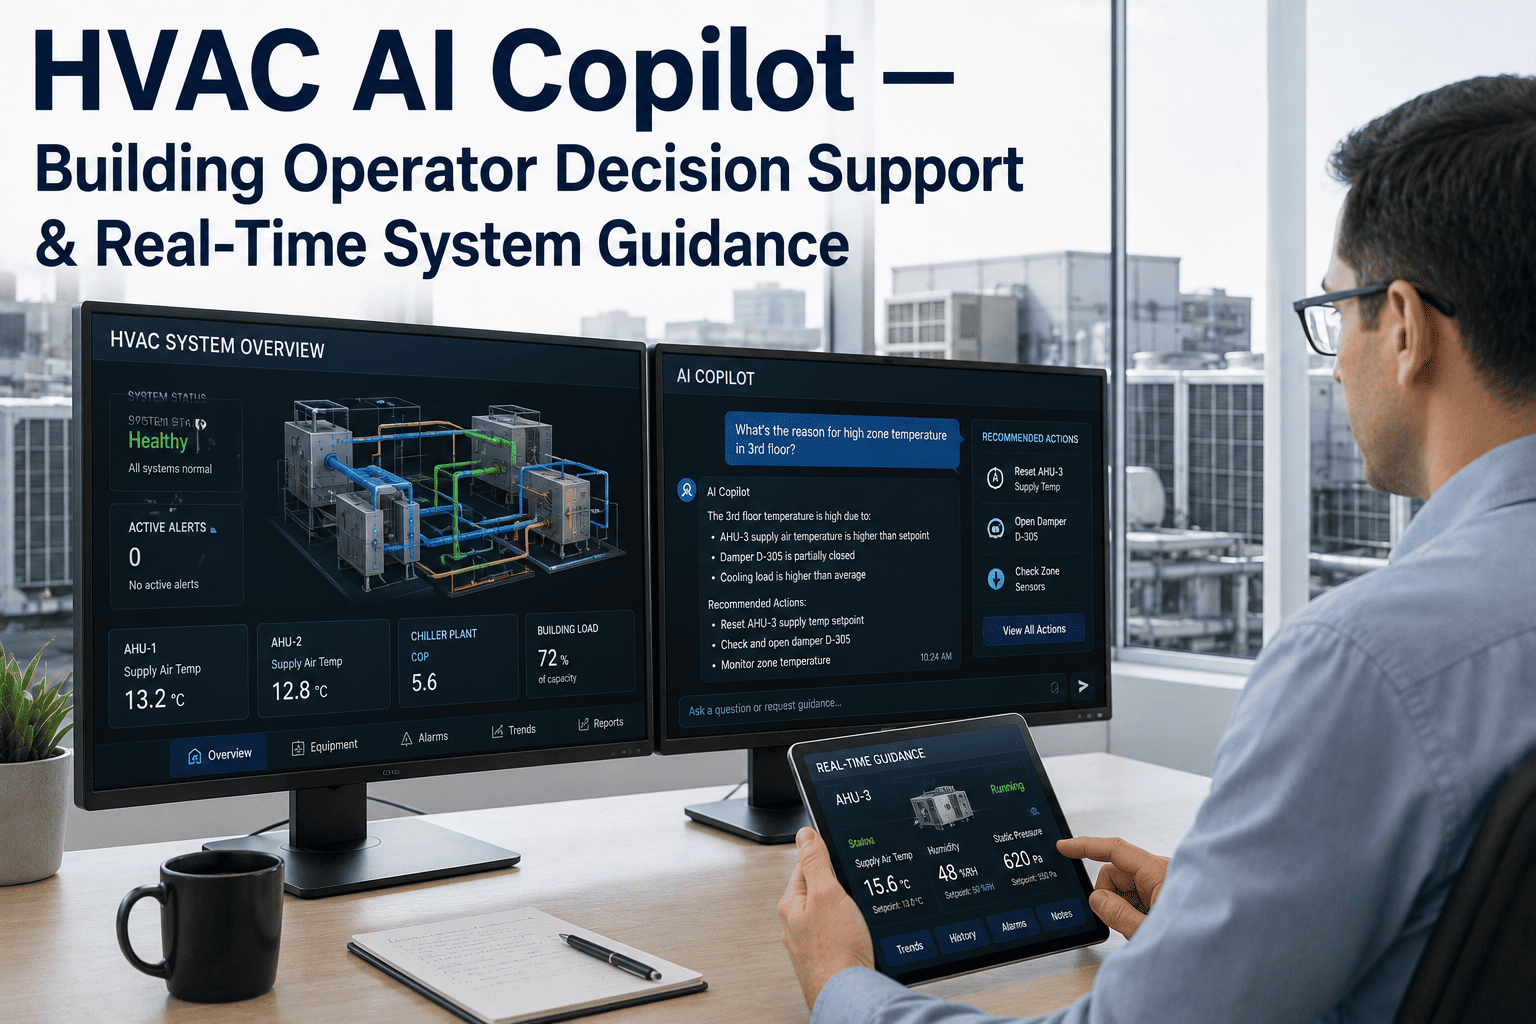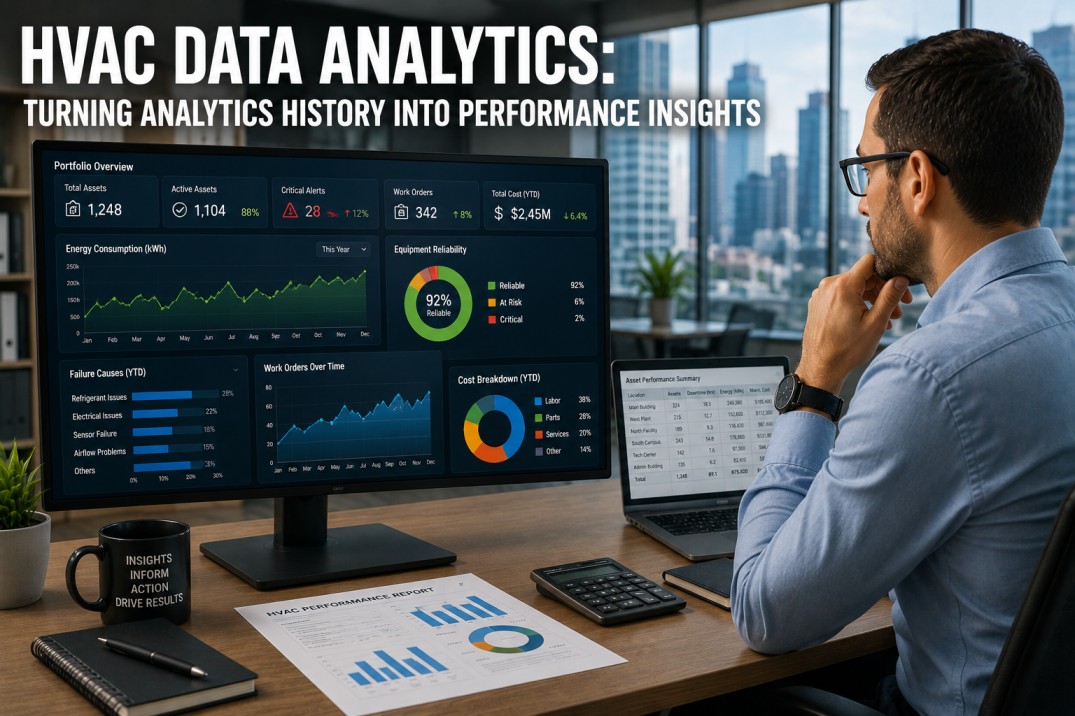
A VP of Operations overseeing twenty buildings does not have twenty screens open at once, yet that is effectively what site-by-site HVAC management demands today. Each building's BAS speaks its own dialect, stores its own history, and surfaces alarms only to whoever happens to be logged in locally. The result is a portfolio that looks connected on paper but behaves like twenty separate businesses when it comes to spotting the chiller plant that is quietly draining margin or the site that is one failed sensor away from a shutdown. IIoT connectivity paired with cloud and edge AI analytics closes that gap, turning scattered building data into one operating picture. See it applied to your own portfolio — Book a Demo with iFactory.
One Operating Picture Across Every Building
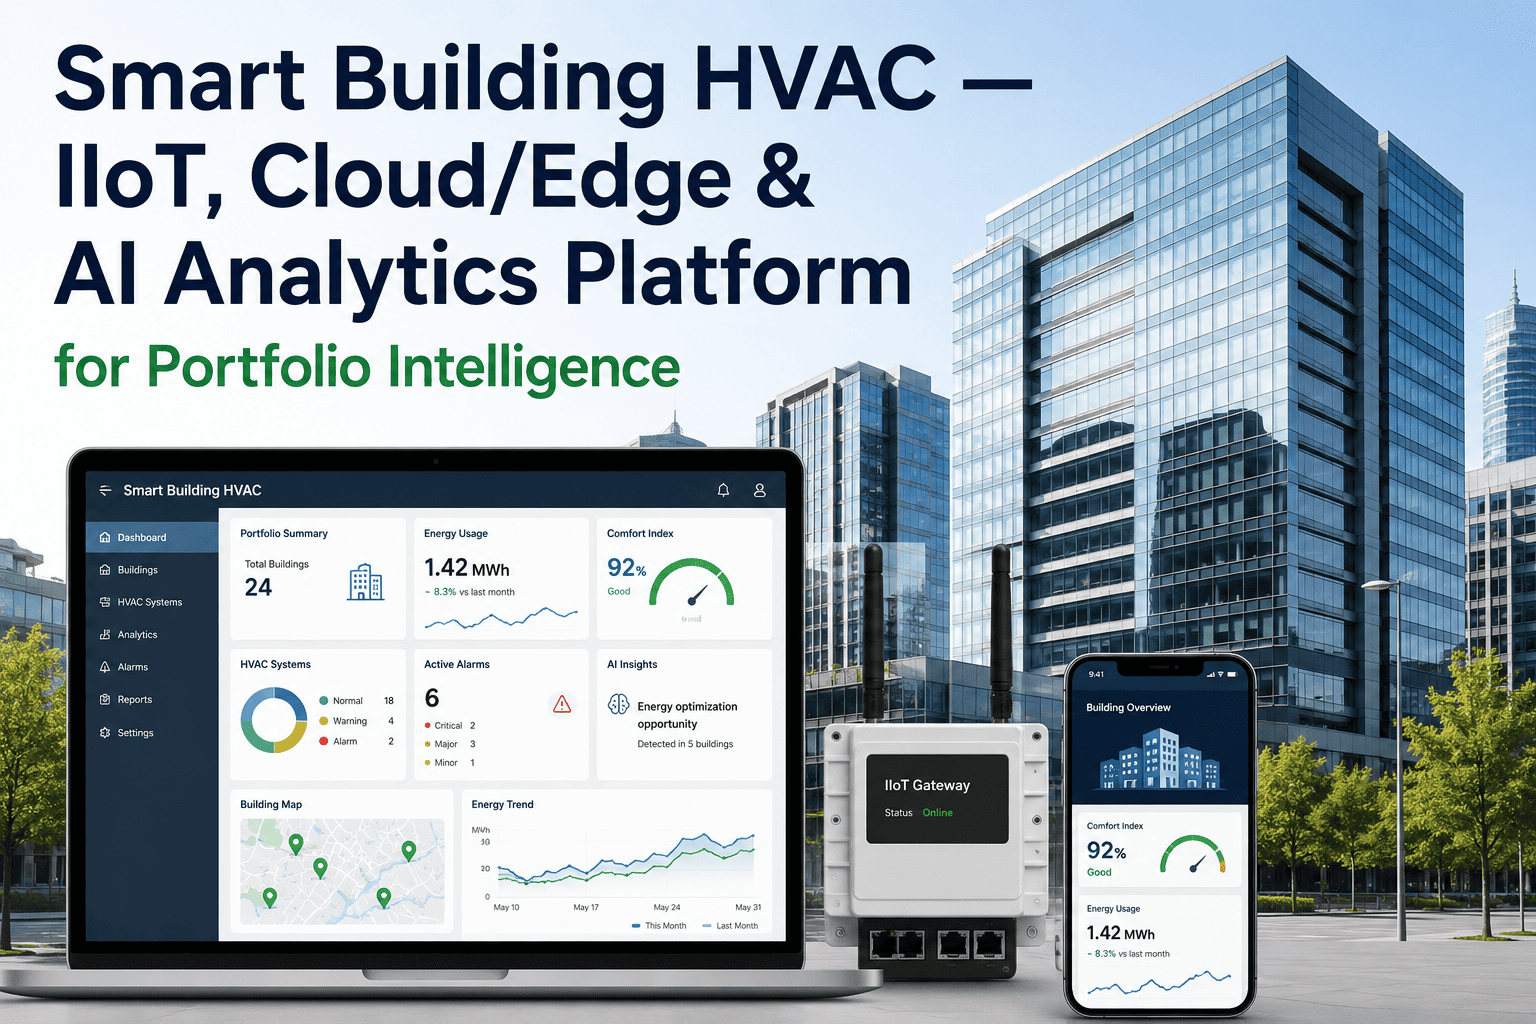
iFactory unifies IIoT sensor data, edge processing, and cloud analytics into a single portfolio intelligence layer, so VPs of Operations can compare, prioritize, and act across every site from one dashboard.
The Portfolio Blind Spot Nobody Budgets For
Individually, most buildings in a portfolio are reasonably well instrumented. Collectively, that instrumentation is nearly useless for portfolio-level decisions, because there is no shared layer translating site-specific BAS data into comparable, portfolio-wide intelligence. Three consequences follow directly from this blind spot.
Site-Level Reality
Each building's BAS tracks its own points, alarms locally, and stores history in a proprietary format only that vendor's tools can read.
Portfolio-Level Consequence
A VP of Operations cannot rank sites by energy intensity, fault frequency, or maintenance cost without a manual, quarterly data-pull exercise across every site.
Site-Level Reality
Alarms surface only on the local operator workstation, often at buildings without staff present to see or act on them in real time.
Portfolio-Level Consequence
Critical faults go unacknowledged for hours or days, turning a minor sensor drift into a full equipment failure by the time anyone notices.
Site-Level Reality
Capital planning decisions get made building by building, based on whichever site manager is loudest about their equipment's condition.
Portfolio-Level Consequence
Capital gets misallocated to the squeaky wheel instead of the site with the highest actual risk or return, because there is no shared scoring system.
Three Layers of a Smart Building Stack
Edge Layer: Local Sensing and Real-Time Response
IIoT sensors and edge controllers handle time-critical decisions locally — safety interlocks, fault detection, and immediate equipment protection — without waiting on a round trip to the cloud.
Cloud Layer: Cross-Site Analytics and AI Modeling
Historical and real-time data from every site flows into a shared cloud analytics layer, where AI models trained across the whole portfolio spot patterns invisible from any single building's data alone.
Portfolio Layer: Decision Support for Leadership
Site rankings, energy benchmarking, and fault prioritization surface in a single executive dashboard, giving operations leadership a way to direct attention and capital where it has the greatest impact.
IIoT Architecture Maturity Across a Portfolio
Portfolios rarely move from disconnected to fully unified overnight. This maturity model reflects the stages most operations teams pass through, and where the largest jump in visibility happens. Schedule a Portfolio Assessment to find your current stage.
| Stage | Data Access | Cross-Site Visibility | Response Model |
|---|---|---|---|
| Stage 1: Isolated Sites | Local BAS Only | None | Reactive, Site-Led |
| Stage 2: Manual Rollups | Quarterly Data Exports | Delayed, Partial | Reactive, Delayed |
| Stage 3: Connected Cloud | Continuous Cloud Sync | Near Real-Time | Proactive Alerts |
| Stage 4: Unified Intelligence | Edge + Cloud + AI | Real-Time, Ranked | Predictive, Prioritized |
Before iFactory, I found out about equipment problems from a tenant complaint email, sometimes days after the fault started. Now I open one dashboard every morning and know exactly which of our 24 sites needs attention first. It has changed how our whole operations team spends its time.
How Data Moves From Sensor to Boardroom
The value of a smart building stack comes from what happens between the sensor reading and the decision it informs. Here is that path in four stages.
Bring Every Site Into One View
Stop piecing together spreadsheets from twenty different BAS logins. See what portfolio-wide HVAC intelligence looks like on your own buildings.
What Changes for a VP of Operations
The shift from site-by-site reporting to unified portfolio intelligence changes more than dashboards — it changes how leadership spends its time and where capital gets directed. Instead of monthly reports assembled from mismatched spreadsheets, a VP of Operations opens a live view showing which sites are trending toward equipment failure, which are outperforming their energy benchmark, and which need a site visit this week rather than this quarter. Capital requests stop being a negotiation based on who advocates loudest and start being ranked by measured risk and return, which makes budget conversations with finance faster and less contentious. And because the same data layer feeds both the executive dashboard and the site-level maintenance team, everyone is working from the same numbers instead of reconciling conflicting reports after the fact.
Rollout Across Your Portfolio: What the First Quarter Looks Like
Month 1: Pilot Site Connection
Two to three representative sites are connected first, validating data quality and protocol coverage before wider rollout.
Month 2: Portfolio Expansion
Remaining sites are connected in batches, with normalization templates reused from the pilot to speed onboarding.
Month 3: Dashboard Adoption
Leadership and site teams move to the unified dashboard as their primary daily view, retiring manual rollup reports.
Ongoing: Model Refinement
AI models continue learning from portfolio-wide data, sharpening fault predictions and benchmark accuracy over time.
Frequently Asked Questions
Can iFactory connect to buildings running different BAS vendors and protocols?
Yes. Most portfolios accumulate a mix of BAS vendors and protocols over years of separate construction and renovation projects. iFactory's normalization layer connects to common building protocols and maps each site's points into a shared data model, so a chilled water valve position means the same thing whether it comes from a five-year-old system or a legacy one from a decade ago.
What happens at the edge versus in the cloud, and why does that split matter?
Time-critical decisions, like protecting equipment from an unsafe operating condition, happen at the edge so they are not delayed by network latency or an outage. Cross-site pattern recognition, benchmarking, and longer-term forecasting happen in the cloud, where the AI model can draw on data from the entire portfolio rather than just one building's history.
How long does it take to bring a full portfolio onto one dashboard?
Most portfolios reach full connectivity within a single quarter, starting with a small pilot group of sites to validate data quality before expanding. The exact timeline depends on portfolio size and the diversity of existing BAS systems, and our team scopes this specifically during onboarding rather than applying a generic estimate.
Does unifying our data create new cybersecurity exposure across sites?
Connecting sites is done through segmented, monitored pathways rather than opening direct access between building networks. Each site retains its own local control boundary, and the platform is built with the same network protection principles used in industrial IIoT deployments, so unifying visibility does not mean flattening your security architecture.
Who at our organization typically owns this platform day to day?
Ownership usually sits with the VP of Operations or a portfolio-level facilities director, with site engineers retaining their local tools for hands-on work. For technical questions during rollout or after go-live, our Support team works directly with both the portfolio owner and site-level staff.
Turn Twenty Buildings Into One Operating View
iFactory connects your portfolio's IIoT and BAS data into a single AI-powered intelligence layer built for operations leadership.