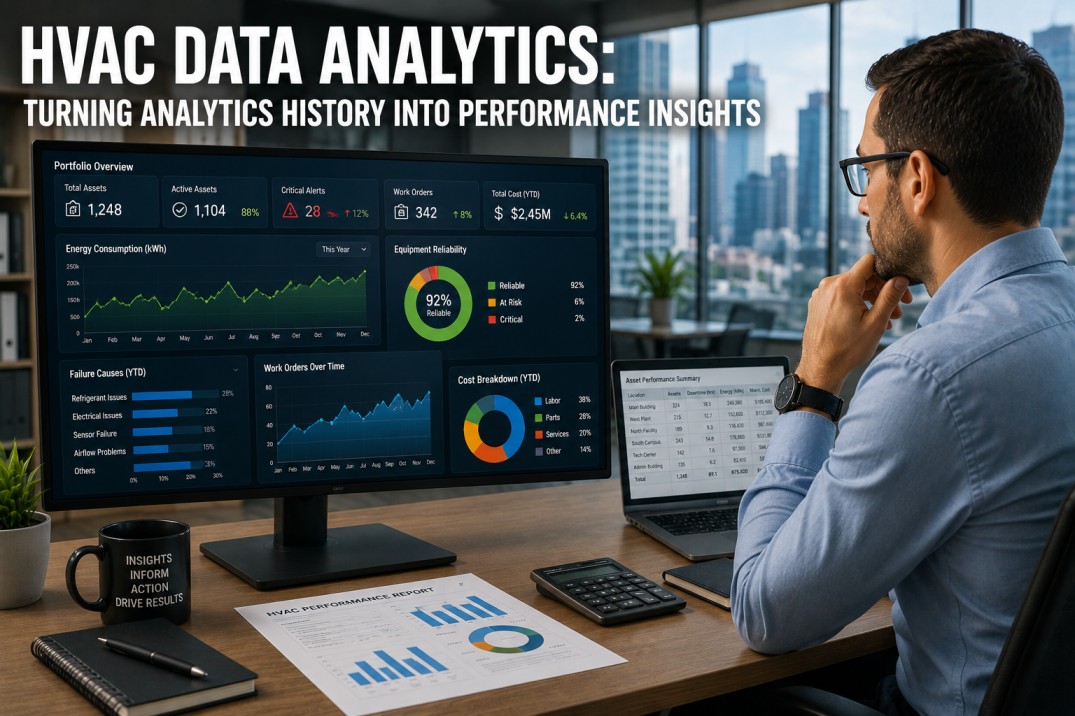
HVAC data analytics transforms the raw operational data generated by building systems temperature readings, pressure trends, current draw, runtime hours, fault codes, and maintenance records into actionable intelligence that drives better decisions about equipment operation, maintenance timing, energy optimization, and capital investment. Without analytics, data is just noise: thousands of sensor readings and work order entries that contain valuable patterns but remain hidden in spreadsheets, BMS logs, and file cabinets. A structured analytics program surfaces failure patterns, cost trends, energy correlations, and reliability metrics that enable facility teams to reduce energy consumption by 12% to 25%, extend equipment life, and make capital decisions backed by evidence rather than intuition.
Turn HVAC Data Into Actionable Performance Insights
iFactory's Analytics Dashboard transforms raw sensor and maintenance data into clear KPIs, trends, and actionable reports. Book a demo to see how structured analytics drives better HVAC decisions.
HVAC Data Types: Operational, Maintenance, Financial & Environmental
Effective analytics draws from four distinct data categories, each providing different dimensions of insight.
Operational Data
Sensor readings: temperature, pressure, humidity, flow, current, vibration, valve position. Control signals: setpoints, schedules, status. Collected at 1-15 minute intervals from BMS and IoT sensors. This data powers real-time monitoring, fault detection, and performance analysis.
Maintenance Data
Work order records: dates, labor hours, parts used, costs, fault codes, technician notes. PM completion records, inspection findings, condition assessments. This data enables failure pattern analysis, labor productivity tracking, and maintenance strategy optimization.
Financial Data
Equipment purchase cost, installation cost, energy cost, maintenance spend (PM + repairs + parts + refrigerant), replacement cost, and disposal cost. This data powers lifecycle cost analysis, ROI calculations, and capital planning.
Environmental & External Data
Outdoor temperature, humidity, solar load, weather forecasts, utility rate structures, carbon pricing, refrigerant GWP values, and regulatory compliance deadlines. This data contextualizes equipment performance and enables sustainability reporting.
Types of HVAC Analytics: Descriptive, Diagnostic, Predictive & Prescriptive
Different analytics questions require different analytical approaches, progressing from what happened to what should be done.
| Analytics Type | Question Answered | Methods | Example Insight | Business Impact |
|---|---|---|---|---|
| Descriptive | What happened? | Dashboards, reports, trend charts | AHU-3 energy increased 12% month-over-month | Awareness, baseline tracking |
| Diagnostic | Why did it happen? | Drill-down, correlation, root cause | AHU-3 energy increase caused by economizer stuck open | Root cause identification |
| Predictive | What will happen? | ML models, regression, anomaly detection | AHU-3 economizer actuator predicted to fail within 45 days | Proactive intervention timing |
| Prescriptive | What should we do? | Optimization, simulation, recommendation | Replace AHU-3 economizer actuator within 2 weeks during planned downtime | Optimal action and timing |
Build Custom Dashboards That Drive Maintenance Decisions
iFactory's platform offers customizable dashboards for every role from executive to technician with real-time data and drill-down capability. Book a demo to see how role-specific analytics empowers every decision.
HVAC KPI Framework: Metrics That Drive Decisions
Key performance indicators translate analytics into clear measures of equipment and program effectiveness.
Performance KPIs
Energy efficiency: kW/ton, Btu/sq ft/yr, EER, COP. Thermal performance: supply air temp vs setpoint, zone temp variance, humidity control. Runtime: run hours, starts per hour, cycling rate. These KPIs tell you if equipment is operating as designed and identify degradation before failure.
Reliability KPIs
MTBF (mean time between failures) by equipment type. MTTR (mean time to repair). Failure rate per 100,000 run hours. Emergency to planned maintenance ratio (target 20:80). Fault recurrence rate. These KPIs measure maintenance program effectiveness and identify equipment nearing end of life.
Financial KPIs
Maintenance cost per sq ft, per ton, per run hour. Energy cost per sq ft, per ton. Total cost of ownership per asset. Capital replacement backlog. ROI of analytics program. These KPIs translate operational performance into financial terms that justify investment and guide budget allocation.
Analytics Dashboard Design: Visualizing Data for Action
Dashboards are the primary interface for analytics consumption. Effective design determines whether insights drive action or are ignored.
| Dashboard Type | Audience | Update Frequency | Key Metrics | Decision Support |
|---|---|---|---|---|
| Executive Summary | Facility director, CFO | Monthly | Total HVAC cost/sq ft, energy trend, capital backlog | Budget allocation, policy changes |
| Operations Dashboard | Facility manager, chief engineer | Daily | Alarm status, equipment health scores, work order backlog | Daily priorities, resource allocation |
| Equipment Detail | Technician, engineer | Real-time | Temp/pressure trends, fault codes, runtime, efficiency | Diagnosis, repair decisions |
| Analytics Program | Analytics manager | Weekly | Faults detected, savings achieved, model accuracy | Program effectiveness, model tuning |
Data Governance: Ensuring Data Quality, Security & Accessibility
Analytics is only as good as the data feeding it. Data governance establishes the rules and processes that ensure reliable, secure, and accessible data.
Data Quality
Implement validation rules at ingestion: reject out-of-range values, flag frozen sensors, detect communication loss. Monitor data completeness per point weekly. Budget 10-15% of analytics program cost for data quality.
Data Security
Role-based access control: limit data access to authorized personnel. Audit logging: track every data access and change. Encryption: AES-256 at rest, TLS 1.3 in transit. Annual security review.
Data Retention
Raw 1-15 minute data retained 12 months for detailed analysis. Hourly/daily aggregates retained 36 months for trend analysis. Alarm and fault events retained 60+ months for compliance and long-term pattern analysis.
Data Accessibility
REST API for programmatic access. Scheduled report delivery via email. Integration with Power BI, Tableau, and Excel. Self-service dashboard builder for custom views.
Frequently Asked Questions
What is HVAC data analytics?
HVAC data analytics is the process of collecting, processing, and analyzing data from HVAC systems to generate actionable insights. It combines operational data (sensor readings, control signals), maintenance data (work orders, inspections), financial data (costs, energy spend), and external data (weather, utility rates). Analytics outputs range from simple dashboards showing current equipment status to sophisticated ML models that predict failures 4-12 weeks in advance.
What KPIs should I track for HVAC performance?
Essential KPIs fall into three categories. Performance: kW/ton, Btu/sq ft/yr, supply air temp vs setpoint, zone temp variance, runtime hours. Reliability: MTBF by equipment type, MTTR, emergency to planned maintenance ratio (target 20:80), fault recurrence rate. Financial: maintenance cost per sq ft, energy cost per sq ft, total cost of ownership per asset, capital backlog value. Start with 10-15 KPIs and add as analytics maturity grows.
How do I build an HVAC analytics dashboard?
Start with the audience and decision they need to make. Executive dashboards: monthly, total cost and energy trends, high-level. Operations dashboards: daily, alarm status, health scores, backlogs, actionable. Equipment dashboards: real-time, detailed trends and fault data for technicians. Follow dashboard design best practices: most important metric top-left, limit to 5-7 metrics per view, use sparklines for trends, color-code status (green/yellow/red), and include the date range and last update timestamp.
What is the difference between descriptive, predictive, and prescriptive analytics?
Descriptive analytics tells you what happened (energy increased 12%). Diagnostic analytics tells you why (economizer stuck open). Predictive analytics tells you what will happen (actuator will fail in 45 days). Prescriptive analytics tells you what to do (replace actuator within 2 weeks). Most organizations start with descriptive/diagnostic and progress to predictive/prescriptive as data maturity and ML capability grow.
How do I ensure HVAC analytics data quality?
Five essential practices: validation rules at data ingestion (reject out-of-range, flag frozen values, communication loss detection), automated alerts for data gaps (no data from a point for 2+ collection cycles), cross-validation between related points (correlated readings should move together), regular data quality reporting (data availability % per point per week), and data quality budget (allocate 10-15% of analytics program cost to data quality activities).
Complete HVAC Data Analytics With iFactory
iFactory's Analytics Dashboard delivers end-to-end data analytics from ingestion and validation through dashboards, reporting, and predictive models. Book a demo to see how data-driven HVAC management transforms operations.