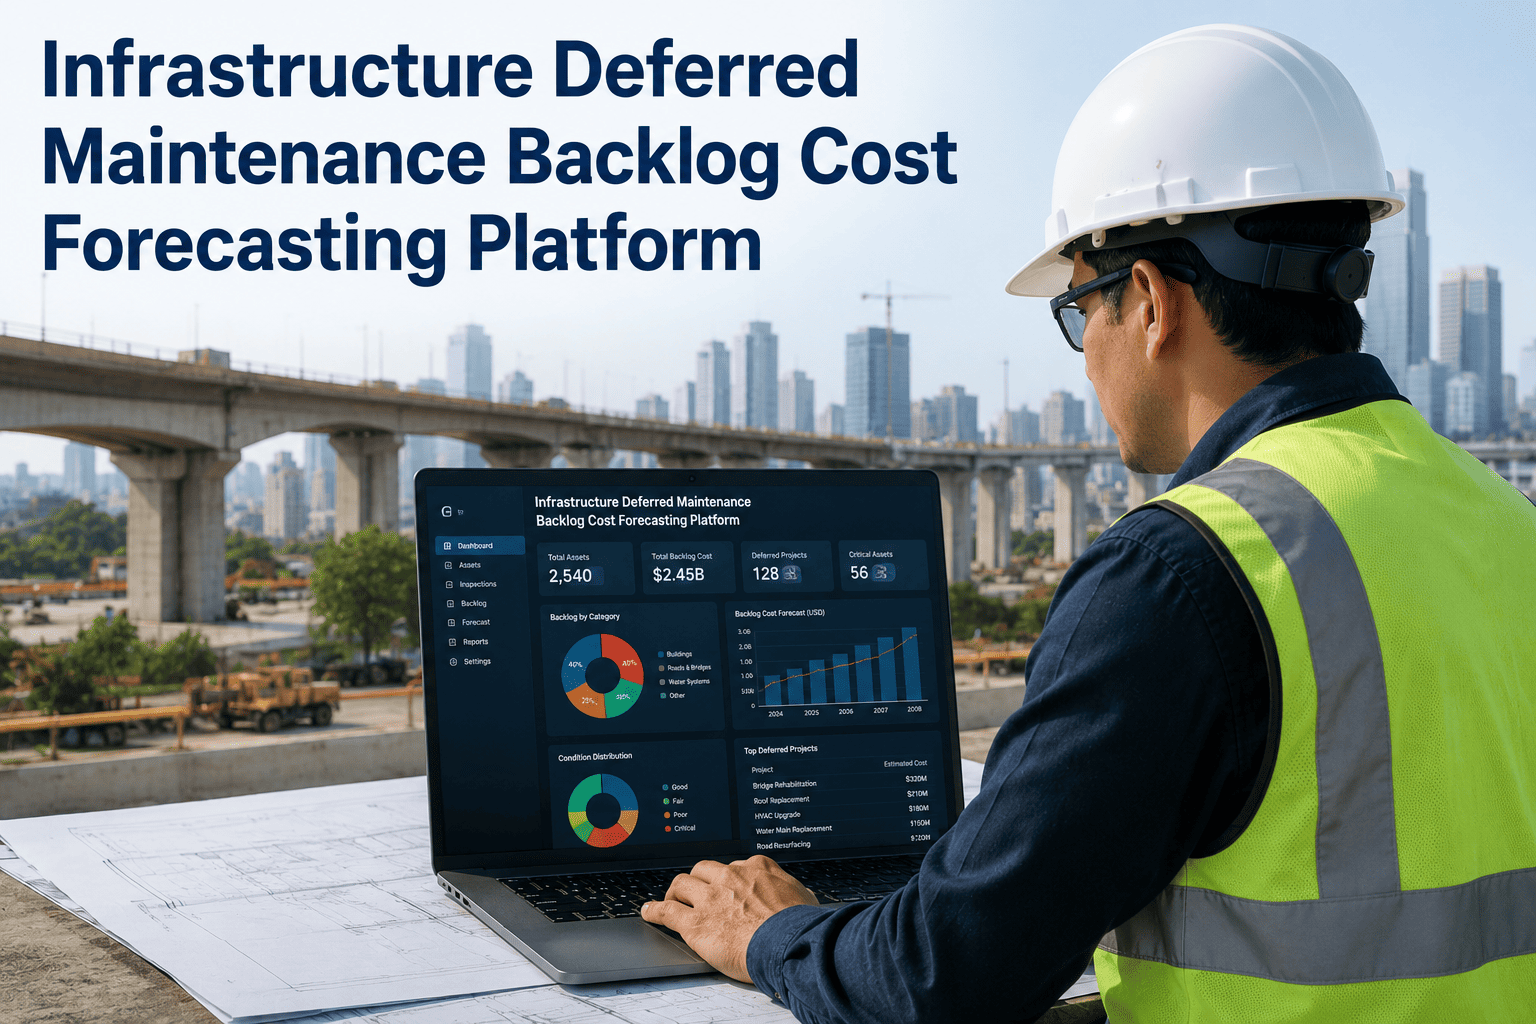
A water utility orders forty gate valves every spring because that is what the budget has always allowed — not because forty valves is what the pipe network actually needs this year. A DOT depot restocks guardrail hardware off last year's usage sheet, missing that this year's storm season pulled three bridge repairs forward into the same quarter. Across public works and infrastructure operations, materials get ordered from habit and gut feel rather than from what the asset base and the maintenance schedule are actually saying. iFactory's material consumption forecasting reads planned work orders, asset condition, and historical usage together, so agencies stop guessing and start ordering what maintenance operations will genuinely consume — see how the engine works at ifactoryapp.com/support.
MAINTENANCE SUPPLY CHAIN — INFRASTRUCTURE
Infrastructure Material Consumption Forecasting for Maintenance Operations
Forecast the materials your maintenance teams will actually need — built from planned work orders, real asset condition, historical consumption, and the repairs already sitting on next quarter's calendar, not from a static reorder sheet nobody has updated in years.
40%
Share of procurement budgets that maintenance materials represent, against under 10% of the technology investment direct materials receive
$50K
Typical downtime cost triggered by one missing low-cost spare that was not in the bin when a crew needed it
22%
Average share of maintenance inventory that sits unused for more than five years under manual planning
32%
Operations leaders reporting frequent stockouts of critical spares even while overall inventory value keeps climbing
Why Material Planning Breaks Down Across Large Asset Portfolios
Infrastructure agencies do not run out of gate valves, guardrail hardware, or transformer bushings because nobody was paying attention. They run out because the systems that know what materials are needed — the work order queue, the asset condition register, the capital project calendar — rarely talk to the system that actually places the order. Planning ends up built on a spreadsheet that was accurate two budget cycles ago, refreshed by whoever had time that week. The result is a portfolio that is simultaneously overstocked on parts nobody needs and short on the ones a crew is standing next to a failed asset waiting for.
1
Work orders and material planning sit in separate systems
Maintenance schedules live in a CMMS, budgets live in a spreadsheet, and nobody reconciles the two until a crew is already short a part
2
Historical usage sheets miss what is coming, not just what happened
A reorder point set from last year's consumption has no way of knowing three capital repairs were just approved for this quarter
3
Supplier lead times stretch past what reactive ordering can absorb
By the time a stockout is visible on a shelf, the part is already weeks away from being replaceable in time for the scheduled repair
4
Crews delay repairs or emergency-source at a markup
A scheduled repair slips a cycle, or the depot pays three to five times the normal price to get the part there overnight
None of these four points is a failure of effort. Planners in most agencies are already stretched across too many depots and too many material categories to reconcile calendars by hand every week, and the tools they inherited were never built to do it for them. The pattern repeats regardless of asset class — roads, water, bridges, electrical, buildings — because the underlying cause is structural, not departmental. Fixing it means giving the planning process the same connected view of demand that the maintenance teams already have of the work itself.
The Signals a Forecasting Engine Actually Reads
Material demand for infrastructure maintenance is never one number — it is the sum of several moving inputs that rarely get combined by hand. iFactory's forecasting engine ingests each of these signals continuously rather than treating a single annual usage report as the whole picture, which is where most manual planning processes stop looking.
01
Asset Condition Data
Remaining useful life estimates, inspection findings, corrosion and wear indicators feed directly into which materials are likely to be consumed and when, not just which are on a fixed replacement schedule.
02
Planned Work Orders & Capital Projects
Approved repairs, rehabilitation schedules, and capital projects already on the calendar are treated as known future demand rather than being discovered after the fact by the storeroom.
03
Historical Consumption by Material Line
Multi-year usage patterns for every material line establish the baseline the model adjusts against, so seasonal swings and one-off spikes do not get treated as the new normal.
04
Seasonal & Weather Patterns
Freeze-thaw cycles, storm seasons, and heat events all pull specific material categories forward in the calendar, and the model adjusts order timing to match rather than reacting after damage appears.
05
Supplier Lead Time Variability
Actual delivery performance by supplier and material category, not the lead time printed on a contract from three years ago, sets the buffer the model recommends holding.
06
Criticality & Failure Consequence
A part behind a safety-critical failure mode is planned to a different confidence level than a low-consequence consumable, so budget goes where the risk actually sits.
Where Material Demand Concentrates by Asset Class
Every infrastructure category consumes materials on its own rhythm, and a forecasting model tuned for road maintenance performs poorly if applied unchanged to a water network or an electrical grid. The table below maps the material categories, seasonal demand drivers, and typical lead time risk that iFactory's models are calibrated against for each asset class in a portfolio.
| Asset Class |
Primary Materials Consumed |
Seasonal Demand Driver |
Typical Lead Time Risk |
| Roads & Pavement |
Asphalt patch mix, crack sealant, signage hardware, guardrail parts |
Freeze-thaw damage, storm season |
Moderate — regional suppliers |
| Water & Wastewater |
Gate valves, pipe couplings, gaskets, pump seals |
Pipe stress from ground movement and heat |
High — specialized fittings |
| Bridges & Structures |
Expansion joints, bearing pads, coating systems, structural fasteners |
Post-inspection rehabilitation cycles |
High — fabricated components |
| Electrical & Grid |
Transformers, breakers, insulators, cable and conduit |
Storm outage season, load growth |
Very high — long-lead equipment |
| Buildings & HVAC |
Filters, belts, compressors, control boards |
Seasonal cooling and heating load swings |
Low to moderate — stocked distributors |
Portfolios that span several of these asset classes at once tend to see the largest planning gains, because the categories with the highest lead time risk — electrical equipment, fabricated structural components, specialized water fittings — are exactly the ones where a missed forecast costs the most in delayed repairs and emergency premiums. A model that understands the difference between a filter that can be replenished from a regional distributor next week and a transformer that needs to be ordered months in advance gives planners a defensible reason to hold more buffer on one category and less on another, instead of applying one blanket safety stock rule across a portfolio that does not behave uniformly.
See Your Own Material Demand Modeled Before You Commit to It
iFactory can connect to your existing CMMS, asset registers, and historical usage data to show what forecasted material demand looks like against your actual work order calendar — before a single order gets placed differently.
What Guessing Actually Costs, Scaled Up
Individually, a delayed repair or an emergency order rarely looks like a crisis. It is one purchase order, approved without much debate. The number that changes minds is the same pattern multiplied across every depot, every quarter, every year — which is where the real budget leak lives.
PER PART
3x–5x
Typical markup paid on an emergency-sourced part compared to standard procurement pricing for the same item
PER WORK ORDER
1–3 Weeks
Common delay on a scheduled repair when the required material was not staged in time for the crew's visit
PER DEPOT PER QUARTER
$15K–$80K
Combined cost of emergency premiums, idle crew time, and rescheduled work across a single storeroom's material misses
PER AGENCY PER YEAR
$500K–$2M+
Combined value of dead stock, emergency premiums, and deferred repairs across a full infrastructure maintenance portfolio
These figures are conservative on purpose. They exclude the harder-to-quantify cost of a delayed repair that lets a small defect become a larger one, or the reputational cost when a resident-facing failure — a pothole left unpatched, a water main repair that slips a week — traces back to a part sitting on backorder rather than on a shelf. Agencies that have run the comparison internally consistently find that the visible line items in a shrink report understate the total cost of reactive material planning by a wide margin.
How the Forecasting Engine Turns Data Into an Order Quantity
A forecast is only useful if it lands as a number someone can act on inside the same procurement workflow the team already uses. iFactory's engine is built to close that loop end to end, so the output is never a report that sits unread — it is a recommended order quantity attached to a specific material line, a specific depot, and a specific window of need.
A
Data Ingestion
Asset registers, CMMS work orders, historical consumption, and supplier lead time records are pulled in on a continuous refresh cycle rather than a quarterly export.
B
Demand Modeling
Category-specific models combine planned work, condition data, and seasonal patterns to project consumption for each material line over the coming planning horizon.
C
Order Recommendation
The model outputs a recommended order quantity and timing per material line, weighted by criticality and current lead time risk for that supplier.
D
Planner Review & Approval
Planners review recommendations against budget constraints and approve, adjust, or defer directly inside the existing procurement workflow.
E
Outcome Learning
Actual consumption against forecast feeds back into the model, tightening accuracy for that material line and that depot every planning cycle.
A Materials Manager on What Changed First
For years our reorder points were basically inherited. Whoever set them a decade ago set them, and every planner since just kept the number because changing it felt riskier than leaving it alone. That meant we were carrying six-figure inventory in parts nobody had touched in years, while critical valve stock ran out twice in one construction season because nobody had connected the pipe rehabilitation calendar to the storeroom order sheet. What changed once we brought forecasting into the planning cycle was not that we suddenly knew everything — it was that the order quantities finally reflected work that was actually scheduled instead of work that happened to occur last year. Our emergency purchase orders dropped first, because that is the easiest thing to see change. The dead stock number moved slower, over about two quarters, as we worked through what was already sitting on the shelf. What surprised our finance director was not the shrink line — it was how much staff time came back once planners stopped spending Friday afternoons trying to reconcile three spreadsheets by hand.
— Materials Planning Manager, Regional Public Works Agency · 15 Years Infrastructure Procurement · Oversees Six Maintenance Depots
What Changes in the First 90 Days
Days 1–14
Data connected, baseline established
CMMS work orders, asset condition records, and historical consumption are connected, and a current-state baseline is captured for comparison against future forecasts.
Days 15–30
First forecasts reach planners
Recommended order quantities for pilot material lines start landing in the existing procurement workflow, alongside the reasoning behind each recommendation.
Days 31–60
Emergency orders begin to drop
Stockout-driven emergency purchases on pilot material lines fall as order timing starts matching the actual work order calendar instead of a fixed reorder point.
Days 61–90
Dead stock gets identified and worked down
Material lines with no forecasted demand are flagged for redeployment or disposal, freeing working capital that had been sitting idle on the shelf.
Frequently Asked Questions
How is material forecasting different from a standard min-max reorder point system?
A min-max system reacts to a fixed threshold that someone set in the past and rarely revisits, regardless of what work is actually scheduled next quarter. Material forecasting instead combines planned work orders, asset condition data, and seasonal demand patterns to project what a specific material line will actually be consumed for in the coming period, then recommends an order quantity and timing built from that combined picture. The threshold in a min-max system does not know a capital project was just approved; a forecasting model reads that project directly. You can review how the model handles your specific material categories through
our support team.
Does this require replacing our existing CMMS or procurement system?
No — the forecasting engine is designed to sit alongside your existing CMMS and procurement workflow rather than replace either one. It connects to the work order data, asset registers, and consumption history you already maintain, and delivers recommended order quantities back into the process your planners already use to approve purchases. Most agencies keep their current systems of record in place and add the forecasting layer on top, which shortens the implementation timeline considerably. A team member can walk through your specific system landscape if you
reach out to support.
How much historical data do we need before forecasts are reliable?
Meaningful forecasts can begin with as little as twelve to eighteen months of consumption history combined with a current asset condition register, though accuracy improves as more cycles of actual-versus-forecast data feed back into the model. Material lines with thinner history are weighted more conservatively until enough outcome data accumulates to sharpen the projection. New or recently added asset classes are handled with reference patterns from comparable categories until their own history builds up, so a data gap in one area does not stall the whole rollout.
Can the model account for capital projects and rehabilitation work that has not started yet?
Yes — approved capital projects and rehabilitation schedules are treated as known future demand rather than something the model has to infer from past behavior. Once a project is entered into the planning calendar, the material lines associated with that scope of work are factored into the forecast for the relevant depot and time window. This is one of the clearest differences from historical-average planning, which has no way of anticipating demand that has not happened before. Projects can be adjusted or rescheduled and the forecast updates accordingly on the next planning cycle.
What does a typical pilot look like before committing across the full portfolio?
Most agencies start with a costed pilot on two or three depots or a handful of high-value material categories, comparing forecasted order recommendations against what would have been ordered under the existing process over a full planning cycle. That pilot produces a direct, measurable comparison — emergency orders avoided, dead stock identified, planner time saved — before any decision is made to expand further. To scope a pilot against your own material spend and depot structure,
book a demo and the team will walk through the model with your actual data.
Order What Maintenance Operations Will Actually Consume
Infrastructure material planning does not have to run on inherited reorder points and last year's usage sheet. iFactory's forecasting engine reads planned work, asset condition, and consumption history together so your depots stop paying emergency premiums for parts they could have seen coming and stop tying up capital in stock nobody needs.