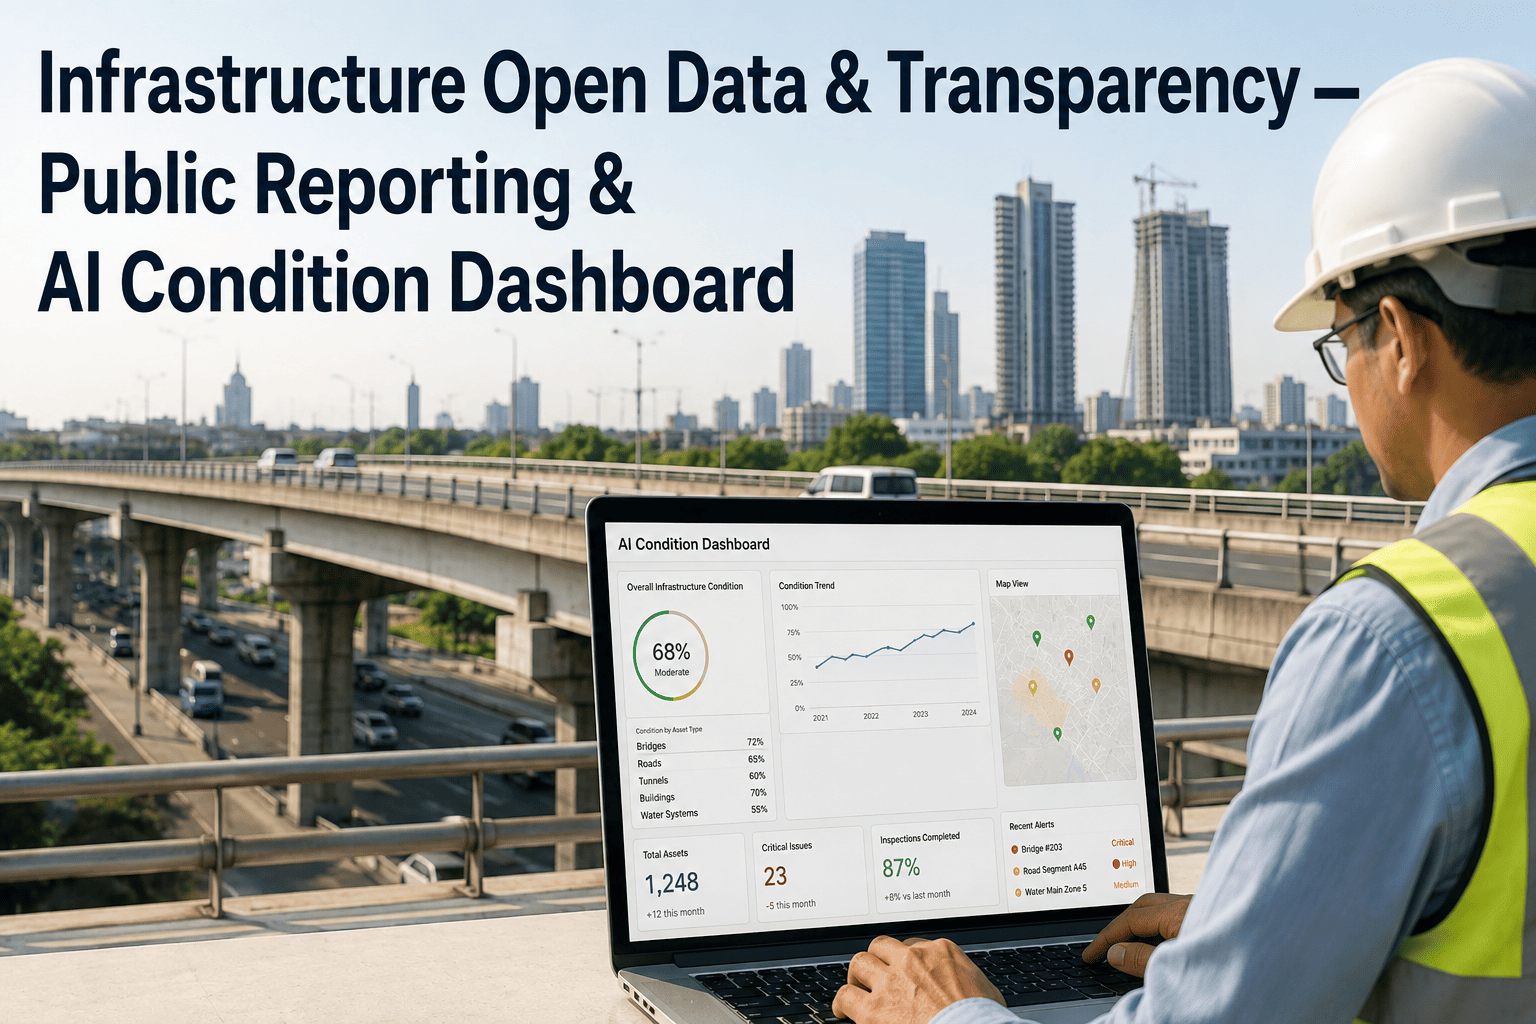
Residents rarely file a records request for a spreadsheet. They ask why the bridge near their child's school hasn't been inspected in three years, or where a voter-approved bond is actually being spent, and if that answer takes weeks to compile, public trust erodes faster than any pavement ever will. Compliance officers now sit at the center of this shift, expected to turn asset condition data that once lived quietly inside work order systems into something a resident can open on a phone and understand in under a minute. AI-powered condition dashboards make that possible without turning every disclosure request into a manual reporting project, pulling directly from inspection and maintenance records your team already collects. The agencies moving fastest on open data treat transparency as infrastructure in its own right, not something bolted on right before a bond vote — and that shift is exactly what happens once you book a walkthrough with our team.
Compliance & Regulatory · Public Reporting
Infrastructure Open Data & Transparency: Public Reporting Built On AI Condition Dashboards
Give citizens, auditors, and elected officials a live, defensible view of infrastructure condition and capital spending, built from data your compliance and asset teams already collect, published without adding a reporting headcount line.
21%
Roughly the share of residents who say they trust public institutions to act in their interest — transparency programs are one of the few levers that move it
40+
Core data points recognized infrastructure disclosure frameworks call for across a project's identification, procurement, and delivery stages
60 sec
Typical refresh interval for AI-driven public dashboards, replacing report cycles that used to run in days or weeks
Citizen Demand
What Residents Actually Look For When They Open a Public Dashboard
Most citizens never read a capital improvement plan end to end. They scan for a handful of specific answers, and if a dashboard buries those answers under jargon or requires a login, they leave and assume the worst. Compliance teams that design around these four questions consistently see higher return visits and fewer inbound public records requests, because the information residents were going to ask for eventually is already sitting in front of them the first time they look. That shift alone reduces the volume of formal disclosure requests a compliance team has to process manually, since a resident who can already see the answer online has no reason to file paperwork asking for it.
Asset Condition & Age
A plain-language condition rating for roads, bridges, water lines, and buildings — not an internal engineering code — paired with the last inspection date so residents can judge how current the information is.
Maintenance & Inspection Status
Whether scheduled preventive maintenance is on track or slipping, and when the next inspection is due, so a missed cycle is visible before it becomes a failure story in the local news.
Capital Spending Progress
How a specific bond, grant, or tax measure is being spent against its original budget and timeline, broken down by project rather than buried in a single agency-wide total.
Service & Safety Outcomes
Downtime trends, service request resolution times, and safety-related closures, framed as outcomes residents feel rather than internal operational metrics only staff would recognize.
How It Works
From Inspection Record to Public Dashboard, Without a Manual Handoff
The technical gap between "we collect this data" and "the public can see this data" is smaller than most compliance teams expect. It is a governance and mapping problem more than an engineering one, and it follows a consistent five-stage path. None of these stages require replacing the systems your inspection, maintenance, and finance teams already rely on day to day — the work is in defining what flows through to the public view, on what schedule, and under whose sign-off, then letting that logic run automatically instead of re-deciding it every reporting cycle.
01
Source Systems
Inspection logs, CMMS work orders, GIS asset records, and capital project budgets already sitting in your existing platforms.
02
Governance Layer
Your compliance rules determine exactly which fields, locations, and detail levels are eligible for public release before anything is exposed.
03
AI Condition Model
Raw inspection and sensor data is translated into a consistent, plain-language condition rating and trend line residents can actually read.
04
Disclosure Rules Engine
Security-sensitive fields — exact coordinates on critical assets, technician identities, live dispatch data — are filtered out automatically, every refresh cycle.
05
Citizen Dashboard
A public-facing view refreshed on an interval you control, embeddable on your existing website or hosted as a standalone portal.
The Real Difference
Manual Quarterly Reports vs. A Live AI Condition Dashboard
Manual Reporting Cycle
Staff export data from multiple systems, reconcile it by hand, and format a PDF or slide deck that is accurate on the day it is published and stale within weeks. Each disclosure request restarts the process, and every new stakeholder gets a slightly different version of the numbers depending on when it was pulled. When a council member, an auditor, and a local reporter each ask for the same figures in the same month, three separate exports get pulled, and small discrepancies between them become their own credibility problem regardless of which version is actually correct.
AI-Powered Public Dashboard
Condition, spending, and maintenance data update automatically on a fixed cadence, filtered through the same governance rules every time. Auditors, journalists, and residents all see the same numbers at the same moment, and your compliance team spends its time on policy decisions instead of formatting spreadsheets. Because the underlying logic never changes between refreshes, a number published in January and a number published in June are directly comparable, which is exactly what auditors and rating agencies look for when evaluating how well an agency manages its capital program over multiple budget cycles.
See It Against Your Own Asset Data
Most Agencies Underestimate How Much of This Data They Already Have
Before building anything, we walk through your existing inspection, maintenance, and capital project systems to show exactly what could be public-facing within your current disclosure policy — no new data collection required to start.
Compliance Guardrails
What Belongs on a Public Dashboard, and What Doesn't
The fastest way to stall an open data initiative is a single disclosure mistake that triggers a security or legal review. Getting the publish/restrict line right up front is what lets a compliance officer approve a dashboard confidently rather than reactively, and it is worth treating this list as a living document rather than a one-time sign-off — reviewed alongside legal counsel whenever a new asset category or data source is added to the public view.
Generally Safe to Publish
Aggregated condition ratings and trend lines by asset category or district
Budget-to-actual spending by project, with milestone and timeline status
Preventive maintenance completion rates and inspection cadence
Service request volumes, resolution times, and year-over-year comparisons
Typically Restricted or Redacted
Precise coordinates or access details for security-critical infrastructure
Individual technician names or real-time crew dispatch locations
Vulnerability details for assets with known structural or safety concerns
Contract negotiation details still under active procurement review
Design Reference
A Starter Set of Public-Facing KPI Tiles
Dashboards with a small, focused set of headline metrics consistently hold public attention far longer than cluttered ones. A workable starting set usually looks like this, with everything else available as a drill-down rather than a front-page tile. Naming matters as much as the number itself — a label a resident recognizes instantly, paired with a one-line definition, does more for trust than any additional precision in the underlying figure.
| Public KPI Tile | Refresh Cadence | Why Residents Care | Disclosure Sensitivity |
| Asset Condition Rating |
Daily |
Answers "is this safe and being looked after" in one glance |
Low — aggregate rating only |
| Preventive Maintenance On-Time Rate |
Weekly |
Shows whether upkeep is proactive or reactive |
Low |
| Capital Project Budget vs. Actual |
Monthly |
Directly answers "where did the bond money go" |
Medium — review before publishing final figures |
| Service Requests Resolved |
Weekly |
Demonstrates responsiveness to reported issues |
Low |
| Safety-Related Closures |
Real-time to daily |
Immediate, high-trust information residents actively search for |
Medium — location detail often generalized |
Why This Matters Beyond Compliance
Transparency Is What Gets the Next Bond Approved
Open infrastructure data is not only a disclosure obligation — it is increasingly the reason capital investment gets approved at all. Cities that publish interactive dashboards alongside bond programs report that residents are more willing to track spending directly rather than relying on secondhand reporting, which measurably changes the tone of public debate before a renewal vote. One large municipal bond program covering dozens of major projects made its full schedule and budget status trackable by any resident, turning what used to be a once-a-year presentation into something the public could check anytime. The pattern holds across smaller agencies too: when disclosure is continuous rather than event-driven, the public conversation shifts from "prove it was spent well" to "show me the current status," which is a far easier conversation for a compliance officer to support.
Agencies that treat open data as a trust-building tool, not a compliance checkbox, consistently see faster approval cycles on follow-on capital requests.
This is also where a compliance officer's role expands beyond gatekeeping. Elected officials asking for a status update ahead of a public hearing, finance teams preparing a rating agency presentation, and communications staff drafting a press response all end up pulling from the same live dashboard instead of requesting a fresh custom export each time. That single source of truth removes a recurring point of friction between departments and reduces the chance that two teams present slightly different numbers to the same audience in the same week.
Getting Started
Sequencing a Public Reporting Program Without Overreaching
The agencies that stall usually try to publish everything at once. The ones that succeed treat the rollout as three deliberate phases, each one building credibility for the next, with leadership able to see measurable proof of value before being asked to sign off on a wider, more visible commitment.
Phase 1
Pilot on One Asset Class
Choose a single, high-visibility category — roads or bridges typically — and publish condition and spending data for it alone. This keeps the governance review scope manageable and gives you a real example to show leadership before expanding.
Phase 2
Expand Across Departments
Bring in water, facilities, and remaining infrastructure categories using the same disclosure rules and dashboard structure established in the pilot, rather than rebuilding governance logic from scratch for each department.
Phase 3
Institutionalize the Cadence
Move from a project with an end date to a standing operating process, with refresh intervals, review responsibilities, and public feedback channels documented so the program survives staff and leadership turnover.
What Actually Slows These Down
Common Pitfalls in Public Infrastructure Reporting
Publishing Raw Engineering Codes
Internal condition scores mean nothing to a resident. Translating them into plain language up front avoids a wave of confused public inquiries after launch.
Treating It as a One-Time Report
A dashboard that stops updating after the launch announcement loses credibility faster than never having launched one — refresh cadence has to be sustainable from day one.
Skipping the Security Review
Rushing a dashboard live without a defined restricted-field list is the single most common cause of a program getting paused for legal review mid-rollout.
Too Many Metrics, No Hierarchy
A homepage crowded with dozens of tiles loses residents in seconds. A small headline set with drill-down detail keeps attention and repeat visits, while the full detail stays one click away for anyone who wants to dig further.
"
The compliance officers who get this right stop thinking about open data as a records-request response and start thinking about it as a product residents check the way they'd check a weather app. That mental shift changes every decision after it — what gets a headline tile, how often it refreshes, and how plainly it's worded. Once a dashboard earns that habit, the next capital request gets a noticeably easier hearing.
Renata Castellanos-Whitfield
Public Sector Transparency Advisor · 12 years supporting municipal disclosure, open data governance, and public infrastructure reporting programs
Compliance Questions
Open Data & Public Reporting — Frequently Asked
What data are we actually expected to publish for infrastructure transparency?
Expectations vary by jurisdiction, but recognized frameworks such as the CoST Infrastructure Data Standard point to roughly forty core data points spanning a project's identification, procurement, and implementation stages, alongside asset condition and maintenance status once a project moves into operations. Most agencies start with what residents ask for most — condition, spending, and timeline — rather than attempting full framework compliance on day one.
Book a call to map your specific disclosure obligations against what you already collect.
Does an AI dashboard mean we lose control over what gets disclosed?
No — the governance and disclosure rules are configured by your compliance team before anything goes live, and the AI layer enforces those rules consistently on every refresh rather than replacing your judgment. You define which fields, locations, and detail levels are eligible for public release, and the system applies that filter automatically instead of relying on someone remembering to redact it manually each cycle.
Contact support to review how disclosure rules are configured.
How is sensitive infrastructure information kept out of the public dashboard?
A disclosure rules engine sits between your internal systems and the public-facing view, filtering out fields like precise coordinates on security-critical assets, individual staff identities, and active procurement details before anything is rendered. This filtering runs on every refresh cycle automatically, so a newly added record can't accidentally appear publicly before it has been reviewed against your restricted-field list.
Book a demo to see the disclosure rules engine in action.
Will this replace our existing CMMS or asset management system?
No — the dashboard reads from the systems you already use for inspections, maintenance, and capital budgeting rather than requiring a separate data entry process. Your team keeps working in its existing tools, and the public-facing layer simply reflects an approved, filtered view of that same underlying data on the cadence you set.
Talk to our team about connecting your current systems.
How long does it take to get a public condition dashboard live?
A single-asset-class pilot, such as roads or bridges alone, is typically the fastest path to a live public dashboard, since it keeps the governance review scope narrow and gives leadership a concrete example before wider rollout. Timelines depend more on internal disclosure policy review than on the technical build itself.
Book a call to scope a realistic timeline for your agency.
Your Data Is Already There
Turn Existing Inspection and Spending Records Into a Public Dashboard
iFactory maps your inspection, maintenance, and capital project data against your disclosure rules, then publishes a live, plain-language condition dashboard residents and auditors can trust — without a manual reporting cycle behind it.