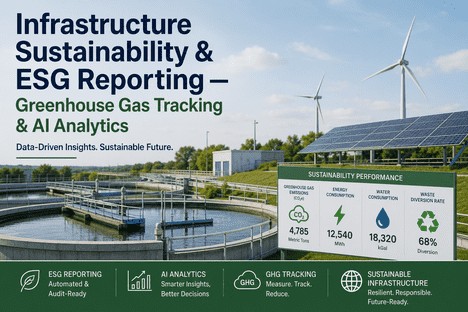
Infrastructure Sustainability & ESG Reporting — Greenhouse Gas Tracking & AI Analytics
By Grace on June 27, 2026
Sustainability reporting for infrastructure assets used to mean publishing an annual PDF with last year's energy consumption, a summary of emissions, and a narrative about environmental commitments. That era ended the moment regulators, investors, and funding bodies stopped accepting annual summaries and started demanding continuous, auditable, third-party-verified ESG data — collected the same way, across every site in the portfolio, reported against the same framework, with traceability from sensor reading to disclosure number. For EHS managers responsible for infrastructure portfolios spread across dozens or hundreds of locations, the new reality is that sustainability reporting is no longer a once-a-year documentation exercise. It is a continuous data management operation — and the organisations that treat it as such are the ones that will meet their compliance deadlines with data that auditors and rating agencies will accept without exception. iFactory's AI-powered ESG reporting and greenhouse gas tracking module was built to make that operation possible at infrastructure scale.
ESG Reporting AI · Greenhouse Gas Tracking · Sustainability Analytics · Infrastructure EHS · Scope 1 2 3
Your Infrastructure Portfolio Already Generates the Data. The Question Is Whether You Can Collect It, Verify It, and Report It Before the Regulatory Deadline.
iFactory's AI-powered ESG module automates greenhouse gas tracking, energy and water monitoring, and multi-framework sustainability reporting across every asset and site in your infrastructure portfolio — with audit-ready data that satisfies CSRD, ISSB, GRESB, TCFD, and GRI requirements.
Of global carbon emissions come from the construction and infrastructure sectors — making accurate GHG tracking and reporting the highest-leverage decarbonisation lever available to infrastructure operators
60%
Of finance leaders report that fragmented ESG data across disconnected systems is the primary obstacle to meeting regulatory reporting deadlines and assurance requirements
46%
Year-over-year increase in customer sustainability data requests reported by Equinix — illustrating the demand-side pressure for auditable, real-time ESG data from infrastructure operators
2026
The year mandatory Scope 1 and 2 emissions reporting took effect for large companies in California under SB 253 — with Scope 3 reporting following in 2027, signalling a global regulatory inflection point
The ESG Reporting Problem Is Not a Standards Problem. It Is a Data Infrastructure Problem.
The most common assumption about ESG reporting difficulty is that the challenge lies in understanding which framework applies, which metrics to report, and which methodology to use. In practice, those are well-documented problems with well-documented answers. The real difficulty is something more fundamental: the data that ESG reporting requires already exists across your infrastructure portfolio, but it lives in systems that were never designed to talk to each other. Energy consumption data is in the building management system. Fuel records are in the fleet management platform. Water usage is in the utility billing system. Waste disposal records are in the contractor portal. Emissions factors are in a spreadsheet maintained by the sustainability team. The EHS manager's job has become a data integration role — and the tools most organisations provide for that role are email requests and manual data entry.
Four Data Infrastructure Failures That Make ESG Reporting More Expensive and Less Reliable Than It Should Be
The Fragmentation Trap
ESG data lives in ten different systems. The EHS team compiles it manually. Every compilation introduces error.
Infrastructure portfolios generate ESG-relevant data from building management systems, SCADA platforms, fleet telematics, utility meters, fuel management systems, waste contractor portals, and procurement systems. None of these systems were designed to feed a sustainability report. The EHS team extracts data from each source, normalises formats in spreadsheets, applies emissions factors from a separate database, and manually checks for anomalies. Each manual touch point is a potential error source — a misaligned time period, a missing meter reading, an outdated emissions factor. The process takes weeks, produces a report that is difficult to audit, and consumes sustainability analyst time that should be spent on decarbonisation strategy rather than data reconciliation.
CSRD, ISSB, GRI, TCFD, GRESB, SECR — each requires different data, different calculations, different presentation.
Infrastructure operators reporting across multiple jurisdictions often need to produce ESG disclosures aligned with CSRD in Europe, ISSB for international investors, GRI for stakeholder reporting, TCFD for climate risk disclosure, GRESB for infrastructure asset benchmarking, and SECR for UK statutory reporting. Each framework defines materiality differently, specifies different calculation methodologies for overlapping metrics, and requires different supporting data. The manual approach requires the EHS team to map each data point to each framework's requirements separately — a process that duplicates effort, increases the risk of inconsistency, and makes it nearly impossible to produce a single auditable data trail that satisfies all frameworks simultaneously.
Regulators now require third-party assurance. Manual data processes cannot produce the audit trail that assurance providers demand.
Under CSRD, mandatory third-party assurance of ESG data took effect in 2025. California's SB 253 requires limited assurance for Scope 1 and 2 emissions from 2026, moving to reasonable assurance by 2030. Assurance providers require every data point in the ESG report to be traceable to its source, with a documented methodology for how it was collected, processed, and attributed. A manually compiled spreadsheet does not provide that traceability. When the assurance provider asks for the source meter reading behind a reported emissions figure, the manual process requires the EHS team to trace back through multiple spreadsheets, email threads, and system extracts — a process that can take days and may reveal data quality issues that require restatement.
No Audit Trail + Untraceable Data Points = Assurance Risk
The Scope 3 Data Challenge
Value chain emissions now dominate the carbon footprint, but supplier data is inconsistent, incomplete, and manually collected.
For most infrastructure organisations, Scope 3 emissions represent 70 to 90 percent of the total carbon footprint. Collecting Scope 3 data requires engaging suppliers, contractors, and value chain partners across the portfolio — each with different data systems, different reporting capabilities, and different levels of data quality. Manual Scope 3 data collection involves sending supplier questionnaires, chasing responses, reconciling inconsistent formats, and estimating emissions where primary data is unavailable. The result is a Scope 3 figure that is heavily estimated, difficult to assure, and insufficient for the reduction target setting that regulators and investors increasingly expect. With GRESB introducing mandatory data coverage requirements for Scope 3 reporting in 2025 and California SB 253 requiring Scope 3 assurance from 2027, the manual approach to value chain emissions is no longer viable.
Estimated Emissions + Unverifiable Supplier Data = Target Setting Risk
The Regulatory Landscape Is Not Slowing Down. It Is Accelerating — and Infrastructure Operators Are in the Crosshairs.
Despite political headwinds in some jurisdictions, the global trajectory of ESG regulation is clear: mandatory disclosure, third-party assurance, and climate scenario analysis are becoming baseline requirements for infrastructure operators accessing capital markets, public funding, and institutional investment. The organisations that build the data infrastructure to meet these requirements now will have a compliance advantage that compounds with every new regulation.
Key ESG Regulatory Deadlines and Requirements Affecting Infrastructure Operators — and What iFactory Automates for Each
Regulation
Infrastructure Reporting Requirement
iFactory AI Automation Capability
CSRD / ESRS
Mandatory double materiality assessment, Scope 1-3 emissions disclosure, energy and water intensity metrics, climate scenario analysis. Third-party assurance required from 2025. Applies to infrastructure operators meeting EU revenue and employee thresholds.
Automated data ingestion from BMS, SCADA, and IoT sensors for real-time Scope 1 and 2 calculation. Pre-built ESRS data model maps sensor data to ESRS E1-E5 disclosure requirements. Full audit trail for every metric, exportable for assurance provider review.
California SB 253
Mandatory Scope 1 and 2 reporting from 2026, Scope 3 from 2027. Limited assurance from 2026, reasonable assurance by 2030. Applies to companies with over USD 1 billion revenue doing business in California.
Continuous emissions tracking with location-based and market-based Scope 2 calculation options. Automated anomaly detection flags implausible readings before assurance review. Supplier data collection workflow for Scope 3 with automated emissions factor application.
ISSB S1 / S2
Climate scenario analysis under S2. Financial impact disclosure of climate-related risks and opportunities. Scope 1-3 emissions disclosure aligned with GHG Protocol. Increasing adoption by stock exchanges and regulators globally.
AI-powered climate scenario modeling for 1.5 degree Celsius and 4 degree Celsius pathways. Asset-level physical risk scoring for flood, heat, storm, and wildfire. Financial impact projections integrated with asset valuation data for S2 disclosure.
GRESB Infrastructure
Mandatory GHG emissions data coverage reporting from 2025. Net zero target setting with science-based framework alignment. Scope 3 emissions reporting. Performance data coverage requirements for key metrics.
Pre-mapped GRESB indicator data model with automated population from asset-level sensor data. Data coverage calculation with gap identification. Net zero target framework alignment documentation. GRESB-ready reporting output with evidence attachment workflow.
GHG Tracking · ESG Data Infrastructure · AI Sustainability Analytics · Assurance Ready
Regulatory Deadlines Are Fixed. Manual Data Processes Are Not Scalable. The Only Leverage Is Automation.
iFactory's AI ESG module connects directly to your existing infrastructure data sources — building management systems, SCADA, utility meters, fleet telematics — and transforms scattered operational data into audit-ready ESG disclosures aligned with every major reporting framework.
GHG Scope 1, 2, and 3 Tracking — What iFactory Automates at Each Level of the Emissions Hierarchy
Greenhouse gas accounting under the GHG Protocol requires organisations to classify emissions into three scopes, each with distinct data sources, calculation methodologies, and reporting requirements. iFactory's AI engine handles all three scopes within a single platform — ingesting data from across the infrastructure portfolio, applying the correct calculation methodology for each emission source, and producing auditable Scope 1, 2, and 3 figures that satisfy regulatory and investor requirements.
Scope 1 — Direct Emissions
Fuel Consumption, Fleet Vehicles, Fugitive Emissions — Automatically Captured From Every Asset and Site
Direct Source Tracking
iFactory's GHG engine ingests fuel consumption data from across the infrastructure portfolio — natural gas from building management systems, fleet fuel from telematics and fuel management platforms, generator fuel from maintenance records, and fugitive emissions from HVAC refrigerant logs. Each emission source is automatically mapped to the correct GHG Protocol category and emission factor, with calculation methodology documented at the source level. When a new piece of equipment is added to the asset register, its emission source type is classified automatically, and the appropriate tracking begins without manual configuration. The result is a Scope 1 inventory that updates continuously as fuel is consumed and equipment operates — not once a year when the sustainability team manually collects utility bills and fuel receipts.
Automated fuel and gas data ingestion
GHG Protocol emission factor mapping
Fugitive emission tracking from refrigerant logs
Scope 2 — Indirect Energy Emissions
Purchased Electricity, Steam, Heat, and Cooling — With Location-Based and Market-Based Calculation
Energy Intelligence
iFactory connects to utility meters, building management systems, and smart grid interfaces to capture purchased electricity, steam, heat, and cooling consumption data in real time. The platform calculates Scope 2 emissions using both location-based and market-based methodologies as required by the GHG Protocol and multiple regulatory frameworks — so the same energy consumption data generates the correct Scope 2 figure for CSRD, SB 253, and GRESB reporting without manual recalculation. When renewable energy certificates or power purchase agreements are in place, the market-based calculation automatically applies the appropriate emission factor for certified renewable electricity. Energy intensity metrics by asset class and site are calculated continuously, enabling EHS managers to identify high-consumption assets, track efficiency improvement programmes, and report energy performance against reduction targets with data that is always current.
Real-time meter and BMS data ingestion
Location-based and market-based calculation
Energy intensity tracking per asset class
Scope 3 — Value Chain Emissions
Supply Chain, Capital Goods, Waste, Business Travel — Automated Data Collection With Supplier Engagement Workflows
Value Chain Visibility
Scope 3 is the most data-intensive and methodologically complex component of the corporate carbon footprint. iFactory addresses this with a multi-layered approach. Category 1 purchased goods and services emissions are calculated using spend-based methodology with automated emission factor application from environmentally extended input-output databases, transitioning to supplier-specific data as vendor disclosures improve. Category 2 capital goods emissions are linked to the asset lifecycle module, with embodied carbon from construction and major rehabilitation projects tracked at the asset level. Categories 4 and 9 upstream and downstream transportation emissions are calculated using distance-based methodology with fuel consumption data from logistics systems. The platform's supplier engagement workflow automates the collection of supplier emissions data, with templated data requests, automated follow-up sequences, and data quality scoring that helps EHS teams prioritise engagement with the highest-impact suppliers.
Spend-based and supplier-specific calculation
Automated supplier data collection workflow
Embodied carbon tracking for capital goods
What iFactory's AI ESG Module Delivers for Infrastructure EHS Teams
Beyond emissions tracking, iFactory provides the full ESG data infrastructure that EHS managers need to move from manual, annual, assurance-vulnerable reporting to continuous, automated, audit-ready sustainability intelligence. The platform connects every step of the ESG data lifecycle — from sensor reading to disclosure output — in a single, traceable, framework-aligned environment.
Automated Data Collection
From sensor to ESG metric without manual intervention
iFactory connects directly to building management systems, SCADA platforms, utility smart meters, IoT sensor networks, fleet telematics, fuel management systems, and waste contractor portals. Every energy reading, fuel consumption event, water usage data point, and waste disposal record is ingested automatically, timestamped, and mapped to the correct ESG category — eliminating the manual data extraction and consolidation work that currently consumes the majority of EHS reporting effort.
Multi-Framework Disclosure
One data platform, every reporting standard covered
The platform's ESG data model is pre-configured for CSRD, ISSB S1 and S2, GRI 301-308, TCFD, GRESB Infrastructure, SECR, and California SB 253 and SB 261. The same underlying operational data maps to each framework's specific metric definitions and calculation methodologies — so the EHS team does not rebuild the data for each reporting cycle. When a metric definition changes in any framework, the platform update is applied centrally and all historical data is recalculated automatically to maintain year-on-year comparability.
Anomaly Detection and Data Quality
AI-powered data validation before assurance review
The AI engine continuously monitors incoming data for anomalies — implausible readings, missing time periods, calculation methodology changes, and emission factor errors. Potential data quality issues are flagged to the EHS team with an explanation of the anomaly and a recommendation for investigation or correction. This proactive data quality management prevents the last-minute discovery of data issues during the assurance review period, reducing the risk of restatements and the cost of the assurance process.
Audit-Ready Traceability
Every ESG data point traceable to source with documented methodology
The platform maintains a full audit trail for every ESG data point — source system identifier, timestamp, ingestion method, calculation methodology, emission factor version, and any exceptions or estimates where direct measurement was unavailable. This audit trail is exportable in the format required by assurance providers, reducing the time and cost of the assurance review from weeks to days and eliminating the manual documentation burden that currently falls on sustainability teams.
Climate Scenario Analysis
Physical and transition risk modeling for forward-looking disclosure
iFactory's climate scenario engine models asset vulnerability to physical climate risks — flood, heat stress, storm intensity, and wildfire exposure — under 1.5 degree Celsius and 4 degree Celsius warming pathways. Transition risk is modeled through carbon pricing scenarios, regulatory cost projections, and stranded asset risk assessments. The scenario outputs are structured to satisfy the forward-looking disclosure requirements of ISSB S2, TCFD, and CSRD, giving EHS teams the analytical depth that investors and regulators increasingly demand.
Target Tracking and Performance Dashboards
Real-time visibility into progress against net zero and sustainability targets
The executive dashboard shows current emissions by scope, intensity metrics by asset class, progress against science-based reduction targets, and forecast trajectories based on current intervention programmes. EHS managers can see at a glance which assets and sites are on track to meet reduction commitments and which require additional intervention — enabling proactive management of sustainability performance rather than retrospective reporting of last year's numbers.
"
Before iFactory, our ESG reporting cycle ran for twelve weeks. We had four people manually extracting data from building management systems, utility portals, and fleet records, reconciling it in spreadsheets, applying emission factors from a separate database, and building the disclosure document framework by framework. The first time we ran the automated data ingestion across our portfolio, the platform captured more data points in one day than our team could process manually in a month. When the assurance provider asked for the source meter reading behind a specific emissions figure in our CSRD report, I showed them the audit trail in thirty seconds. That alone justified the platform investment.
— Head of EHS and Sustainability, Multi-Site Infrastructure Operations — 15 Years Environmental Management
Conclusion
The era of annual, manually compiled, spreadsheets-based ESG reporting is ending. Regulatory mandates under CSRD, California SB 253, ISSB, and GRESB now require continuous, auditable, third-party-assured sustainability data — and infrastructure operators who cannot deliver it face compliance risk, capital access constraints, and competitive disadvantage. The data that ESG reporting requires already exists within your infrastructure portfolio. It is in your building management systems, your utility meters, your fleet telematics, your procurement systems, and your asset registers. The question is whether you have the data infrastructure to collect it, verify it, and report it at the speed and quality that regulators and investors now demand.
iFactory's AI-powered ESG reporting and greenhouse gas tracking module connects directly to the operational systems that already generate your infrastructure data — and transforms scattered sensor readings, meter data, and operational records into audit-ready ESG disclosures aligned with every major reporting framework. With automated Scope 1, 2, and 3 tracking, multi-framework disclosure outputs, anomaly detection, climate scenario modeling, and full audit trail traceability, iFactory gives EHS managers the data infrastructure that turns ESG compliance from a manual burden into a continuously operating intelligence system. Book a Demo to see how the platform connects to your existing infrastructure data sources and generates your first audit-ready ESG disclosure, or talk to an expert about configuring AI-powered sustainability reporting for your organisation's specific portfolio and regulatory requirements.
Frequently Asked Questions
iFactory's ESG module is pre-configured with semantic data models for the Corporate Sustainability Reporting Directive and European Sustainability Reporting Standards, the International Sustainability Standards Board S1 and S2 standards, the Global Reporting Initiative indicators 301 through 308, the Task Force on Climate-Related Financial Disclosures recommendations, GRESB Infrastructure, the UK Streamlined Energy and Carbon Reporting framework, and California Senate Bills 253 and 261. The platform maps each data point from its operational source to the relevant metric definition in each framework — so the same underlying energy consumption, emissions, water usage, and waste data generates compliant disclosure outputs for every applicable regulation without manual recalculation or data restructuring. Talk to an expert to confirm framework support for your specific regulatory landscape and portfolio composition.
iFactory supports integration through REST APIs, standard IoT protocols such as MQTT and BACnet, file-based data exchange via CSV and XML, and direct database connectors for common BMS, SCADA, and CMMS platforms. During deployment, the implementation team maps each data source to the relevant ESG data category — energy, water, emissions, waste — and configures the ingestion frequency based on the data source's update cadence. Real-time data sources such as smart meters and IoT sensors can be ingested at sub-hourly intervals, while utility billing data and supplier records may be ingested on a daily or weekly cycle. The platform handles data from over 240 system connectors, and the integration architecture is designed to work with existing operational technology without requiring sensor replacement or system migration. Book a Demo to see a live integration walkthrough with systems similar to your portfolio.
iFactory supports a graduated approach to Scope 3 data quality. In the initial deployment, the platform calculates upstream emissions using environmentally extended input-output methodology with spend-based allocation and automated emission factor application — providing a complete Scope 3 figure from day one even where supplier-specific data is not yet available. As supplier emissions disclosures improve, the platform transitions individual supplier emissions to supplier-specific primary data on a prioritised basis, with a data quality score for each supplier that reflects whether the figure is based on audited disclosure, disclosed but unaudited data, industry average data, or spend-based estimation. The EHS team can see the Scope 3 data quality distribution across the supplier base and prioritise engagement with suppliers whose transition to primary data would have the largest impact on overall data quality. The methodology for each supplier emission figure is documented in the audit trail, so the assurance provider can see exactly which calculation methodology was used for each line item. Talk to an expert about configuring the Scope 3 data quality framework for your supply chain profile.
iFactory is designed to support both limited and reasonable assurance engagements under CSRD, California SB 253, and ISSB. The platform maintains a complete audit trail for every ESG data point, including source system identifier, ingestion timestamp, calculation methodology with version control, emission factor source and version, and any exceptions or estimates applied. The audit trail is exportable in the machine-readable format required by major assurance providers, enabling the assurance team to trace any reported figure back to its source data and calculation methodology in minutes rather than days. The platform also generates a data quality report for each ESG disclosure that identifies data coverage percentages, methodology distributions, and any gaps or estimates — providing the assurance provider with the transparency into data quality that the assurance standards require. EHS teams report that iFactory reduces the assurance process duration by 60 to 70 percent compared to manually compiled ESG data. Book a Demo to see the assurance readiness features in a live platform walkthrough.
For a typical infrastructure portfolio, iFactory's ESG module deployment follows a phased approach. Weeks one to two cover data source discovery, integration architecture design, and connection to priority data systems such as BMS, smart meters, and fleet telematics. Weeks three to five focus on GHG calculation methodology configuration, framework mapping, and validation against historical reporting data. Weeks six to eight are dedicated to dashboard configuration, anomaly detection tuning, and audit trail setup. Weeks nine to ten cover user training, scenario testing, and go-live with the first reporting cycle. The executive dashboard with real-time emissions tracking is typically available within the first thirty days. A full multi-framework ESG disclosure with audit trail is operational within ten weeks. For organisations with complex multi-site portfolios or limited existing data infrastructure, the implementation timeline is assessed during the data readiness workshop in the first week, with a detailed implementation plan delivered before deployment begins. Book a Demo to build the implementation plan specific to your portfolio size, data systems, and reporting deadlines.
Your Infrastructure Portfolio Generates the Data. The Question Is Whether You Can Report It.
iFactory's AI-powered ESG reporting and greenhouse gas tracking module — automated Scope 1, 2, and 3 tracking, multi-framework disclosure, anomaly detection, climate scenario analysis, and audit-ready traceability. The sustainability data infrastructure your portfolio needs to meet every regulatory deadline with confidence.