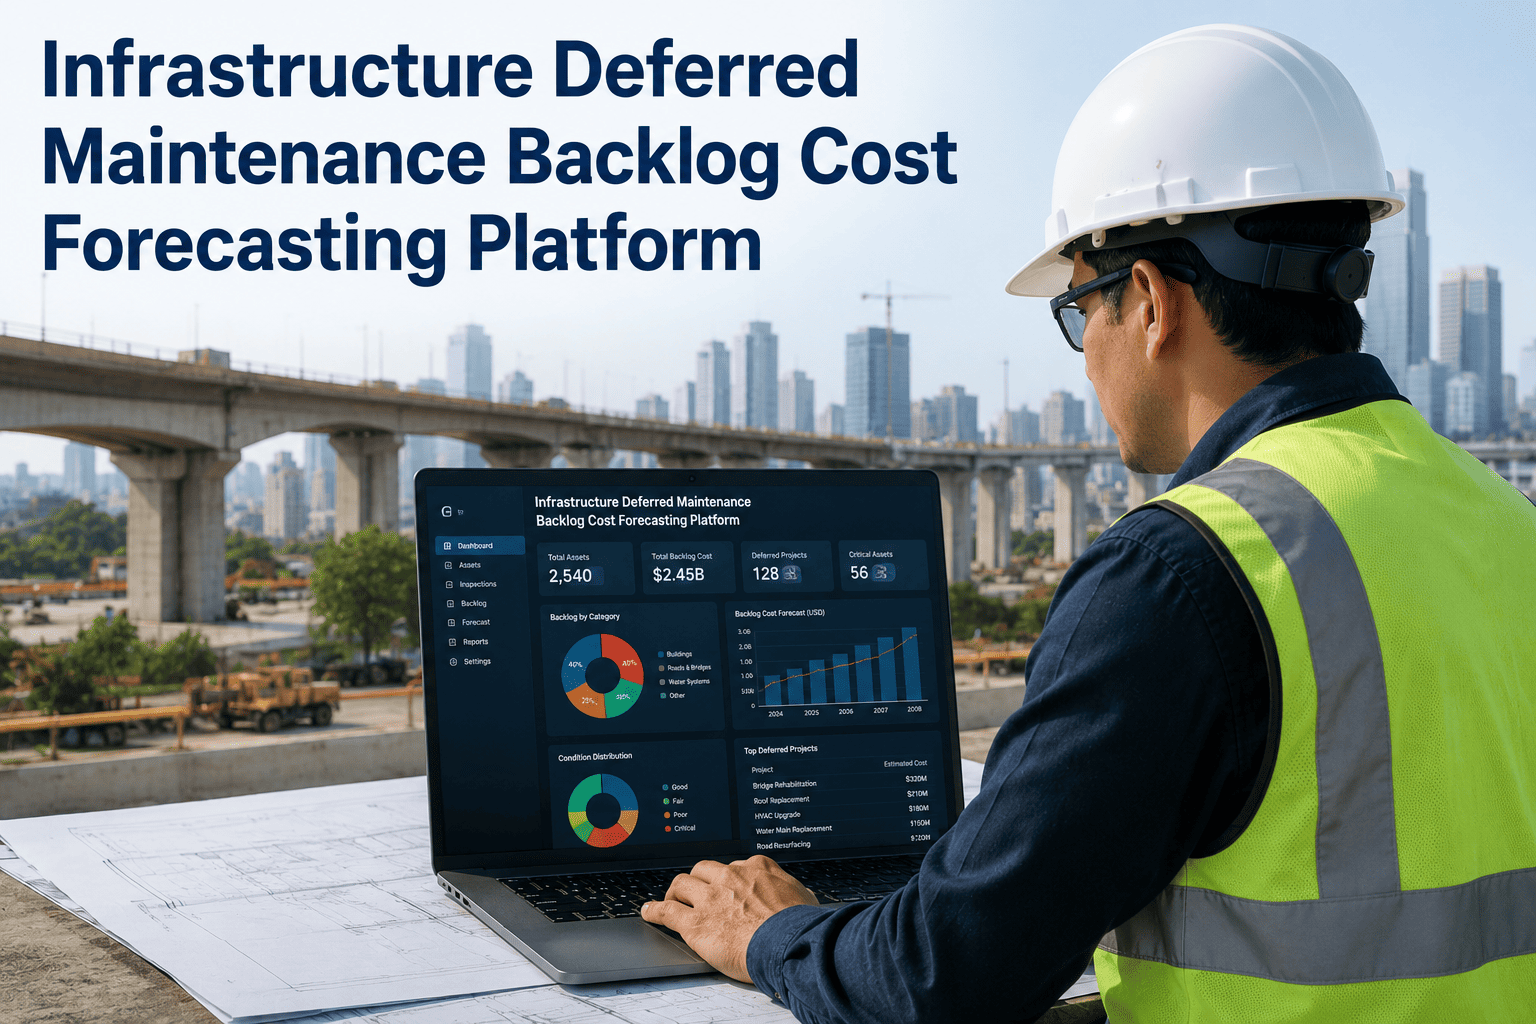
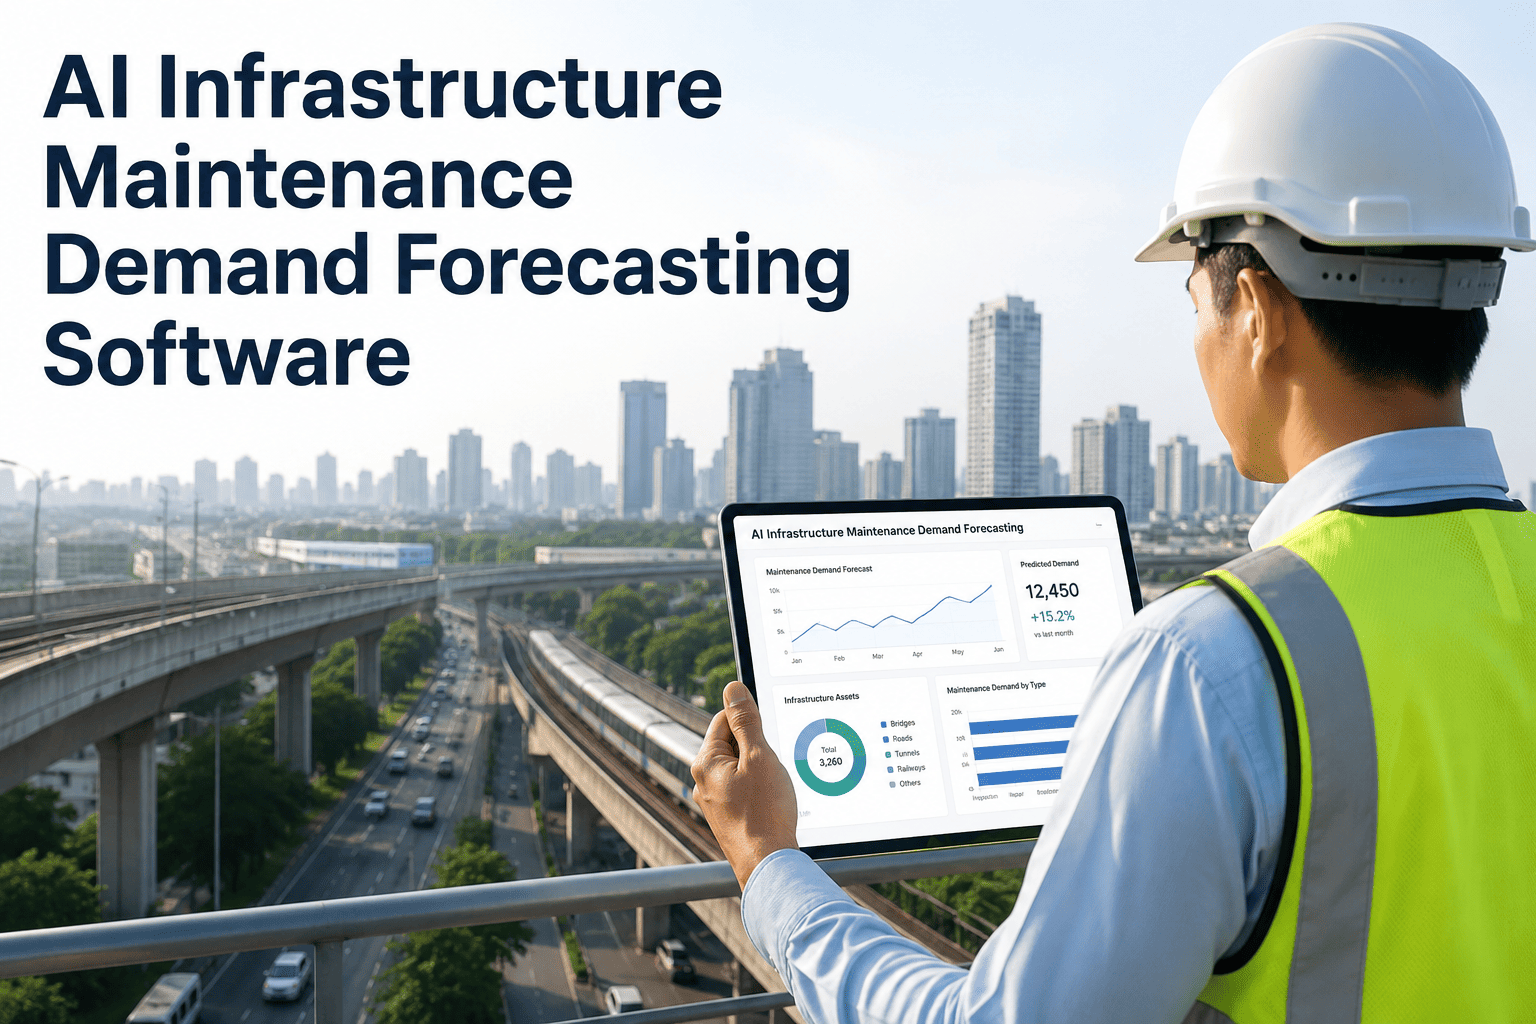
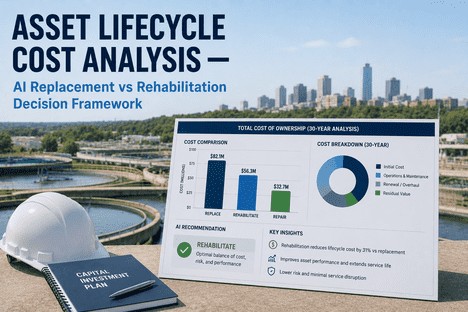
Deferred maintenance is not a line item on most infrastructure budgets, but it is quietly the largest liability on most infrastructure balance sheets. Every year that maintenance is postponed, the cost of eventually addressing the deterioration does not stay flat or grow linearly. It compounds, because a neglected asset does not simply stay in its current condition while waiting for attention. It continues to degrade, often accelerating once protective systems fail, and the repair required at the end of that waiting period can be many times what a timely intervention would have cost. Most organizations have no reliable way to quantify what this growing liability actually is, which means they cannot make informed decisions about how aggressively to fund catch-up efforts versus how to allocate limited maintenance budgets going forward. iFactory models your deferred maintenance backlog as a living, growing cost forecast rather than a static number, so you can see exactly what waiting costs you.
DEFERRED MAINTENANCE · COST FORECASTING · BACKLOG ANALYTICS
The Cost of Waiting Grows Faster Than You Think
Model your deferred maintenance backlog as a dynamic, compounding cost liability and make funding decisions based on what deferral actually costs in future dollars and risk exposure.
1x
Address Now
Scheduled maintenance cost
3x
Defer 2 Years
Extended repair required
7x
Defer 5 Years
Major rehabilitation needed
15x
Defer 10 Years
Full replacement likely
THE DETERIORATION CURVE
Why Deferred Maintenance Costs Do Not Grow Linearly
Infrastructure assets do not degrade at a constant rate. Most follow an S-curve or accelerating deterioration pattern where early-stage condition loss is gradual, then accelerates sharply once the asset passes a critical threshold. This means the cost curve of deferral is not a straight line climbing gradually. It is a curve that stays relatively flat for a period and then bends sharply upward, which is precisely why organizations that defer maintenance for a few years often find themselves facing costs that seem disproportionate to the time that passed. The asset did not simply get a little worse each year. It crossed a threshold where the type of intervention required changed entirely.
Stage 1
Minor Deterioration
Cost Multiplier: 1x
Asset is within its expected service life with minor surface or cosmetic issues. Scheduled maintenance or minor repair restores full function at standard cost.
Stage 2
Moderate Degradation
Cost Multiplier: 2-3x
Protective systems are compromised. Underlying structure is beginning to deteriorate. Repair scope expands and requires specialized materials or methods.
Stage 3
Advanced Deterioration
Cost Multiplier: 5-8x
Structural integrity is reduced. Asset is approaching or past design life. Rehabilitation requires significant engineering and extended service disruption.
Stage 4
Critical Failure Risk
Cost Multiplier: 10-15x
Asset is at elevated risk of unplanned failure with potential safety, environmental, or service continuity consequences. Emergency replacement may be required.
BACKLOG COMPOSITION
What Your Deferred Maintenance Backlog Actually Contains
A meaningful backlog forecast requires breaking the total number down by asset category, condition distribution, and urgency tier. Raw dollar totals without this breakdown are useless for decision-making because they cannot tell you where the most cost-sensitive deferrals are concentrated or which categories are driving the fastest growth. iFactory decomposes your backlog into its component parts so you can see exactly where the risk and cost concentration sits.
Water and Sewer Mains
22%
Buildings and Facilities
18%
Bridges and Structures
14%
Stormwater and Drainage
8%
FORECASTING METHODOLOGY
How iFactory Models Future Backlog Cost
Backlog cost forecasting is not a simple extrapolation of current repair estimates into future years with an inflation adjustment. It requires modeling how each asset will deteriorate over time, how the required intervention type will change as condition crosses thresholds, and how the cost of that intervention escalates as the scope expands. iFactory applies asset-specific deterioration curves derived from your condition data and industry benchmarks to project what each deferred item will cost if addressed at different points in the future, then aggregates those projections into a portfolio-level forecast.
01
Current Condition Baseline
Establish the current condition and remaining useful life for every asset with deferred maintenance using inspection data, monitoring systems, or estimated condition based on age and maintenance history.
02
Deterioration Curve Assignment
Apply asset-type-specific deterioration models that project condition at future time points, accounting for material type, environment, usage intensity, and maintenance history where available.
03
Intervention Threshold Mapping
Define the condition thresholds at which the required intervention changes from maintenance to rehabilitation to replacement, and map the cost jump that occurs at each transition.
04
Multi-Year Cost Projection
Calculate the estimated cost of addressing each deferred item at year 1, 3, 5, and 10, then aggregate into portfolio-level forecasts that show total backlog growth under different funding scenarios.
See What Your Backlog Will Cost in Five Years If You Do Nothing
iFactory takes your current deferred maintenance list and shows you the projected cost at future time points so you can make funding decisions based on real numbers instead of guesswork.
YEAR-BY-YEAR FORECAST
Projected Backlog Growth Under Different Funding Scenarios
The value of a backlog forecast is not a single number but the ability to compare what happens under different funding levels. If you fund maintenance at current levels, the backlog grows because current funding does not cover the full maintenance need. If you increase funding, the backlog shrinks but may take years to eliminate depending on how far behind you are. iFactory models multiple scenarios simultaneously so you can see the trajectory, not just the snapshot.
| Year |
No Increase |
25% Increase |
50% Increase |
Full Funding |
| Current |
$48M |
$48M |
$48M |
$48M |
| Year 1 |
$54M |
$51M |
$47M |
$38M |
| Year 3 |
$71M |
$58M |
$44M |
$14M |
| Year 5 |
$96M |
$64M |
$38M |
$0M |
| Year 10 |
$184M |
$78M |
$22M |
$0M |
Projections based on sample portfolio with 3.5% annual deterioration acceleration factor. Your actual forecast will be generated from your asset data and condition baseline.
CATCH-UP VS STEADY STATE
The Fundamental Trade-Off in Backlog Reduction Strategy
Organizations with significant deferred maintenance backlogs face a structural decision that has no easy answer. They can fund at a higher level temporarily to reduce the backlog, which requires sustained political or budgetary commitment over multiple years. Or they can fund at a level that maintains current assets and prevents the backlog from growing further, which means accepting that the existing backlog will persist indefinitely. Neither approach is wrong, but each has very different cost trajectories and risk profiles, and the choice should be made with full visibility into what each path actually costs over time.
Fund above steady-state for a defined period to actively reduce the backlog before returning to maintenance-level funding.
Higher short-term annual costs
Backlog reduces over 5-10 years
Risk decreases as backlog shrinks
Requires sustained budget commitment
Lower total cost of ownership long-term
Fund at a level that covers current maintenance needs but does not address existing backlog, accepting the liability as permanent.
Lower predictable annual costs
Backlog remains constant or grows slowly
Risk remains elevated indefinitely
Easier to sustain politically
Higher total cost due to ongoing escalation
GROWTH DRIVERS
What Causes Deferred Maintenance Backlogs to Grow
Understanding why backlogs grow is essential to forecasting because different drivers create different growth trajectories. A backlog driven primarily by age-related deterioration grows at a relatively predictable rate. A backlog driven by chronic underfunding grows faster because new deferrals are added every budget cycle on top of the existing deterioration. Most real-world backlogs are driven by a combination of factors, and iFactory models each driver separately so the forecast reflects the actual dynamics of your situation rather than a single assumed growth rate.
Annual Funding Shortfall
The gap between what maintenance actually costs each year and what gets funded is the primary direct driver. Every unfunded dollar of maintenance need adds to the backlog and begins its own deterioration clock.
High Impact
Asset Aging Concentration
When a large portion of your infrastructure was installed in the same era, it reaches end-of-life simultaneously, creating a bulge in the backlog that grows faster than linear projections suggest.
High Impact
Deterioration Acceleration
Assets in poor condition degrade faster than assets in good condition because secondary damage accelerates once protective systems fail, creating compounding cost growth within the existing backlog.
Medium Impact
Scope Expansion at Repair Time
When deferred items are finally addressed, the actual repair cost often exceeds the original estimate because additional damage was discovered during the work, adding unanticipated cost to the backlog reduction effort.
Medium Impact
New Asset Addition Without Lifecycle Budget
Adding new infrastructure without establishing a corresponding maintenance and replacement reserve ensures that today's new assets become tomorrow's deferred maintenance entries.
Medium Impact
Inflation and Construction Cost Escalation
Infrastructure construction and repair costs consistently outpace general inflation, meaning the real cost of addressing a fixed backlog grows even if no new deferrals are added.
Low Impact
RISK QUANTIFICATION
The Hidden Risk Cost That Does Not Appear in Repair Estimates
Deferred maintenance cost forecasts typically focus on the direct repair or replacement cost of addressing each deferred item. But deferred maintenance also carries an implicit risk cost that comes from the elevated probability of unplanned failures, emergency repairs, service disruptions, and potential liability events. This risk cost is real and measurable even though it never appears on a project estimate. iFactory quantifies the risk premium embedded in your backlog by modeling the probability distribution of failure for each deferred asset and the expected cost of failure-mode consequences.
Safety and Liability Risk
Probability of injury or property damage from unplanned asset failure, including potential legal liability, regulatory penalties, and settlement costs that far exceed the repair cost itself.
Service Continuity Risk
Cost of emergency service disruption including temporary infrastructure, customer credits, emergency contracting premiums, and reputational damage from extended outages.
Environmental Compliance Risk
Potential environmental release costs, remediation expenses, regulatory fines, and consent decree obligations that can result from failure of containment or treatment infrastructure.
FREQUENTLY ASKED QUESTIONS
Questions Asset Managers and Finance Teams Ask First
How accurate can a deferred maintenance cost forecast actually be when we do not have perfect condition data for every asset?
The forecast accuracy is directly related to the quality and coverage of your condition data, but iFactory is designed to produce useful forecasts even with incomplete data by applying statistical methods that account for uncertainty. For assets with current inspection or monitoring data, the forecast uses asset-specific deterioration curves. For assets where only age and type are known, the system applies industry-standard deterioration models with confidence intervals that widen to reflect the higher uncertainty. The result is a forecast that clearly distinguishes between high-confidence and low-confidence portions of the backlog, which is more useful for decision-making than a single number that implies false precision. As your condition data improves over time, the confidence intervals automatically narrow.
Book a demo to see how your current data translates into a forecast.
What is the difference between a backlog estimate and a backlog forecast, and why does the distinction matter?
A backlog estimate is a static snapshot that answers the question of what it would cost to address all deferred maintenance today if you had unlimited resources. A backlog forecast is a dynamic projection that answers the question of what the backlog will cost at future points in time under different funding scenarios. The distinction matters because the estimate tells you nothing about urgency or the cost of waiting, while the forecast shows you exactly how much more expensive the problem becomes each year you delay action. For budget planning and grant justification, the forecast is far more valuable because it provides the basis for arguing that increased funding now avoids much larger costs later.
Contact our support team to discuss how forecasts support your budget process.
Can the forecast model different funding scenarios like a bond issue versus annual budget increases?
Yes, iFactory supports multiple scenario modeling including lump-sum injections like bond proceeds or grant awards, sustained annual funding increases, phased catch-up programs that reduce funding after a target year, and any combination of these approaches. Each scenario produces a complete year-by-year projection of backlog size, annual funding requirement, and cumulative cost, so you can compare the total cost of ownership across strategies rather than just looking at annual cash flow. This is particularly valuable when evaluating whether a large bond issue that eliminates the backlog faster actually costs less in total than a smaller annual increase that takes longer but avoids debt service costs.
Book a demo to model your specific funding scenarios.
How does this integrate with our existing asset management system or CMMS?
iFactory connects to your existing asset management system or CMMS to pull the work order history, condition assessment data, and asset registry information needed to build the forecast. The system does not replace your existing platform but adds a forecasting and analytics layer on top of it that your current system likely does not provide. Integration typically uses standard data exchange formats and APIs, and the connection can be configured to pull updated data on a scheduled basis so the forecast reflects your most current asset information. The output can also be pushed back to your systems in formats that support your existing reporting and budget workflows.
Contact our support team to discuss integration with your specific systems.
How do we use the forecast output in a grant application or bond offering document?
The forecast output is structured to support the specific evidence requirements of both grant applications and bond offering statements. For grants, iFactory generates condition-based justification that demonstrates the cost consequence of continued deferral, which directly addresses the lifecycle cost analysis criteria that most federal and state programs require. For bond offerings, the forecast provides the basis for deferred maintenance disclosure statements and can produce the multi-year projections that rating agencies and bond counsel expect to see in official statements. The key advantage is that every number in the forecast is traceable back to underlying asset data, which means you can support the projections with evidence if questioned during review.
Book a demo to see the grant and bond output formats.
Stop Guessing What Your Deferred Maintenance Will Cost Next Year
Your backlog is growing whether you measure it or not. iFactory gives you the forecast to quantify exactly what that growth means in dollars and risk, so you can make funding decisions with real evidence behind them.