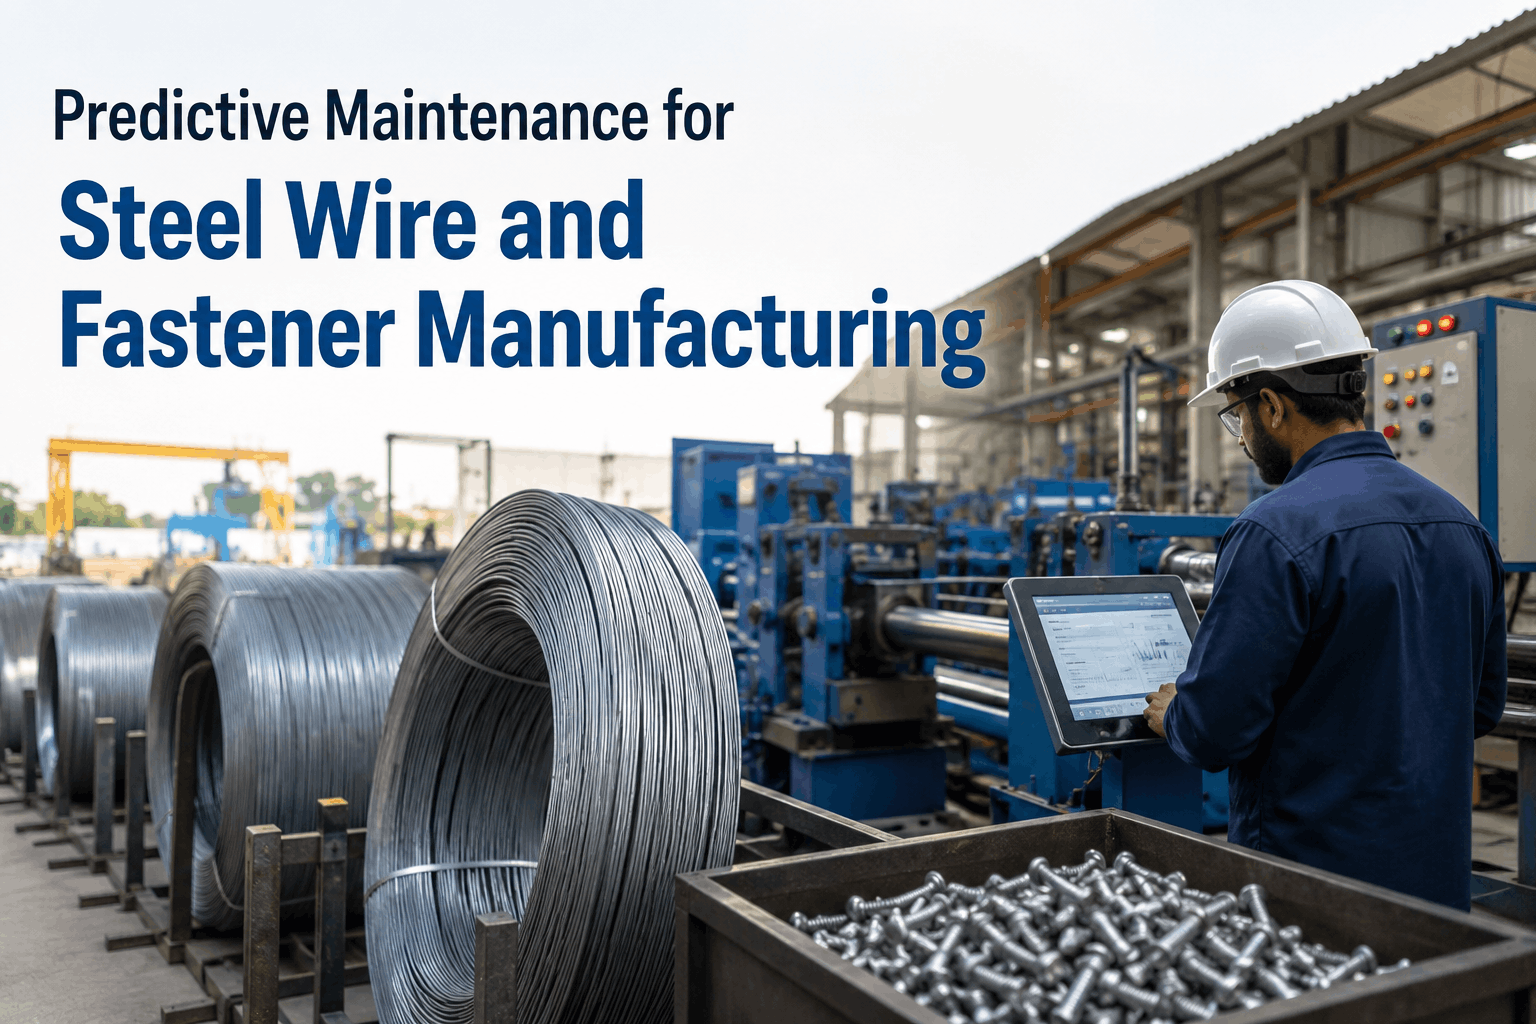
AI monitors wire drawing machines, heading machines, and heat treatment furnaces in steel wire and fastener manufacturing — detecting die wear progression, dimensional drift, and equipment defects before they cause scrap generation, die failures, or unplanned production stoppages. Start Trial Free to see how iFactory gives wire and fastener manufacturers the process-trend and equipment-health monitoring needed to maintain dimensional accuracy and prevent die failures across continuous production runs.
Prevent Die Failures and Dimensional Drift Before They Generate Scrap
iFactory monitors drawing force trends, die wear indicators, heading machine vibration, and furnace temperature uniformity — giving quality and maintenance teams early warning of developing equipment problems before they affect product dimensions or cause unplanned stoppages.
Why Wire and Fastener Manufacturing Demands Process-Linked Predictive Maintenance
In wire drawing and fastener manufacturing, equipment condition and product quality are inseparably linked — a worn die changes wire diameter and surface finish before it fails catastrophically, a heading machine with worn tooling holders produces fastener heads outside dimensional specification, and a furnace with non-uniform temperature distribution produces wire or blanks with inconsistent mechanical properties that fail thread rolling or torque testing downstream. Predictive maintenance in this environment must monitor equipment health and process performance simultaneously — tracking drawing force trends as die wear indicators, monitoring machine vibration as mechanical condition indicators, and correlating furnace temperature uniformity with downstream product quality outcomes. Engineering teams that Book a Demo with iFactory see how process-linked monitoring changes scrap rates and die replacement scheduling in continuous wire and fastener production.
-
Wire Drawing Force Trend Monitoring
iFactory tracks drawing force per pass across the drawing machine block sequence — detecting the progressive force increase that indicates die wear, lubricant breakdown, or rod surface condition deterioration before wire breaks or die fracture occurs.
-
Die Wear Progression Detection
iFactory correlates drawing force trends with tonnage counters and surface finish measurements to build die wear models per die position and wire grade — predicting die replacement timing before dimensional tolerance exceedance forces unplanned die change stoppages.
-
Heading Machine Vibration Analysis
iFactory analyzes heading machine vibration signatures at forming frequency harmonics — detecting worn tooling holders, crankshaft bearing defects, and feed mechanism wear that produce dimensional variation in fastener head geometry before visible quality exceedance.
-
Thread Rolling Machine Monitoring
iFactory monitors thread rolling die contact forces, machine vibration at rolling frequency, and die holder condition — identifying die wear and holder deterioration that cause thread form deviation and gauge rejection before inspection detection.
-
Heat Treatment Furnace Uniformity Tracking
iFactory tracks temperature uniformity indices across annealing and patenting furnace thermocouple arrays — detecting burner failures, zone control drift, and muffle deterioration before they produce wire with non-uniform mechanical properties that fails downstream process steps.
-
Payoff and Take-up Reel Tension Monitoring
iFactory monitors payoff brake tension and take-up tension uniformity — detecting tension variation that causes wire breaks at high drawing speeds, or coil packing defects that generate secondary damage during transportation and handling.
Critical Failure Modes in Wire and Fastener Production: AI Detection Strategies
-
Drawing Force Trend Analysis: Die Wear Detection Before Wire Break
Highest Production ImpactWire drawing force is the most direct process indicator of die condition — a die with normal bearing wear shows a gradual, predictable force increase as the bearing length grows; a die with nib cracking or plug displacement shows an irregular force spike that precedes fracture. iFactory monitors drawing force per block position in real time, building a wear model for each die from force-tonnage history at that position and wire grade combination. When the force trend deviates from the expected wear model — either by accelerating faster than predicted or by showing irregular step changes — iFactory alerts the drawing room supervisor to inspect the suspect die position before the problem progresses to a wire break that requires rethreading time and potentially causes die fracture damage to the block capstan. Teams that Start Trial can connect iFactory to existing drawing machine PLC data for immediate force trend monitoring on priority wire grades.
Data Source
Drawing machine motor current or load cell per block position
Detection Signal
Force deviation from expected wear model at current tonnage
iFactory Record
Force-tonnage history per die position and wire grade
-
Heading Machine Crankshaft and Tooling Holder Vibration Analysis
Dimensional Quality DriverCold heading machines operate at forming rates of 50 to 400 strokes per minute — imposing high impulsive loading on crankshaft bearings, tooling holder clamping systems, and die block alignment components at each stroke. Wear in crankshaft bearings produces elevated vibration at crankshaft rotational frequency and its harmonics; tooling holder wear introduces increased play that appears as impulsive content at forming frequency with irregular phase. iFactory analyzes heading machine vibration at forming frequency harmonics and applies envelope demodulation for bearing defect detection — identifying crankshaft bearing wear and tooling holder deterioration early enough to schedule maintenance during a planned die change rather than responding to a forming force spike that causes fastener head cracking or dimensional rejection. Teams that Book a Demo can review heading machine vibration monitoring configuration for specific machine rates and fastener geometries.
Vibration Features
Forming frequency harmonics, envelope demodulation for bearing defects
Fault Indicators
Crankshaft bearing wear, tooling holder play, die block misalignment
iFactory Record
Vibration trend at forming harmonics per machine and tooling set
-
Furnace Temperature Uniformity: Downstream Quality Prevention
Quality Upstream AssetWire annealing and patenting furnaces produce the metallurgical condition that determines whether the wire can achieve the required tensile strength and ductility after final drawing — and non-uniform temperature distribution produces coils with variable properties that pass visual inspection but fail torque, tensile, or bend tests during fastener inspection. iFactory monitors furnace temperature uniformity from the installed thermocouple array — computing uniformity indices per zone, tracking inter-zone temperature gradient trends, and correlating furnace performance anomalies with subsequent wire mechanical test results. Connecting furnace temperature data to downstream mechanical test outcomes in iFactory enables maintenance to quantify the quality cost of furnace performance degradation — providing the financial justification for burner maintenance or control system calibration that pure maintenance cost accounting cannot capture.
Monitored Parameter
Zone temperature uniformity index from thermocouple array
Quality Link
Uniformity deviation correlated to downstream mechanical test variation
iFactory Record
Furnace uniformity trend correlated to mechanical test outcomes
-
Lubricant System Degradation: Drawing Box Chemistry Monitoring
Process Consumable ConditionWet drawing lubricant condition directly affects die life and wire surface finish — a lubricant that has degraded in concentration, pH, or contamination level fails to maintain the film between wire and die bearing that prevents adhesive wear and overheating. iFactory integrates drawing lubricant quality measurement data — conductivity as a concentration proxy, pH as a degradation indicator, temperature as a heat load indicator — with drawing force trends to distinguish lubricant-driven force increases from die wear-driven increases. When drawing force rises with concurrent lubricant condition anomaly, iFactory identifies the lubricant as the probable cause — directing the operator to check concentration and replenishment rather than scheduling a die change that would not address the root cause of the force increase.
Chemistry Inputs
Lubricant conductivity, pH, temperature, and replenishment records
Combined Diagnosis
Force rise with lubricant anomaly distinguishes lube from die cause
iFactory Record
Lubricant quality trend correlated to drawing force per machine
-
Thread Rolling Die Wear and Holder Condition Monitoring
Final Process QualityThread rolling is the final forming operation that determines whether a fastener meets thread gauge requirements — and die wear in thread rolling is more abrupt than in wire drawing, with thread form accuracy maintained well until the die surface condition degrades to a point where gauge rejection rate increases rapidly. iFactory monitors thread rolling machine vibration at rolling die contact frequency, tracks rolling force and forming torque trends, and correlates gauge rejection rate data with die cycle counts and machine condition indicators — building a die replacement model that predicts the gauge rejection onset point. For critical fastener applications requiring 100% gauge inspection, iFactory can receive SPC data from automated thread gauging systems and correlate gauge trend shifts with concurrent machine condition changes to identify the mechanical root cause of developing quality problems.
Monitored Parameters
Rolling vibration, forming torque, gauge rejection rate vs die cycles
SPC Integration
Automated gauge data correlated to machine condition indicators
iFactory Record
Die wear model per die set with rejection onset prediction
-
Straightening and Pointing Machine Roller Wear Detection
Feed System AssetWire straighteners and pointer units that prepare rod or drawn wire for heading feed condition the material geometry that heading tooling operates on — and roller wear in straighteners produces residual camber in the feed wire that causes misfeeds, double feeds, and fastener head eccentricity in the heading machine. iFactory monitors straightener and pointer machine vibration at roller rotation frequencies — detecting bearing wear and eccentric roller wear that produce periodic feed variation at heading frequency. Connecting straightener condition data to heading machine dimensional rejection rate in iFactory enables maintenance to identify straightener deterioration as a heading quality root cause before the problem is misdiagnosed as heading tooling wear. Teams that Start Trial can configure straightener monitoring alongside heading machine analysis for complete feed-to-form condition tracking.
Vibration Target
Roller rotation frequency and bearing defect frequencies
Quality Link
Straightener condition correlated to heading dimensional rejection
iFactory Record
Straightener vibration trend linked to downstream heading rejection rate
Wire and Fastener Production Predictive Maintenance Performance Indicators
Die Failure Warning Lead Time
AI force trend analysis with die wear modelling provides 7 days of die failure warning — versus zero lead time for wire break alarms that trigger only after the die has already failed catastrophically.
Scrap Rate Reduction by Failure Mode
Scrap reduction vs pre-monitoring baseline
AI monitoring reduces scrap from die wear failures by 68% and heading machine defects by 54% — the two highest-cost scrap categories in wire and fastener production programs.
Die Life Extension from Predictive Change
Predictive die change timing based on actual wear model output extends average die service life 30% versus fixed tonnage interval replacement — reducing die inventory cost and procurement frequency.
Unplanned Stoppage Reduction Over Time
Wire drawing unplanned stoppages decline from 14 per quarter to 2 by quarter 5 as AI die wear models accumulate equipment-specific history and improve replacement timing prediction.
Wire and Fastener Production Asset Monitoring: Reference Specifications
Scroll for more
| Production Asset | Primary Failure Mode | Detection Method | iFactory Data Source | Alert Lead Time |
|---|---|---|---|---|
| Wire Drawing Die | Die wear, nib cracking | Drawing force trend vs wear model | Motor current or load cell per block | 3–7 days |
| Heading Machine | Crankshaft bearing, tooling holder wear | Forming frequency vibration + envelope | Machine frame accelerometers | 7–21 days |
| Annealing Furnace | Temperature non-uniformity | Zone uniformity index from TC array | Furnace temperature historian | Per batch preventive |
| Thread Rolling Machine | Die wear, holder deterioration | Rolling vibration + gauge SPC correlation | Machine vibration + gauge data | 5–14 days |
| Wire Straightener | Roller wear, bearing failure | Roller frequency vibration analysis | Straightener vibration | 7–21 days |
How iFactory Supports Wire and Fastener Manufacturing Reliability
Wire and fastener manufacturing reliability cannot be separated from process quality — a die that is allowed to wear past the dimensional tolerance boundary generates scrap that cannot be recovered, and a furnace that runs with non-uniform temperature produces wire whose quality deficiency only becomes visible two or three process steps later. iFactory addresses this by connecting equipment condition monitoring to process performance indicators in a single platform: drawing force trends linked to die wear models, heading machine vibration linked to dimensional rejection rates, furnace temperature uniformity linked to downstream mechanical test results. When iFactory predicts that the finishing die on Line 4 will reach the dimensional tolerance boundary in four days at the current wear rate — based on the force-tonnage model for that die grade and coating type — the drawing room supervisor has the information to plan a die change at the next scheduled coil break rather than discovering the dimensional exceedance when the gauge reject light activates. Facilities can Start Trial and begin drawing force trend monitoring on priority wire grades using existing machine PLC data within the first iFactory configuration session.
Drawing Force and Wear Modelling
iFactory tracks drawing force per block position and builds die wear models from force-tonnage history — predicting dimensional tolerance exceedance timing to enable planned die changes that eliminate unplanned wire breaks and scrap generation.
Heading and Rolling Machine Vibration
iFactory analyzes heading machine and thread rolling vibration at forming and rolling frequencies — detecting crankshaft bearing wear and tooling holder deterioration before they cause dimensional rejection exceedances in fastener production.
Furnace Uniformity and Quality Correlation
iFactory monitors annealing and patenting furnace temperature uniformity and correlates deviations with downstream mechanical test outcomes — quantifying the quality cost of furnace performance degradation in measurable scrap and rejection terms.
Process-to-Quality Data Integration
iFactory connects equipment condition indicators — die wear, machine vibration, furnace uniformity — with quality outcomes — gauge rejection, tensile test variation, surface finish grades — enabling root cause identification across the full production sequence.
Deploying Predictive Maintenance in Wire and Fastener Production: Implementation Steps
01
Map Equipment to Process and Quality Outcomes
Identify which drawing lines, heading machines, and furnaces contribute most to scrap cost and unplanned stoppage time — establishing the priority monitoring deployment sequence based on quality and production impact rather than equipment replacement cost alone.
02
Connect Drawing Machine PLC Data to iFactory
Configure iFactory integration with drawing machine PLCs to receive motor current or load cell data per block position — establishing the drawing force data stream that die wear trend monitoring and force-tonnage model building require.
03
Install Heading and Rolling Machine Vibration Sensors
Confirm accelerometer placement on heading machine frames and thread rolling units at positions that capture forming frequency vibration — supplementing existing instrumentation where machine access permits the additional measurement points needed for bearing and tooling analysis.
04
Build Die Wear Reference Models per Grade
Collect drawing force and tonnage data across a minimum of three die campaigns per wire grade and die position in iFactory — building the force-tonnage wear reference models that predictive die change timing requires for each production combination.
05
Integrate Quality Data Feeds into iFactory
Connect gauge inspection results, tensile test data, and surface finish records to iFactory — enabling the correlation between equipment condition indicators and quality outcomes that identifies the mechanical root cause of developing quality problems before they generate scrap.
06
Review Die Wear Models and Alert Thresholds Quarterly
Update iFactory die wear models quarterly as force-tonnage history accumulates — refining dimensional exceedance prediction timing and adjusting alert thresholds based on validated prediction accuracy against actual die change and rejection data. Book a Demo to see the full wire and fastener production deployment workflow.
Frequently Asked Questions
How does iFactory predict wire drawing die failure timing?
iFactory builds a force-tonnage wear model for each die position and wire grade from historical drawing force and accumulated tonnage data — identifying when the current force trend deviates from the expected wear model and projecting the tonnage at which dimensional tolerance exceedance will occur based on the deviation rate.
What data does iFactory require from drawing machines for die wear monitoring?
iFactory requires drawing force data per block position — available as motor current from VFD feedback or load cell measurement — and accumulated tonnage or coil count from the machine PLC. Surface finish measurement data from inline gauges improves die condition assessment accuracy when available.
Can iFactory monitor both wet and dry wire drawing processes?
Yes. iFactory monitors both wet and dry drawing processes, with separate die wear model configurations for each. For wet drawing, lubricant chemistry data is incorporated as a co-variable in the force-tonnage model — enabling discrimination between lubricant-driven and die-wear-driven force increases that have different corrective actions.
How does heading machine vibration monitoring connect to dimensional quality?
iFactory correlates heading machine vibration trends at forming frequency with concurrent dimensional inspection rejection data — identifying the vibration threshold levels above which rejection rates increase for specific fastener geometries. This correlation calibrates alert thresholds to the quality impact level for each machine and product combination.
Can iFactory integrate with SPC systems for fastener quality monitoring?
Yes. iFactory accepts SPC data from automated gauge inspection systems — correlating gauge trend shifts with concurrent machine condition indicators to identify the mechanical root cause of developing quality problems before they reach the rejection threshold that triggers a production stoppage.
Predict Die Failures and Maintain Dimensional Accuracy Across Every Production Run
iFactory gives wire and fastener manufacturers the drawing force trend modelling, heading machine vibration analysis, and furnace uniformity monitoring needed to prevent die failures, reduce scrap generation, and maintain dimensional accuracy — turning unplanned production stoppages into scheduled maintenance interventions.