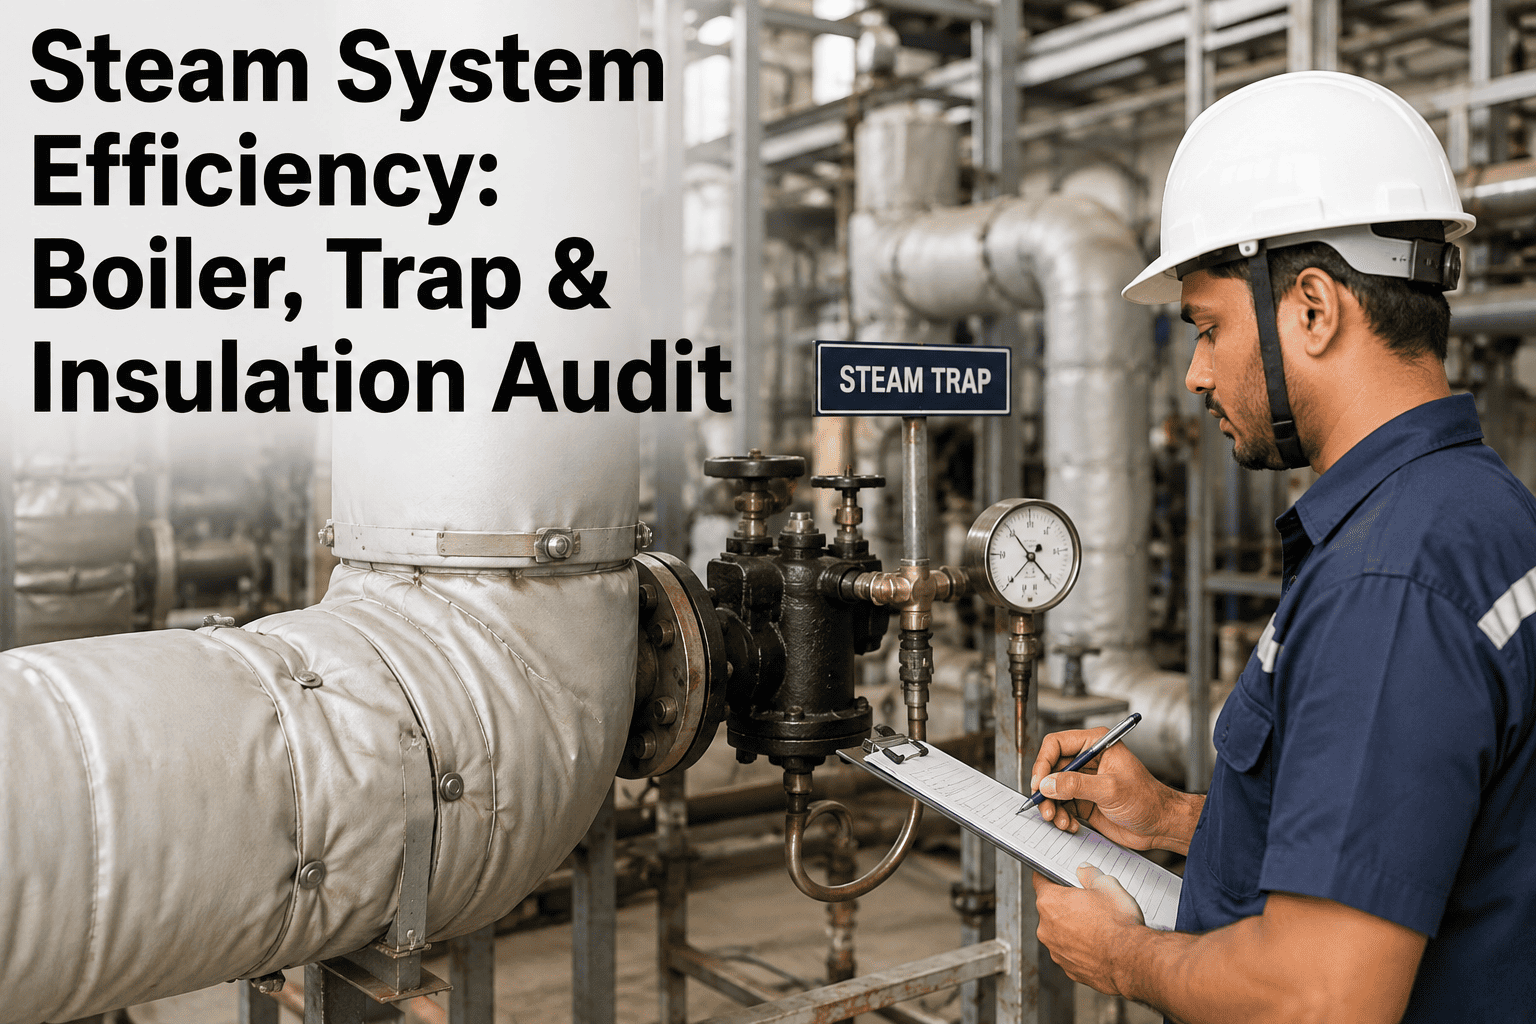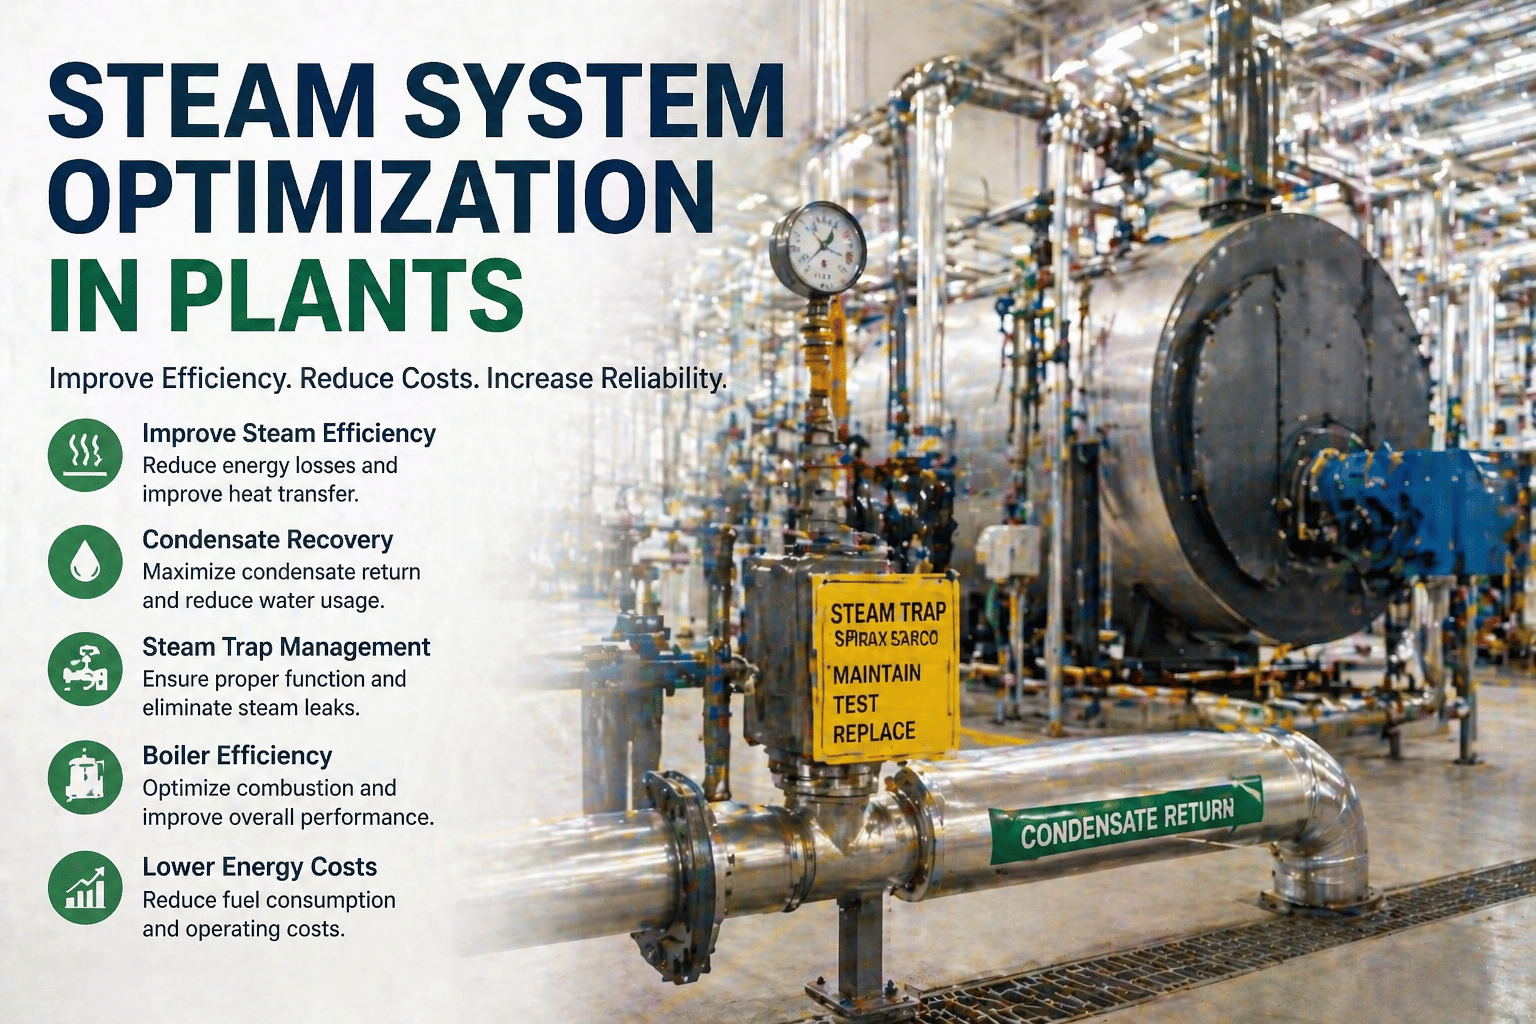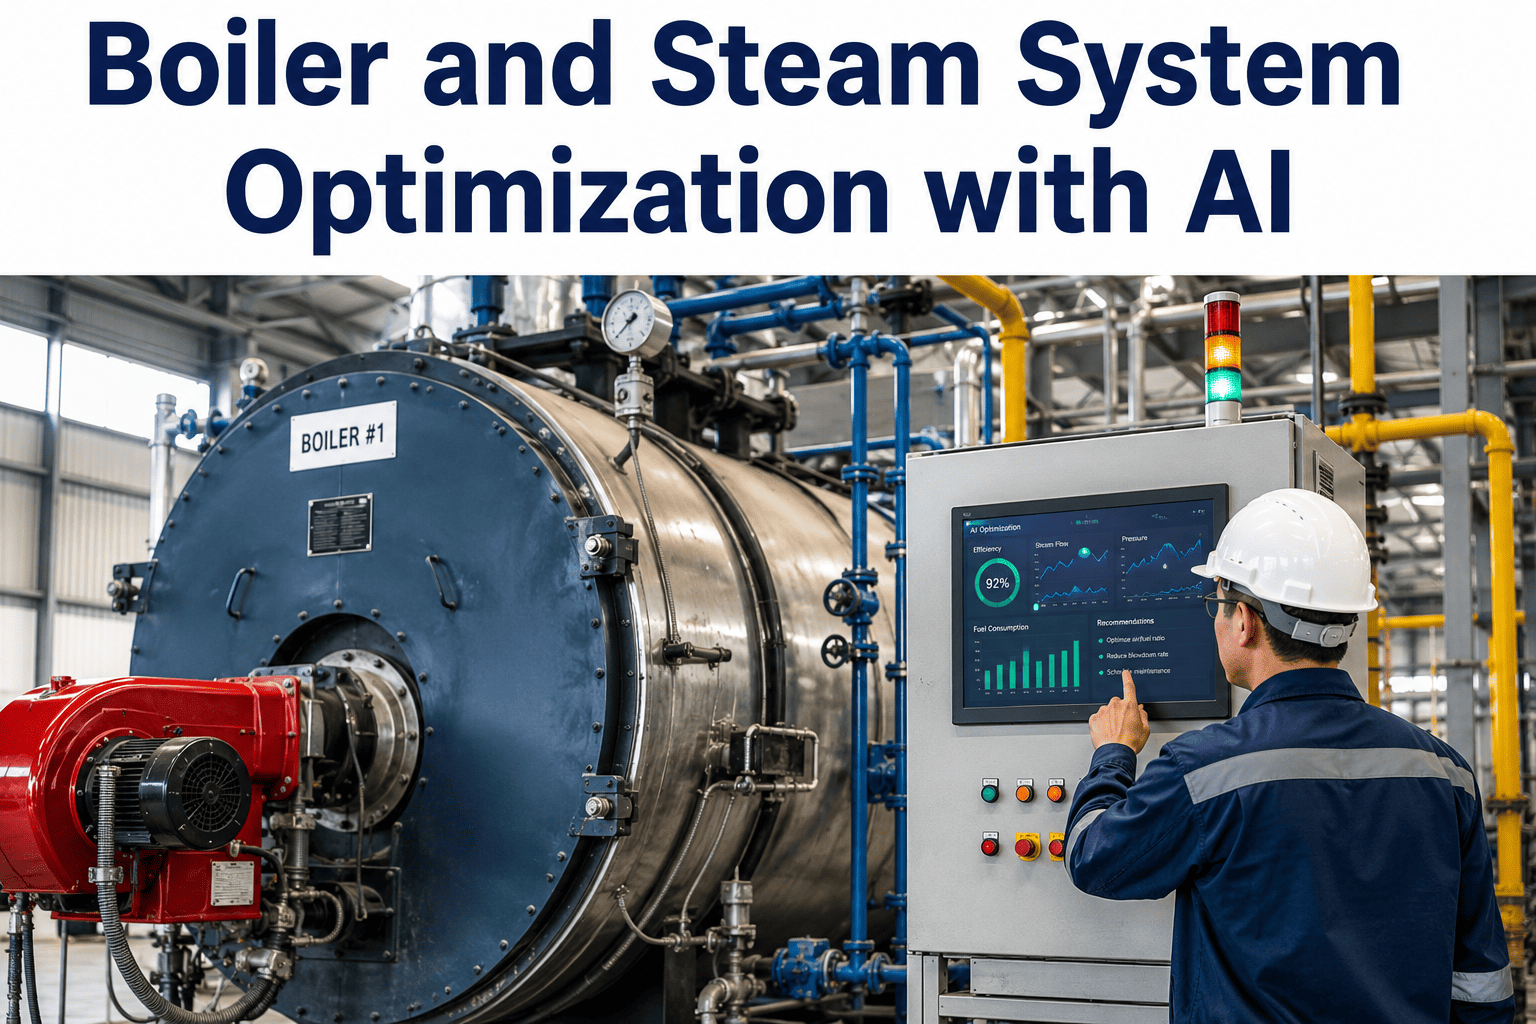
Boilers and steam distribution systems are among the largest single energy consumers in a process plant, yet they get a fraction of the attention paid to production lines. A steam system that looks fine on paper can still be losing well over a third of its input energy to flue gas heat, blowdown, and distribution leaks that nobody is watching in real time. Combustion gets tuned once during commissioning and rarely revisited as fuel quality, ambient temperature, and load patterns drift over months of running. Steam traps fail open or shut without an alarm, condensate return goes unmeasured, and the plant keeps paying to boil water that never reaches a process. iFactory's AI platform reads combustion, distribution, and condensate data continuously so these losses surface in days rather than years, and you can book a demo to see it running against your own boiler house numbers.
Your Boiler Burns 100 Units of Fuel. Here Is Where They Actually Go
Industry benchmarking of steam systems consistently shows average thermal cycle efficiency sitting near the mid-fifties percent range, meaning a large share of every fuel dollar never becomes usable steam. iFactory's AI platform maps that loss by source and closes it automatically.
Four Places a Steam System Loses Money Without Anyone Noticing
None of these losses show up as a single alarm on the control room screen. Each one develops slowly, hides inside a normal-looking pressure and temperature reading, and only becomes visible once someone goes looking for it with dedicated instrumentation, which most plants do once a year at best. By the time a survey catches a problem, it has usually been running unnoticed for months.
What Excess Air Looks Like When Nobody Is Adjusting It
Combustion efficiency depends on holding the right amount of excess air: too little and carbon monoxide climbs along with the risk of incomplete combustion, too much and the boiler simply heats extra nitrogen and vents it up the stack. Manual tuning captures one snapshot; loads and fuel conditions keep moving after that snapshot is taken.
The Trap Population Nobody Has Time to Walk Every Week
A typical process plant has steam traps numbering in the hundreds, spread across a site that a survey crew can only physically walk a few times a year. Between those manual surveys, failures accumulate quietly and the plant simply pays for the steam that leaks through.
| Failure Mode | What Typically Happens | Detection Without AI |
|---|---|---|
| Failed Open | Live steam blows through continuously into the condensate line, wasting steam around the clock | Found only during the next scheduled ultrasonic or thermal trap survey |
| Failed Closed | Condensate backs up, causing waterlogging, reduced heat transfer, and freeze risk in cold weather | Usually noticed only after a process temperature complaint |
| Partial Leak | Small continuous steam loss that is too subtle for a hand check but adds up over months | Rarely caught outside of a dedicated acoustic survey |
| Undersized or Oversized | Trap cycles incorrectly for the actual condensate load, wasting steam or backing up condensate | Typically only found during a full engineering review |
Stop Waiting for the Annual Steam Survey to Find What Is Already Leaking
iFactory's AI platform monitors combustion, trap health, and condensate return continuously instead of once a year, flagging losses while they are still small enough to fix on the next shift.
Five Ways iFactory Keeps a Steam System Tuned Between Surveys
Rather than replacing the instrumentation already on a boiler, iFactory's platform reads existing combustion, flow, and temperature signals continuously and layers AI models on top to catch drift long before it becomes a line item on next quarter's energy bill. None of the five capabilities below require new control hardware to get started; each one builds on data your historian is likely already collecting.
Manual Boiler Management vs Continuous AI Optimization
The table below lays out where the two approaches diverge across the operational dimensions that determine how much of a plant's steam energy actually reaches production.
| Dimension | Manual Management | iFactory AI Optimization |
|---|---|---|
| Combustion Tuning Frequency | Set during commissioning or annual service, rarely revisited between visits | Continuously trimmed against live load and ambient conditions |
| Steam Trap Surveys | Walked a few times per year with ultrasonic or thermal handheld tools | Monitored continuously with automatic anomaly alerts by trap station |
| Blowdown Setpoint | Fixed conservative value set once for worst-case water chemistry | Adjusted continuously against measured total dissolved solids trends |
| Efficiency Visibility | Calculated periodically through a manual boiler efficiency test | Live fuel-per-unit-of-steam dashboard updated continuously by boiler |
| Time to Detect a Failure | Weeks to months, depending on survey and reporting schedule | Hours, through automatic threshold and pattern-based alerts |
The Savings Potential Sitting Inside a Typical Steam System
These figures reflect published steam system benchmarking research and documented plant case studies, and they illustrate the scale of recoverable energy that continuous monitoring is built to capture.
Questions Plant Engineers Ask About AI Boiler Optimization
Every Percentage Point of Steam Efficiency Is Money Already Being Spent
iFactory's AI platform turns combustion, trap, and condensate data you already generate into continuous savings instead of an annual finding buried in a survey report. Book a demo to see the losses in your own steam system.