The brewery operations manager watches the fermenter temperature trending chart on the SCADA screen. Three batches in the past month showed off-profile ester development during the first 48 hours of fermentation, resulting in 12,000 gallons of product that barely met specification. The lab team caught it only after the tank was fully attenuated, meaning 14 days of tank occupancy wasted. Meanwhile, across the plant floor, the CIP skid pressure readings have been drifting for weeks, the bottling line OEE dropped below 72%, and the quality team is buried in paper COAs. The manager thinks: there has to be a better way to run a brewery without guessing, reworking batches, and losing margin to preventable variability.
Brewery and Distillery Analytics Management Guide
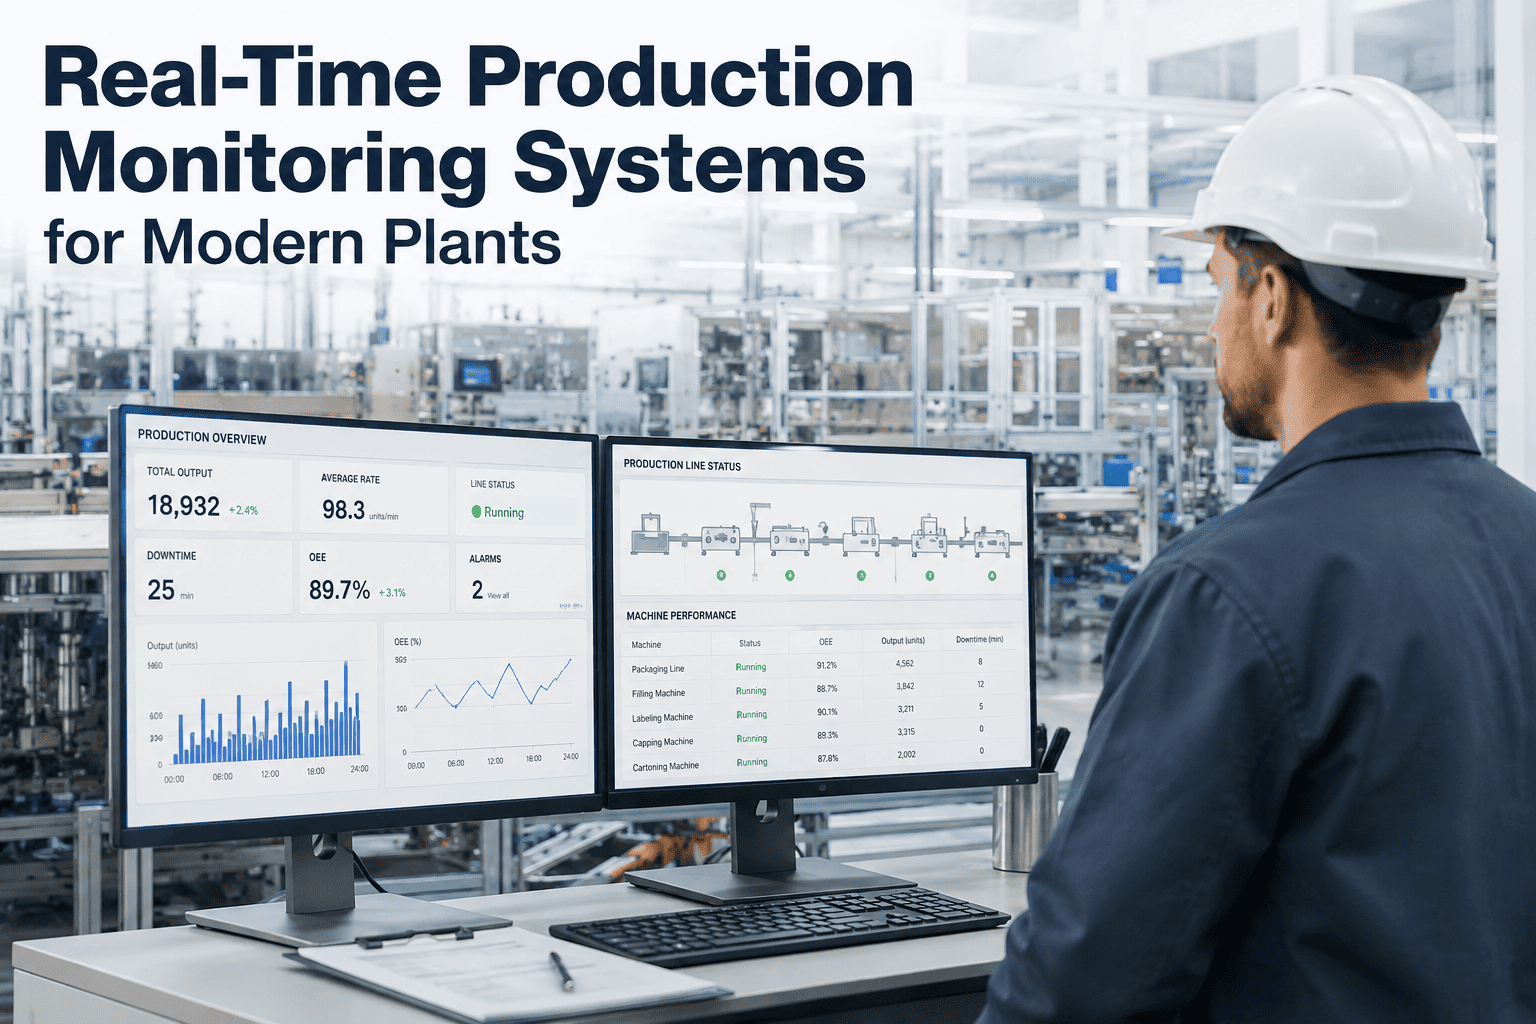
iFactory AI delivers a unified analytics platform purpose-built for beverage alcohol production — monitoring fermenters, CIP systems, bottling lines, and quality control in a single pane of glass, with actionable intelligence that reduces variability and improves yield.
One Analytics Platform for Fermenters, CIP, Bottling, and Quality
iFactory is the first AI-native manufacturing intelligence platform designed specifically for beverage alcohol production. The platform ingests live data from your PLCs, SCADA, CMMS, and lab information systems to build a unified data model across your entire brewery or distillery. Fermentation temperature profiles, CIP flow rates, bottling line speeds, and quality lab results live in one place with automated correlations that tell you what is actually driving variation in your finished product. The platform runs on-premise with zero cloud dependency, integrates with existing automation infrastructure in weeks, and delivers production-ready analytics without data science overhead.
Unlike generic manufacturing analytics tools, iFactory understands the specific physics and chemistry of beverage alcohol production. The platform models fermentation kinetics, CIP cleaning efficacy, pasteurization unit calculations, and packaging line efficiency using domain-specific algorithms trained on real brewery and distillery data. The result is actionable intelligence that production managers, quality assurance teams, and plant engineers can use immediately to reduce variability, improve yield, and protect brand quality.
Six Core Analytics Capabilities for Beverage Alcohol Production
iFactory delivers a complete suite of analytics capabilities that address the highest-impact areas of brewery and distillery operations. Each capability is production-ready, integrated with your existing systems, and proven in commercial beverage facilities.
Real-Time Fermentation Analytics
Monitor temperature, pH, specific gravity, pressure, and dissolved oxygen across every fermenter in real time. iFactory correlates fermentation profiles against finished-product quality data to identify the operating conditions that produce off-spec beer or spirits before the batch is complete.
CIP Cleaning Optimization
Track flow rate, temperature, chemical concentration, and contact time across every CIP cycle. The platform detects deviations in cleaning effectiveness before they cause microbiological issues, and optimizes chemical usage to reduce cost without compromising sanitation standards.
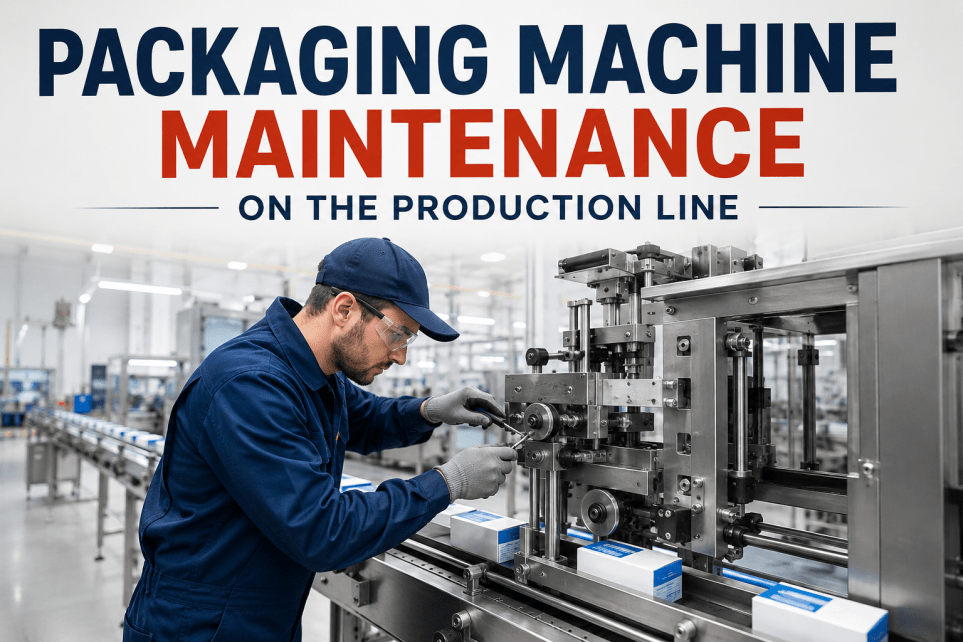
Bottling and Packaging Line Intelligence
Monitor filler performance, capper torque, labeler registration, and case packer efficiency in real time. iFactory calculates OEE by shift, SKU, and line configuration, and flags emerging issues like filler nozzle wear or labeler drift before they cause downtime or rework.
Integrated Quality Management
Centralize lab results, sensory panel data, and in-line sensor readings into a single quality dashboard. iFactory links quality attributes to specific process conditions, enabling root cause analysis that identifies whether a diacetyl issue is fermentation-driven or microbiological in origin.
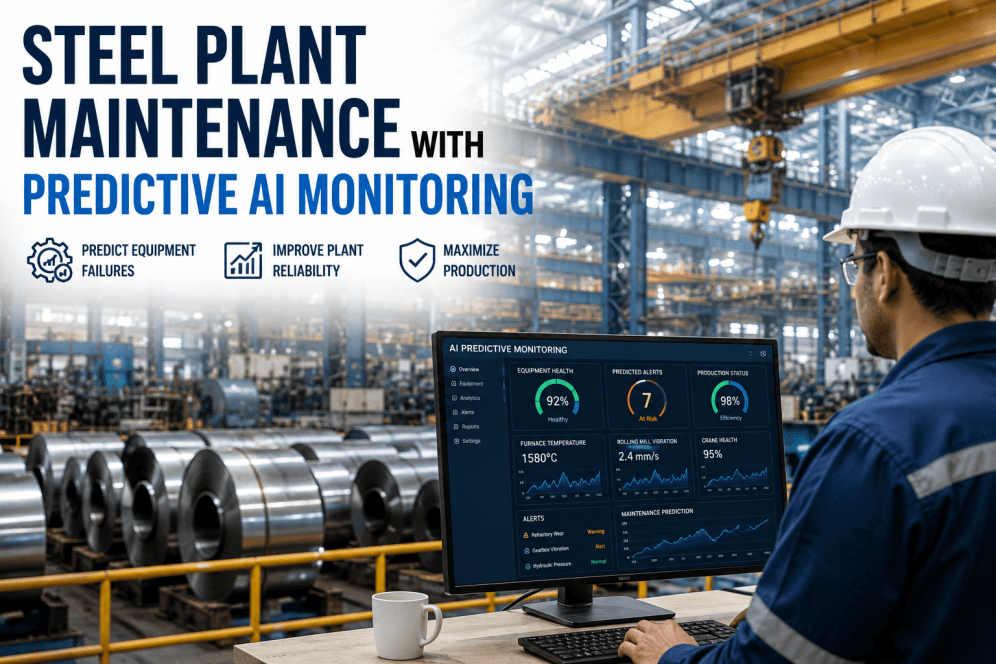
Equipment Reliability Analytics
Apply vibration analysis, temperature trending, and current draw monitoring to fermenter agitators, CIP pumps, and bottling line motors. iFactory predicts equipment failures 2-4 weeks in advance, allowing maintenance to be scheduled during planned downtime rather than causing unplanned line stops.
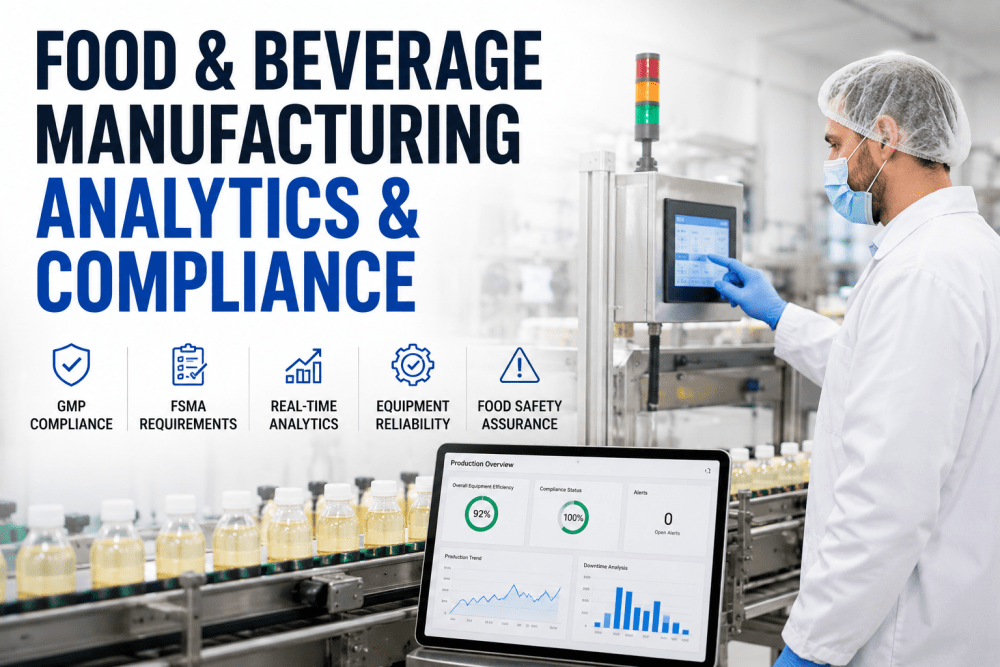
Automated Regulatory Compliance
Generate TTB, FDA, and OSHA compliance reports automatically from production data. iFactory maintains a complete audit trail of batch records, CIP cycles, quality tests, and maintenance activities with tamper-evident logging suitable for regulatory inspection.
From Raw Data to Production Intelligence in Four Steps
iFactory connects to your existing automation infrastructure and transforms raw sensor data into actionable production intelligence without disrupting ongoing operations.
Connect Data Sources
iFactory connects to your PLCs, SCADA system, CMMS, and lab information system through standard industrial protocols. No middleware required. The platform discovers and maps data points automatically during the onboarding phase.
Build Unified Data Model
The platform creates a time-series data model that aligns fermenter batches, CIP cycles, packaging runs, and quality tests across a common timeline. iFactory applies beverage-specific algorithms to calculate fermentation kinetics, cleaning efficacy, and OEE automatically.
Deploy Analytics Dashboards
Production managers, QA teams, and plant engineers receive role-specific dashboards with real-time KPIs, trend charts, and alerting. Each dashboard is pre-configured for beverage alcohol production and requires zero configuration by your team.
Act on Predictive Intelligence
iFactory sends alerts when fermentation profiles deviate from specification, CIP cycles show degradation, or equipment health indicators cross warning thresholds. The platform recommends corrective actions based on historical data and process models.
Why Traditional Brewery and Distillery Analytics Falls Short
Most beverage alcohol producers operate with fragmented data systems that make it impossible to connect process conditions to finished-product quality. The cost of this fragmentation is measured in lost yield, rework, and brand risk.
Lost Yield from Fermentation Variability
Temperature fluctuations during the first 48 hours of fermentation can reduce ethanol yield by 5-8% and create off-flavor compounds that require blending or disposal. Most producers detect these issues only at final lab analysis, 14-21 days after the damage is done.
CIP Waste and Sanitation Risk
CIP cycles consume 15-25% of a brewery's total water and chemical usage. Without analytics, cycles are over-engineered to compensate for fouling variability, wasting chemicals, and under-engineered cycles risk microbiological contamination that can spoil entire batches.
Bottling Line Inefficiency
Packaging lines in beverage alcohol facilities typically run at 65-75% OEE due to frequent changeovers, filler stops, and labeler adjustments. Each percentage point of OEE improvement at 300 bottles per minute represents $120,000 in annual capacity recovery.
What Beverage Alcohol Producers Achieve with iFactory Analytics
Early adopters across breweries, distilleries, and cideries report measurable operational improvements within 90 days of deploying iFactory. These results are from actual production environments running iFactory on-premise.
Traditional Brewery Operations vs. AI-Powered Analytics
The table below compares how critical brewery and distillery processes are managed with traditional methods versus iFactory's AI-native analytics platform. The difference in visibility, response time, and outcome is measurable across every operational dimension.
| Process Area | Traditional Approach | iFactory AI Analytics |
|---|---|---|
| Fermentation Monitoring | Manual temperature logging, lab gravity check at day 14, off-flavor detected at final analysis | Real-time temp, pH, SG, DO trending with predictive off-flavor alerts sent within 2 hours of deviation onset |
| CIP Management | Fixed-cycle programming, manual flow verification, chemical top-ups based on schedule | Adaptive cycle optimization based on real-time fouling sensing, automated chemical dosing, cycle-to-cycle trend analysis |
| Bottling Line OEE | End-of-shift manual OEE calculation, reactive maintenance, changeover tracked with stopwatches | Real-time OEE dashboard by SKU and shift, predictive filler maintenance, automated changeover time tracking with improvement alerts |
| Quality Control | Paper COAs, weekly lab data entry, reactive release holds, manual root cause investigation | Digital quality dashboard, automated COA generation, real-time SPC with out-of-control alerts, AI-driven root cause correlation |
| Compliance Reporting | Manual batch record compilation, spreadsheets for TTB reporting, audit prep takes weeks | Automated batch record generation, one-click TTB and FDA reports, tamper-evident audit trail with instant regulator access |
Industry Expert Perspective on Brewery and Distillery Analytics
"In my 25 years running brewery operations, the single biggest challenge has always been connecting what happens in the fermenter to what ends up in the bottle, and doing it fast enough to actually make a difference. Most analytics tools in the market are repurposed from general manufacturing and miss the specific dynamics of fermentation biology, CIP chemistry, and packaging line behavior that define beverage alcohol quality. iFactory is the first platform I have seen that was purpose-built for our industry. The ability to correlate real-time fermentation profiles against finished-product quality data and get alerts within hours of a deviation, not days, is a fundamental shift in how we can manage production. For any facility running more than 50,000 barrels annually, the yield improvement alone justifies the investment within the first year."
Transform Your Brewery or Distillery with AI-Powered Analytics
The beverage alcohol industry is facing unprecedented pressure on margins, quality standards, and regulatory compliance. Fragmented data systems and reactive management approaches that worked at smaller scales are no longer sufficient for modern production facilities running at high utilization rates. iFactory provides the unified analytics platform that connects fermentation, CIP, bottling, and quality data into a single source of truth with actionable intelligence that improves yield, reduces cost, and protects brand quality.
With a typical deployment timeline of 3-6 weeks to first actionable insight and an average payback period of seven months, iFactory delivers measurable ROI from month one. The platform runs on your existing infrastructure with zero cloud dependency and integrates with your current automation systems without requiring changes to your software stack.
You can have real-time fermentation analytics, CIP optimization, and bottling line intelligence running on your plant floor within six weeks. Book a Demo and see iFactory applied to a live brewery production simulation.
Frequently Asked Questions About Brewery and Distillery Analytics
Production managers, quality assurance directors, and plant engineers ask these questions before implementing an analytics platform in beverage alcohol facilities.
Stop Managing Your Brewery with Spreadsheets and Gut Feel. Start Using Real Analytics.
iFactory delivers production-ready brewery and distillery analytics in 3-6 weeks, running on an on-premise appliance with zero cloud dependency. You provide data-source access; we provide actionable intelligence that improves yield, reduces cost, and protects quality. Book a demo to see it applied to a live production simulation.