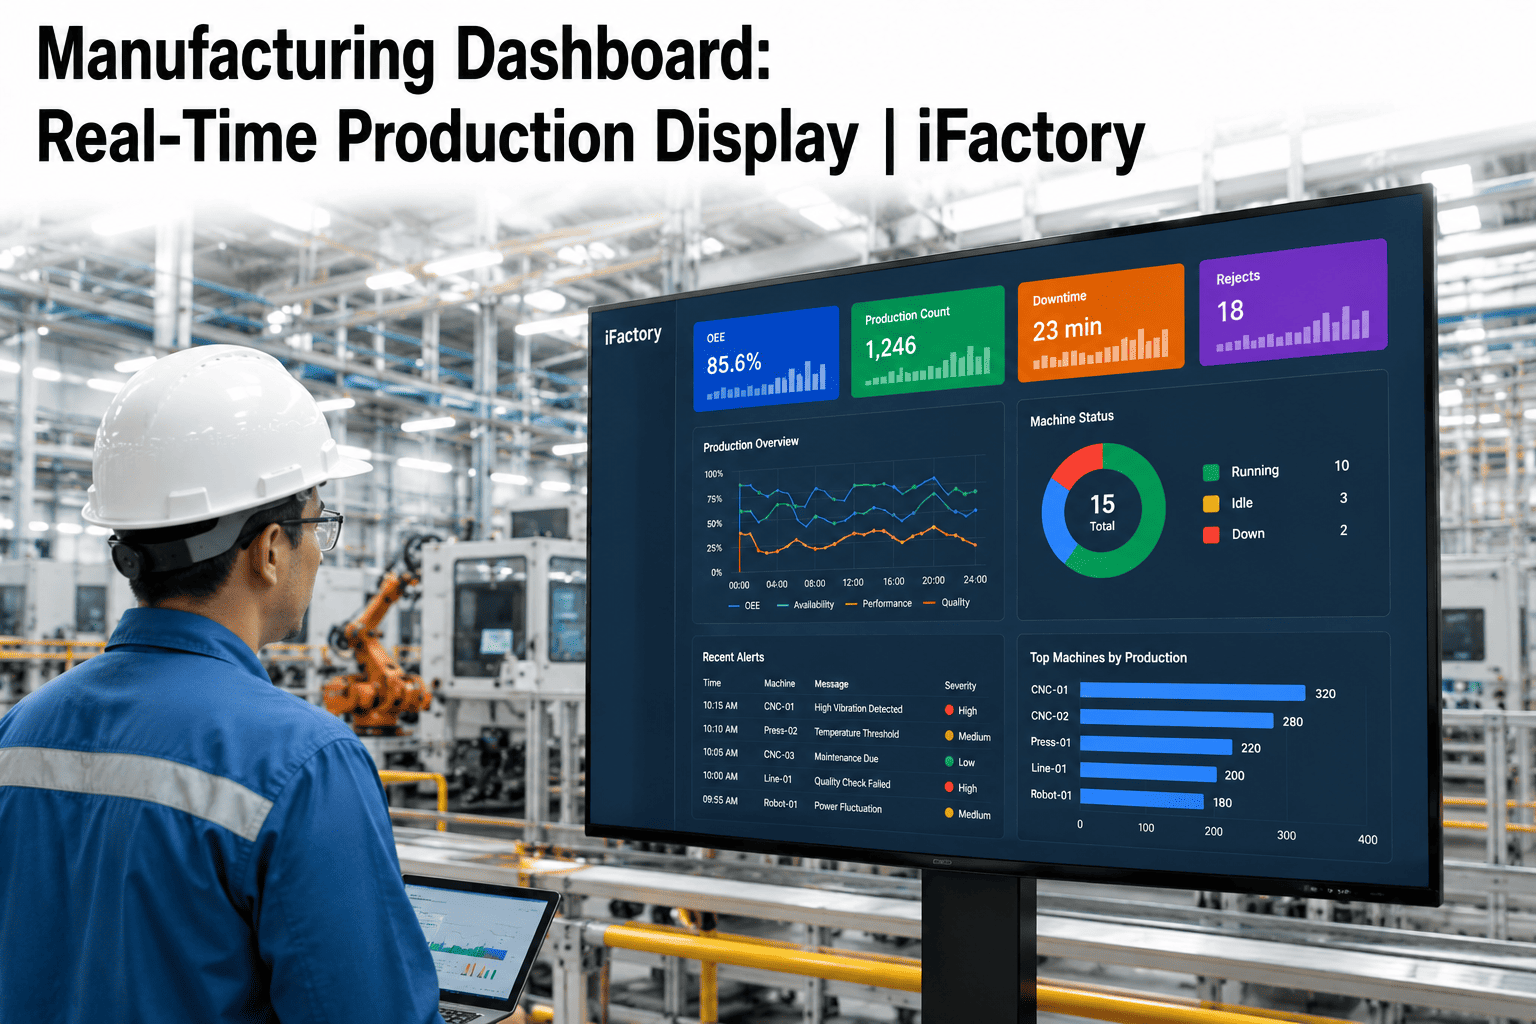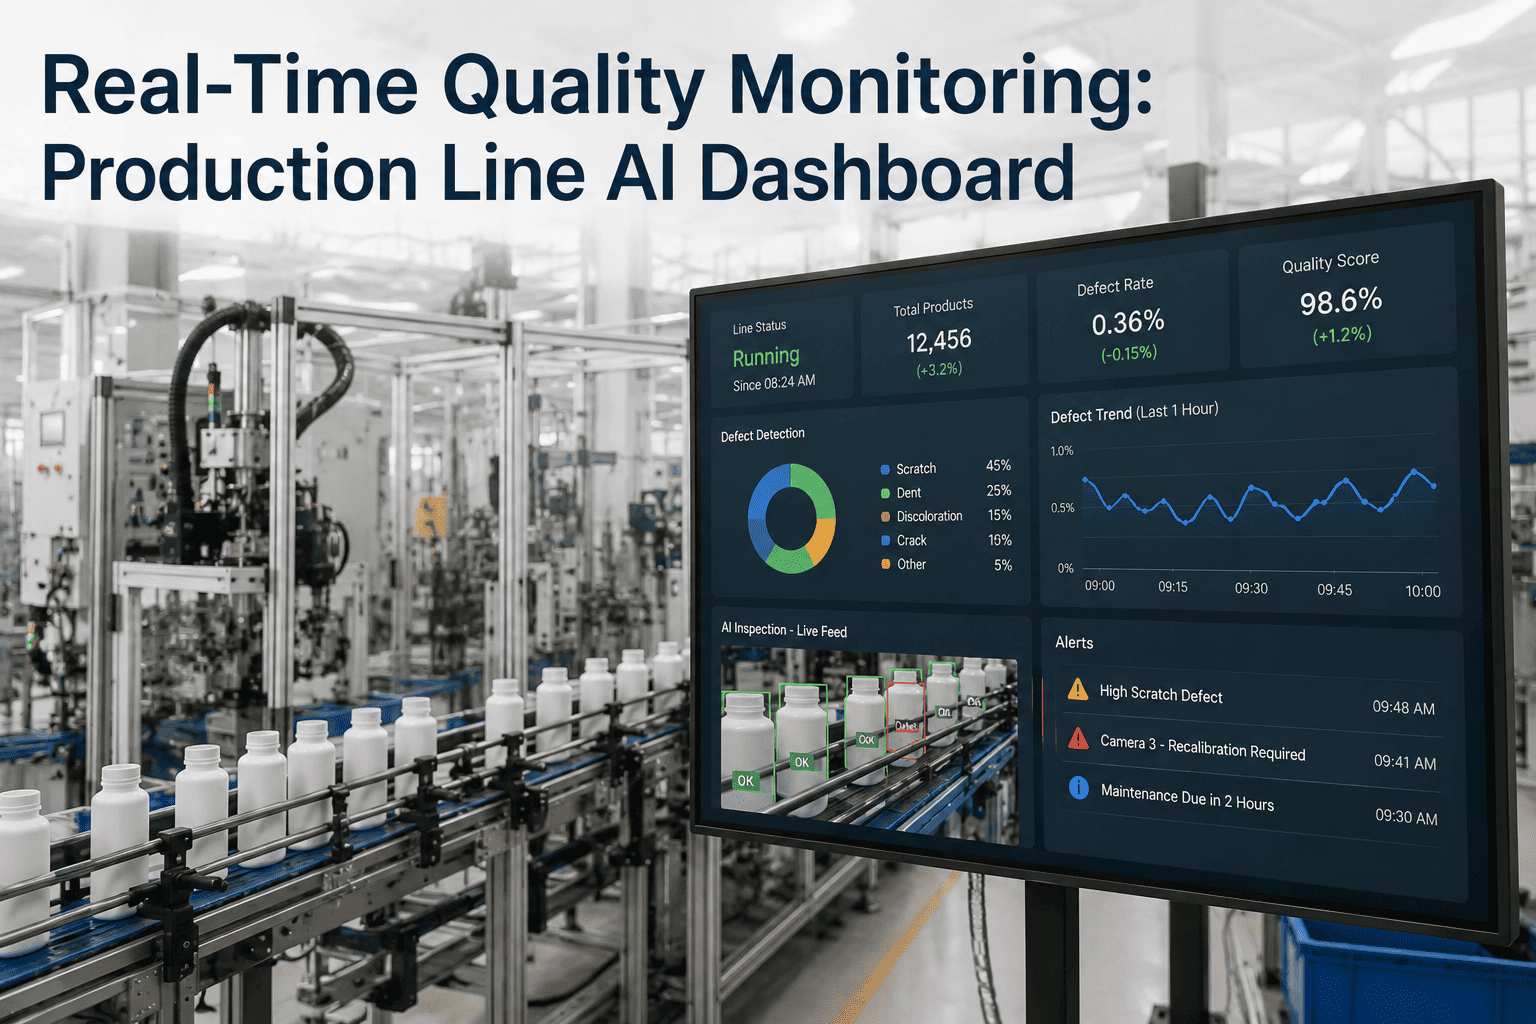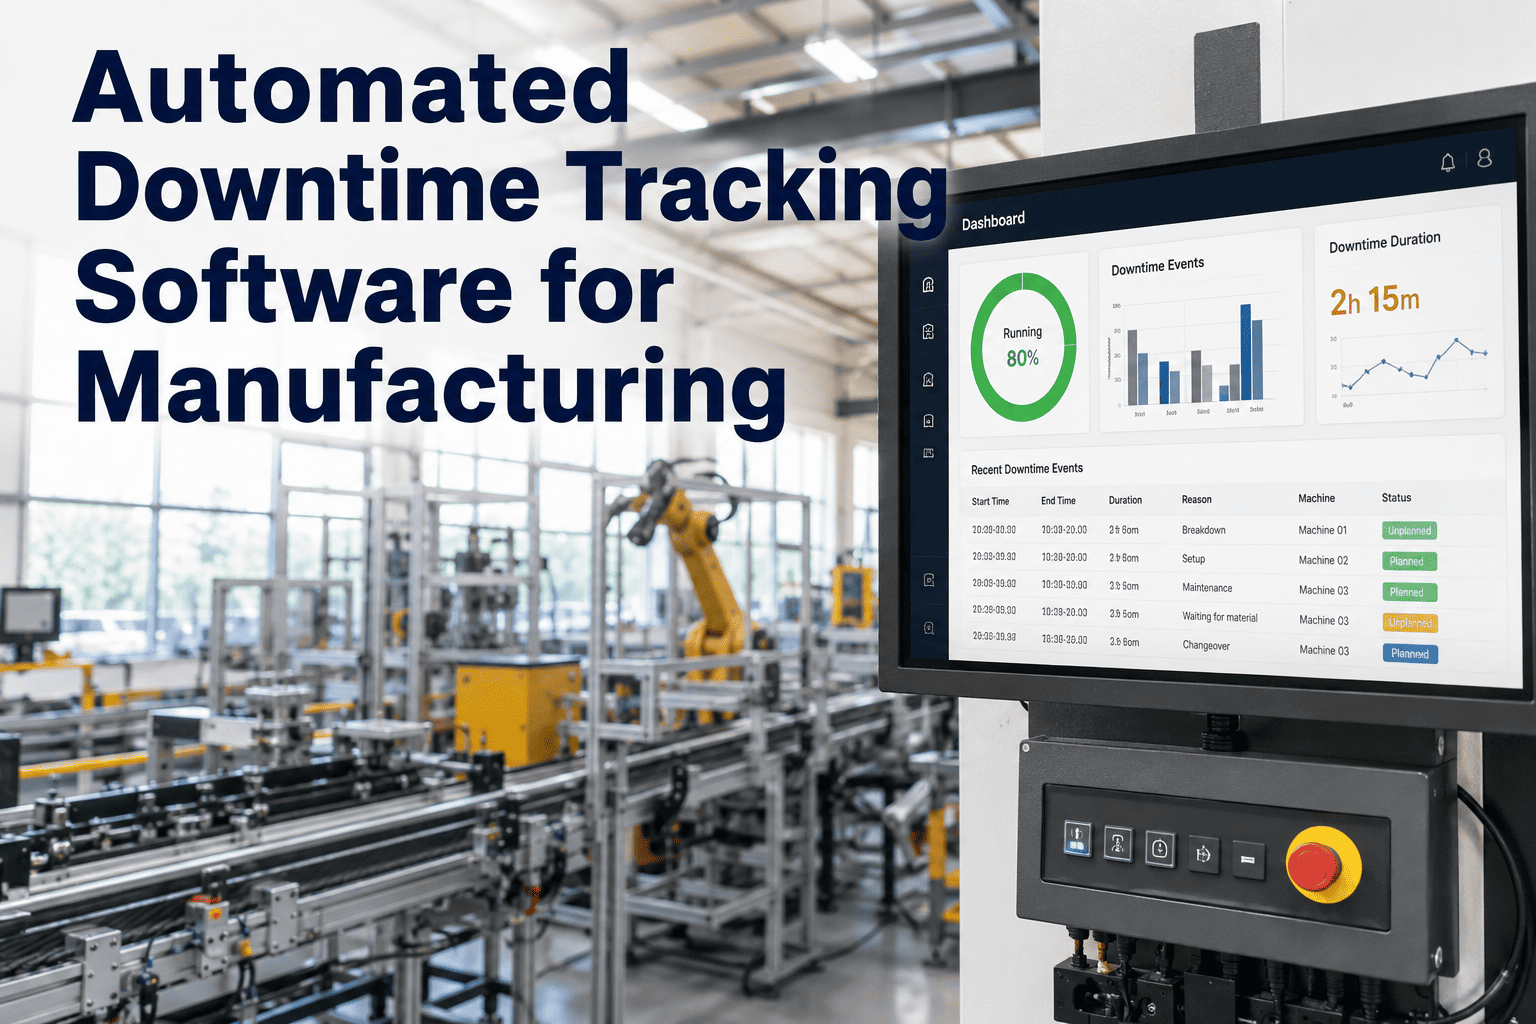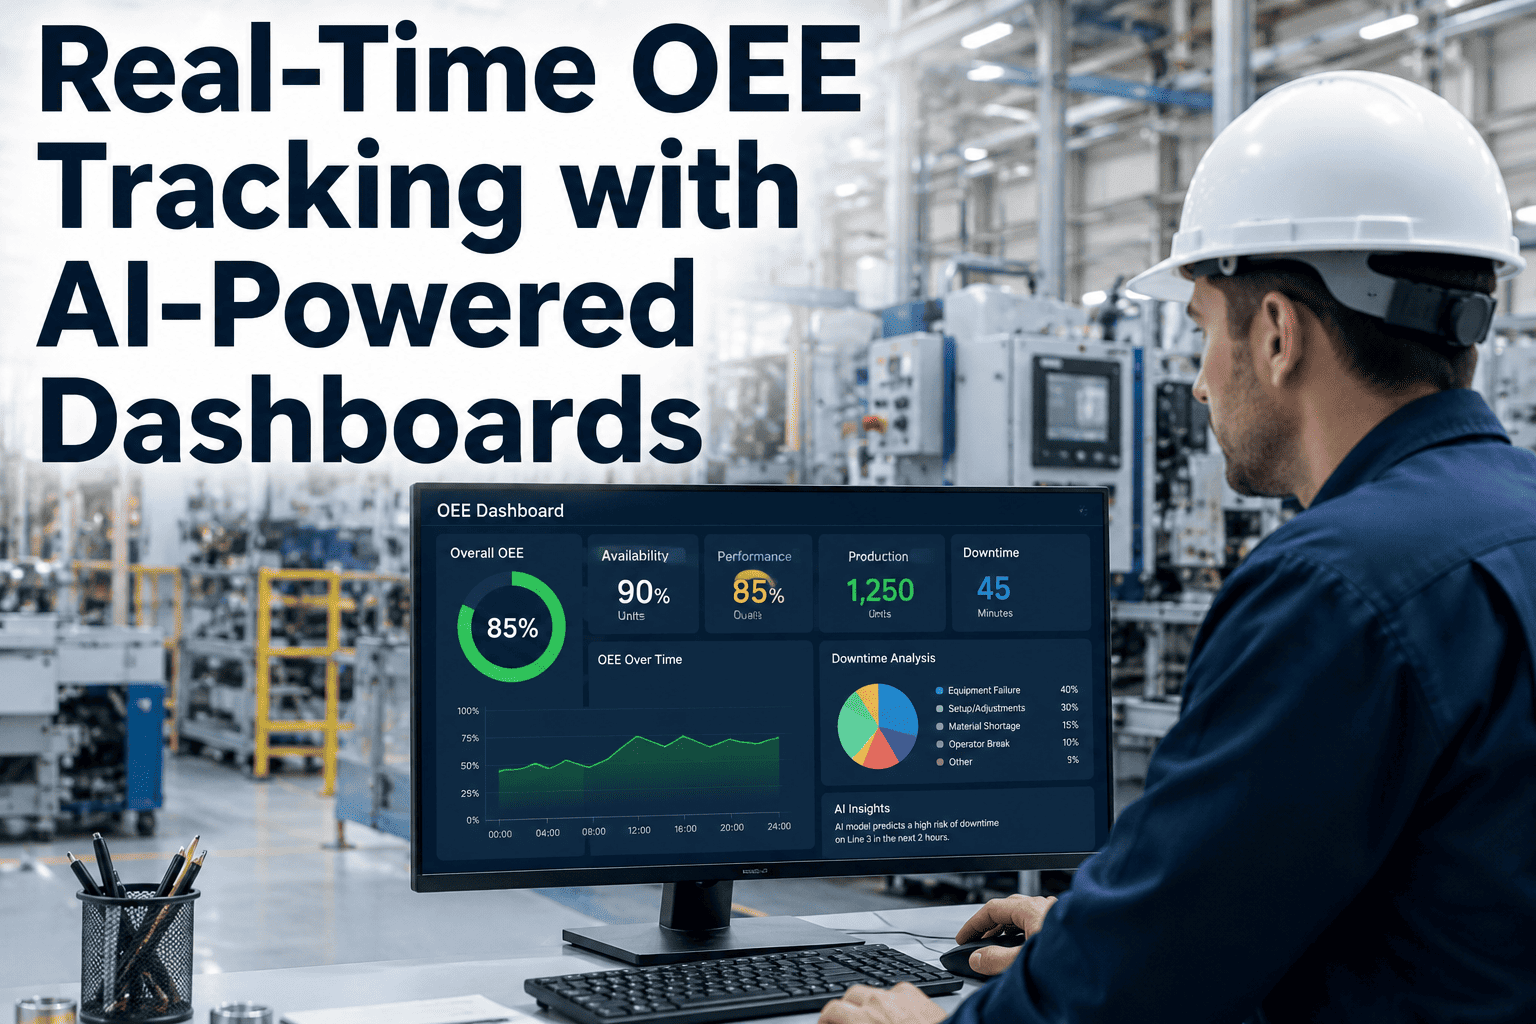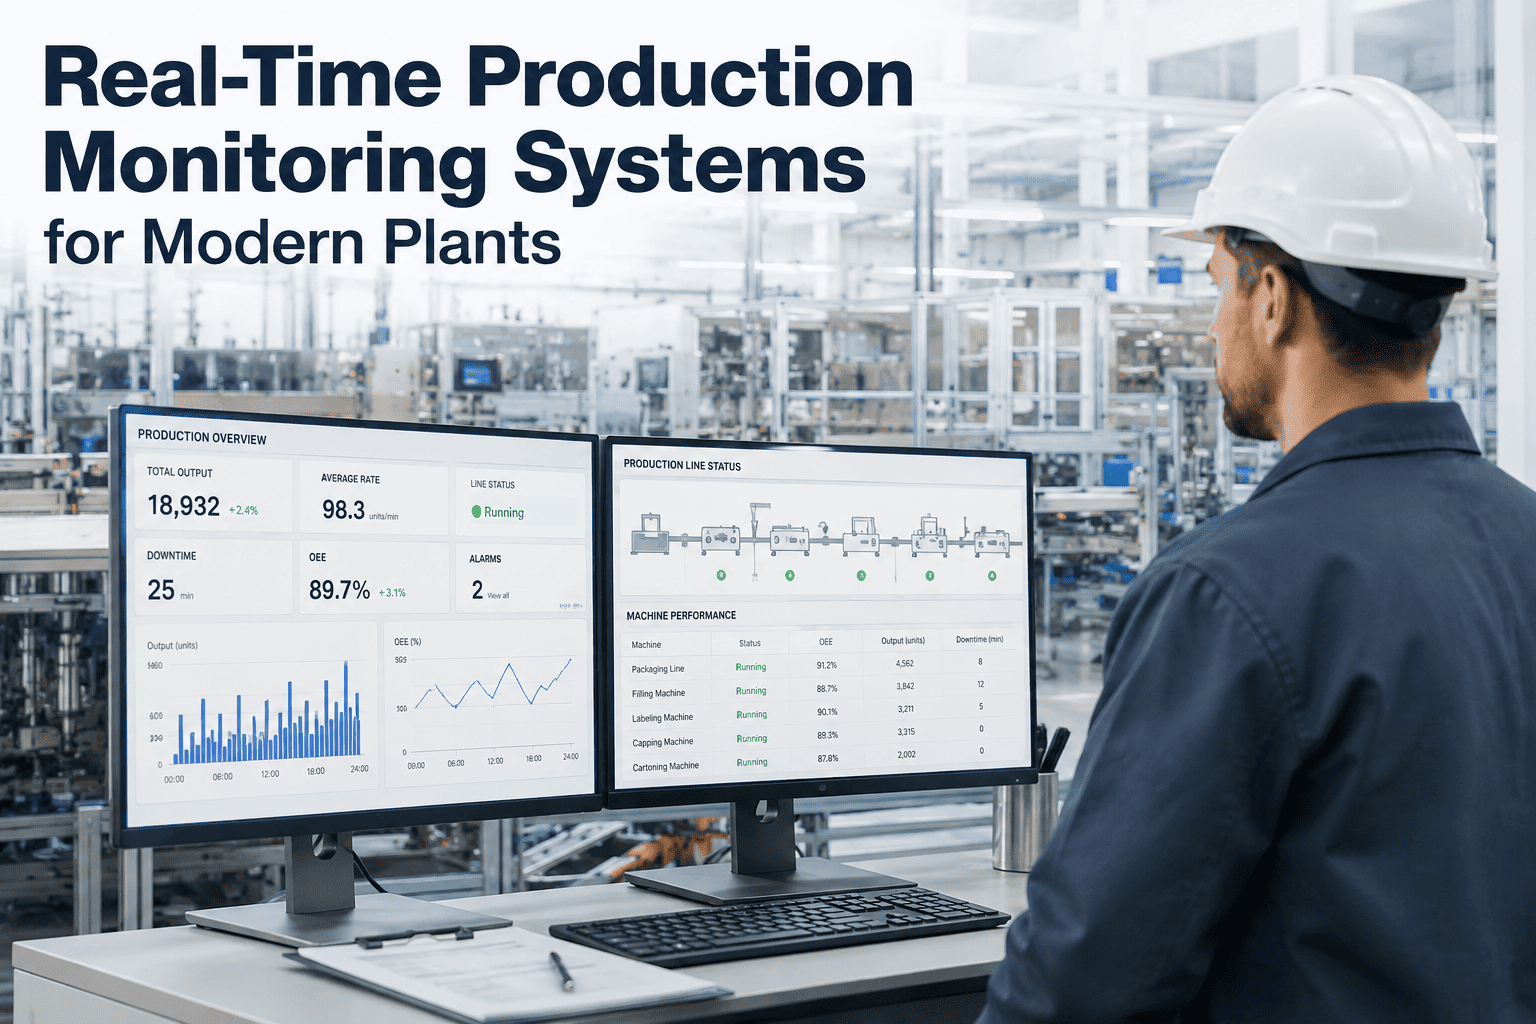
In the era of Industry 4.0, the shift from manual, clipboard-based data collection to real-time production monitoring systems is no longer a competitive advantage but a baseline requirement for operational excellence. Modern manufacturing plants generate an immense volume of data from every machine, sensor, and production line, yet many enterprises still rely on fragmented spreadsheets and periodic manual checks to gauge performance. This approach introduces latency, human error, and a lack of granularity that can cost millions in inefficiency. A robust production monitoring system provides a single source of truth, offering live visibility into overall equipment effectiveness (OEE), downtime, cycle times, and throughput. By integrating directly with PLCs, SCADA, and IoT sensors, these systems transform raw data into actionable intelligence, enabling plant managers to respond to anomalies in seconds rather than days. This comprehensive guide explores the core components, deployment strategies, and measurable ROI of real-time production monitoring, tailored for enterprise decision-makers seeking to modernize their shop floor operations. Book a Demo to see how iFactory transforms your production visibility.
Transform Your Shop Floor with Real-Time Visibility
Stop guessing. Start optimizing. Gain live OEE and downtime insights instantly.
Architecture of a Real-Time Production Monitoring System
A production monitoring system is not a single software tool but an integrated stack of hardware, connectivity, data processing, and visualization layers. At the edge, sensors and PLCs capture machine states, cycle counts, and process variables. This data streams via industrial protocols (OPC UA, MQTT, Modbus) to a central data lake or processing engine. Cloud or on-premise servers then apply rules, calculate OEE components (availability, performance, quality), and trigger alerts. The top layer—dashboards and mobile apps—presents this information in intuitive formats for operators, supervisors, and executives. Key architectural considerations include data latency (sub-second for real-time decisions), scalability (thousands of machines per site), and security (encryption, role-based access). A modern system must also support historical trend analysis and integration with MES, ERP, and CMMS for closed-loop improvements.
The choice between edge computing and cloud processing depends on plant size, network reliability, and latency requirements. For high-speed production lines (e.g., automotive stamping), edge processing is essential to avoid delays. Smaller facilities with stable internet can leverage cloud-based analytics for lower upfront costs. Hybrid architectures offer the best of both worlds, processing critical alerts locally while aggregating long-term trends in the cloud. iFactory’s platform is designed for flexible deployment, supporting both edge and cloud configurations to match your plant’s unique infrastructure.
OEE Calculation Engine
Automatically computes availability, performance, and quality from live machine data. Eliminates manual stopwatch studies and spreadsheet errors.
Downtime Root Cause Analysis
Categorizes downtime by reason (maintenance, material shortage, setup) using machine signals and operator input. Enables Pareto-driven improvement.
Real-Time Dashboards
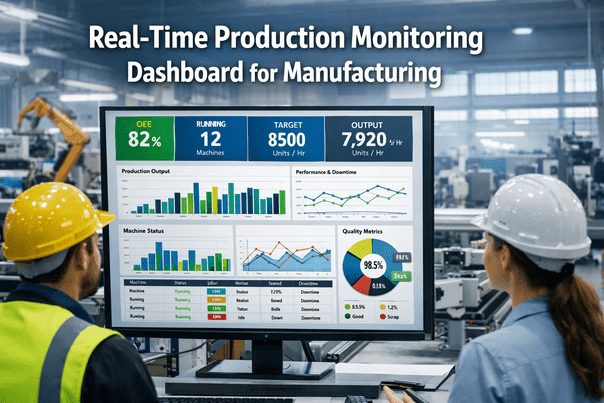
Role-specific views for operators (line status), supervisors (shift performance), and executives (plant-wide KPIs). All data updates every second.
Step-by-Step Deployment Timeline
Phase 1: Discovery & Assessment (Weeks 1-2)
Map all production assets, identify data sources (PLCs, sensors, manual inputs), and define key performance indicators (OEE, MTBF, throughput). Conduct network audit for connectivity.
Phase 2: Infrastructure Setup (Weeks 3-4)
Install edge gateways or configure cloud connectors. Deploy sensors on critical machines if needed. Set up secure data pipelines with OPC UA or MQTT.
Phase 3: Integration & Configuration (Weeks 5-6)
Connect to MES/ERP for order data, CMMS for maintenance schedules. Configure OEE formulas, downtime categories, and alert thresholds. Build dashboards.
Phase 4: Training & Go-Live (Weeks 7-8)
Train operators, supervisors, and engineers on system usage. Conduct parallel run with manual tracking for validation. Go live with full real-time monitoring.
Phase 5: Continuous Improvement (Ongoing)
Analyze trends, refine OEE targets, and implement corrective actions. Use historical data for predictive maintenance and capacity planning.
Comparison of Production Monitoring Approaches
| Feature | Manual (Clipboard) | Basic SCADA | Real-Time System (iFactory) |
|---|---|---|---|
| Data Latency | Hours to days | Minutes | Sub-second |
| OEE Calculation | Manual, error-prone | Partial, batch | Automated, real-time |
| Downtime Reasons | Subjective | Limited categories | Auto-categorized + operator input |
| Mobile Access | None | Limited | Full, responsive dashboards |
| Integration | None | Proprietary | Open APIs, MES/ERP/CMMS |
| ROI Timeline | N/A | 12-18 months | 3-6 months |
Ready to Eliminate Downtime Blind Spots?
Deploy real-time monitoring in weeks, not months. See immediate impact on OEE.
Production Monitoring System Selection Checklist
Overcoming Common Implementation Challenges
Deploying a production monitoring system often faces resistance from operators who fear surveillance, IT departments concerned about network security, and budget constraints. To address operator concerns, frame the system as a tool to make their job easier—automatic data entry reduces paperwork, and real-time alerts help them prevent issues before they escalate. For IT, ensure the system uses encrypted protocols (TLS 1.2+), supports VLAN segmentation, and has role-based access control. Budget objections can be overcome with a pilot project demonstrating ROI within 3 months. iFactory’s phased deployment approach minimizes risk and builds organizational buy-in.
Another common challenge is data quality from legacy machines. Many older PLCs do not expose cycle times or quality data natively. In such cases, add-on sensors (vibration, current, or vision) can fill gaps. Alternatively, operator input via tablets can capture reasons for downtime. The key is to start with the highest-impact machines and expand gradually. A successful implementation focuses on quick wins—reducing top downtime reasons—to build momentum for broader rollout.
Frequently Asked Questions
What is the difference between a production monitoring system and a SCADA system?
A SCADA (Supervisory Control and Data Acquisition) system primarily focuses on controlling and monitoring industrial processes in real-time, often at the machine or line level. It provides low-level data such as temperature, pressure, and speed. In contrast, a production monitoring system is built on top of SCADA or directly from PLCs to calculate higher-level business metrics like OEE, throughput, and downtime reasons. It also offers role-specific dashboards, integration with MES/ERP, and analytics for continuous improvement. While SCADA is essential for process control, a production monitoring system turns that data into actionable intelligence for plant management. For a deeper dive, explore our support resources.
How long does it take to see ROI from a real-time production monitoring system?
Most enterprise plants see a positive return on investment within 3 to 6 months of full deployment. The primary drivers are downtime reduction (typically 20-30% decrease), improved OEE (5-15% increase), and reduced manual data collection labor. For example, a mid-sized automotive plant with 50 machines saved $1.2 million annually by reducing unplanned downtime by 25%. The speed of ROI depends on the baseline inefficiency and the speed of implementation. A phased rollout focused on bottleneck lines can accelerate payback. Book a Demo to calculate your potential savings.
Can a production monitoring system work with older, non-IoT machines?
Yes, absolutely. Modern production monitoring platforms like iFactory are designed to integrate with legacy equipment through multiple methods. If the machine has a PLC with available data points, we can connect via OPC UA or Modbus. For machines without any digital output, we can install low-cost sensors (e.g., current clamps, vibration sensors, or optical counters) to capture run/stop status and cycle counts. Operator input via a tablet or barcode scanner can also capture quality and downtime reasons. This hybrid approach ensures 100% visibility across your entire fleet, regardless of age. Contact our support team for a compatibility assessment.
What are the key features to look for when evaluating production monitoring software?
When evaluating a production monitoring system, prioritize these features: (1) Real-time data capture with sub-second latency from all machines. (2) Automatic OEE calculation with drill-down to availability, performance, and quality components. (3) Downtime tracking with root cause categorization (auto-detected and operator-entered). (4) Role-based dashboards that are customizable without coding. (5) Mobile app support for alerts and quick views. (6) Open APIs for integration with existing MES, ERP, and CMMS. (7) Scalability from a single line to multi-plant deployments. (8) Security features like role-based access, encryption, and audit logs. Book a Demo to see how iFactory excels in all these areas.
How does real-time monitoring improve production quality?
Real-time monitoring improves quality by enabling immediate detection of process deviations. For example, if a machine’s cycle time drifts outside tolerance, the system can trigger an alert before defective parts are produced. By tracking First Pass Yield (FPY) in real-time, operators can identify quality issues at the source—whether it’s a tool wear, material variation, or setup error. Historical data from the monitoring system also supports root cause analysis, helping quality engineers identify recurring patterns. Over time, this leads to fewer defects, less rework, and higher customer satisfaction. Learn more about our quality analytics features.
Start Your Digital Transformation Today
Empower your team with real-time production intelligence. Deploy in weeks, see ROI in months.