Factory Data Integration Platforms for Real‑Time Visibility

By oxmaint on March 9, 2026

factory-data-integration-platforms-for-real-time-visibility

Every modern factory generates terabytes of operational data daily—yet a staggering 73% of it never reaches a decision-maker. The gap between data creation and data utilization is the single largest source of hidden waste in manufacturing today. Factory data integration platforms close this gap by connecting every machine, sensor, and enterprise system into a unified intelligence layer that delivers production KPIs, quality metrics, and equipment health to the right person at the right moment. In 2026, digitalization is no longer a forward-looking initiative—it is the minimum requirement for competing in global manufacturing. Schedule a free data visibility assessment to discover how much operational intelligence your plant is currently leaving on the table.

What Is a Factory Data Integration Platform and Why Does It Matter

A factory data integration platform is a middleware layer that connects disparate operational technology (OT) systems—PLCs, SCADA, HMIs, IoT sensors—with information technology (IT) systems like MES, ERP, QMS, and CMMS into one coherent data environment. Instead of operators toggling between five different screens or waiting for yesterday's spreadsheet report, an integrated platform streams normalized, contextualized data to real-time dashboards accessible from the shop floor to the C-suite.

The Data Visibility Problem
84%
of manufacturers say data silos are the top barrier to operational improvement
48h+
average delay before production adjustments are implemented without real-time data
55%
average OEE in plants lacking integrated monitoring—versus 85%+ in world-class facilities

The consequences of fragmented data are not abstract. When a quality escape occurs and the quality system cannot instantly correlate with machine parameters, root cause analysis takes days instead of minutes. When a scheduler cannot see real-time machine availability, rush orders cascade into bottlenecks. When maintenance teams rely on fixed calendars rather than live condition data, equipment fails between inspections. Integration eliminates these blind spots by making every data point available, in context, the moment it is generated.

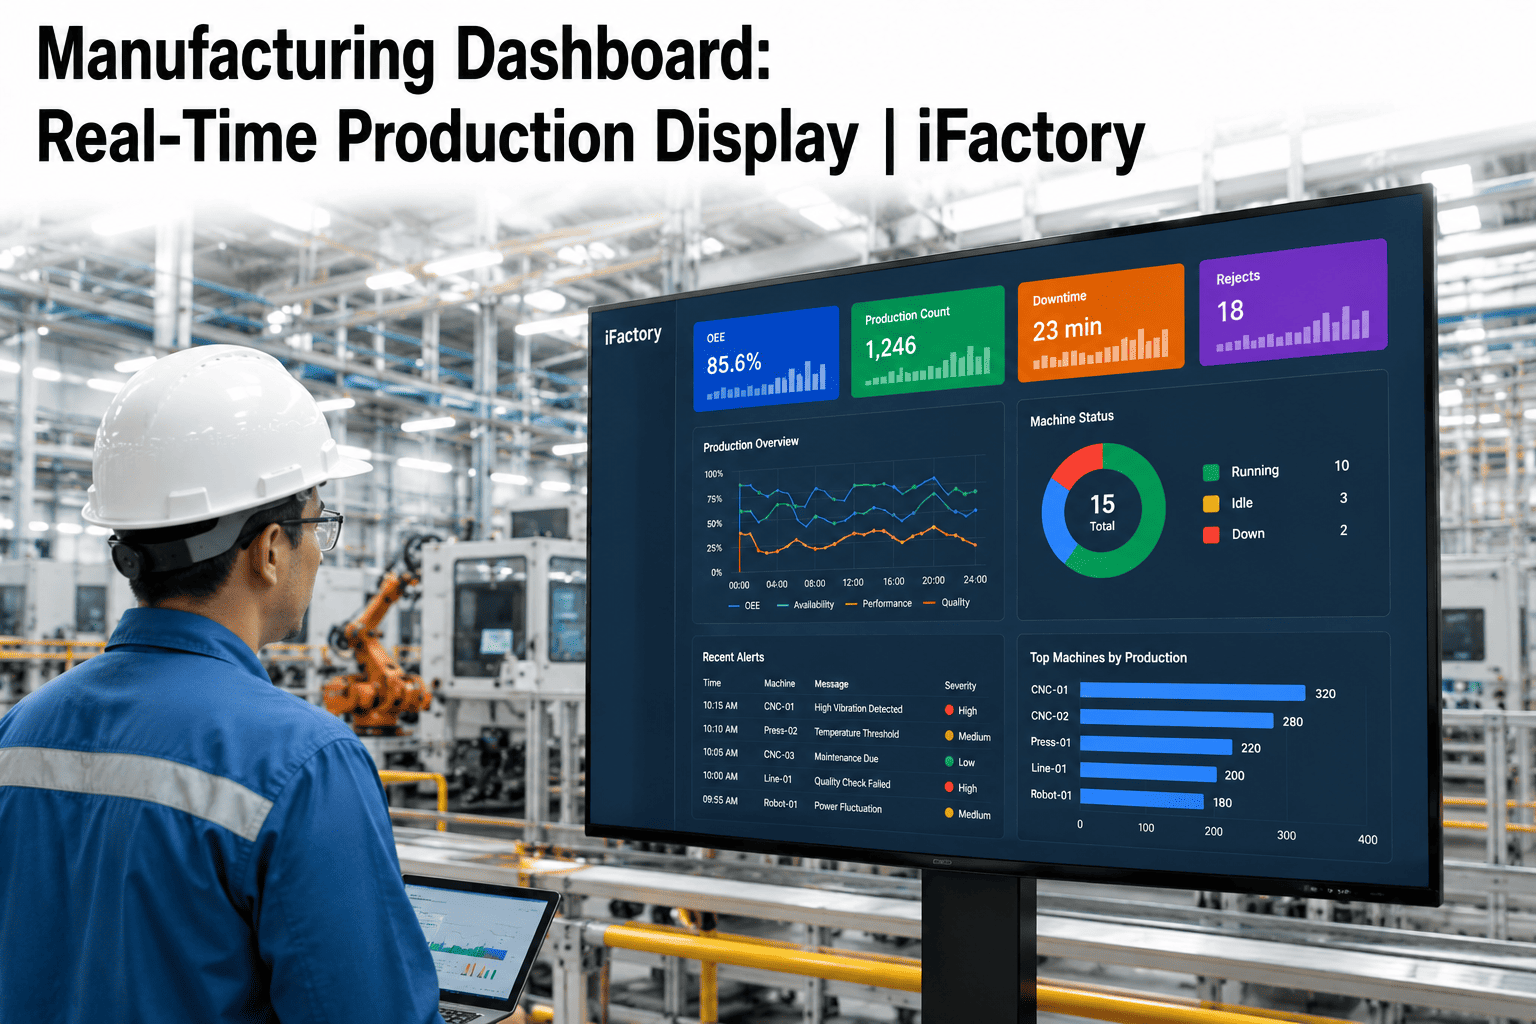
Running decisions on yesterday's data? See how live production dashboards replace guesswork with real-time operational intelligence across your entire plant.
Book a Demo

How Unified OT/IT Data Architecture Works in Practice

Understanding the technical layers of a data integration platform reveals why it delivers visibility that standalone MES, ERP, or historian systems cannot. Each layer solves a specific data challenge, and together they create an unbroken chain from machine signal to executive dashboard.

Integration Platform Architecture — Five Functional Layers
05 — Closed-Loop Action
Insights trigger automated workflows: maintenance work orders, parameter adjustments, schedule changes, compliance alerts. The loop from data to decision to action closes in seconds, not days. Schedule a demo to see closed-loop automation configured for your specific plant environment.
04 — Analytics & AI
Machine learning models, statistical process control, and configurable KPI engines transform integrated data into predictive insights—anomaly detection, demand forecasting, energy optimization, and quality trend analysis.
03 — Unified Data Model
A factory-optimized data lakehouse merges IT and OT streams into a single schema. Time-series machine data, ERP transactions, quality records, and maintenance logs share a common context—enabling cross-domain queries impossible in siloed systems.
02 — Edge Normalization
Edge compute nodes validate, clean, and contextualize raw signals at the source. Data normalization converts vendor-specific formats into a universal model so that a Fanuc robot and a Siemens PLC speak the same analytical language.
01 — Machine Connectivity
Protocol adapters connect to PLCs, SCADA, OPC-UA, Modbus, MQTT, EtherNet/IP, PROFINET, and 250+ industrial protocols. Sub-second polling captures every cycle, fault code, and process variable without modifying existing control systems.

Real-Time Production KPIs That Drive Manufacturing Performance

An integration platform's value is measured by the operational KPIs it makes visible. These are the metrics that plant managers, production supervisors, and continuous improvement teams use every hour to keep operations on track—and that executives use weekly to steer strategy.


Overall Equipment Effectiveness (OEE)
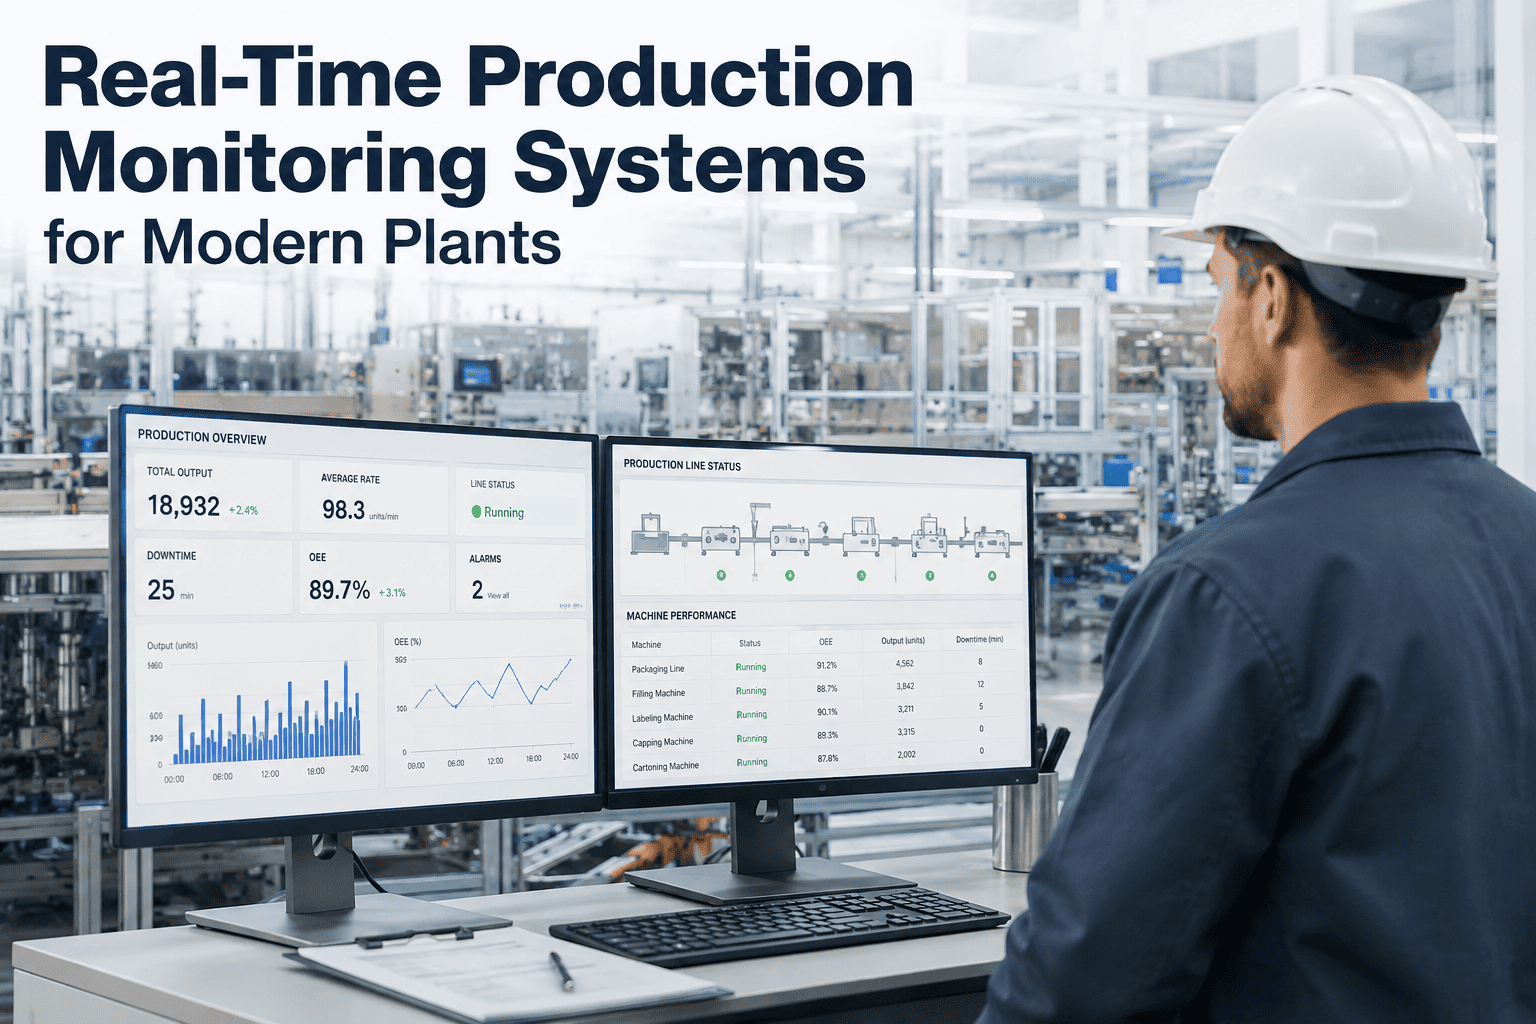
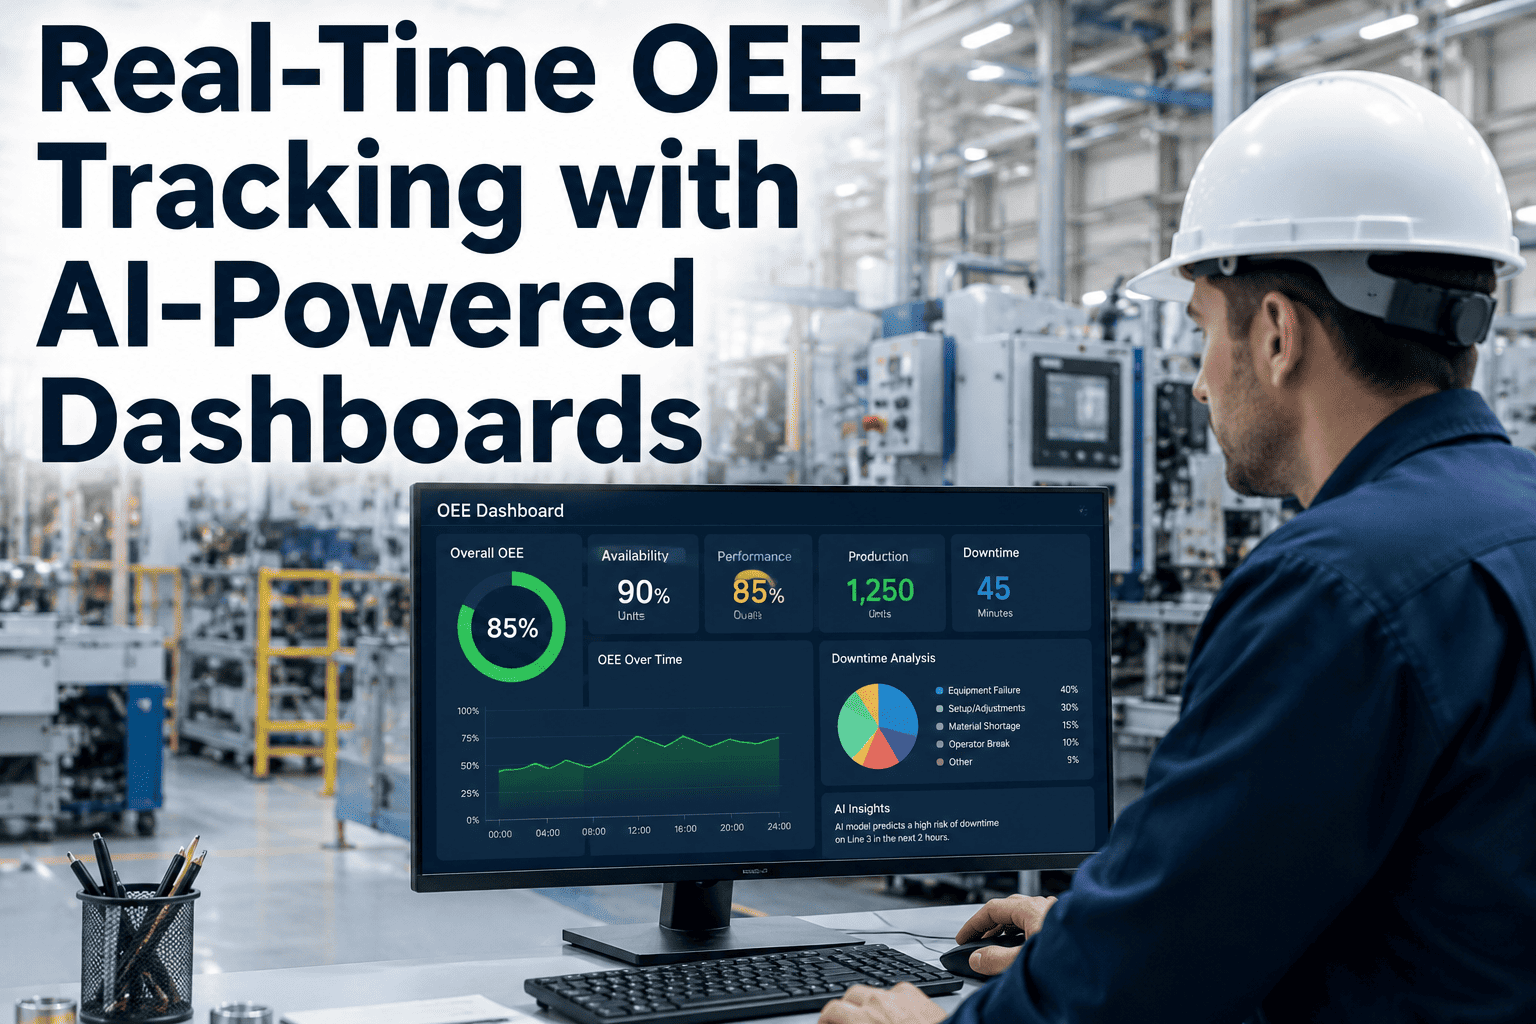
Combines availability, performance, and quality into one composite score. Automated data collection eliminates the rounding errors and forgotten outages that make manual OEE calculations unreliable. Industry benchmark for world-class OEE is 85%, yet the average plant sits near 55-60%.

First Pass Yield (FPY)
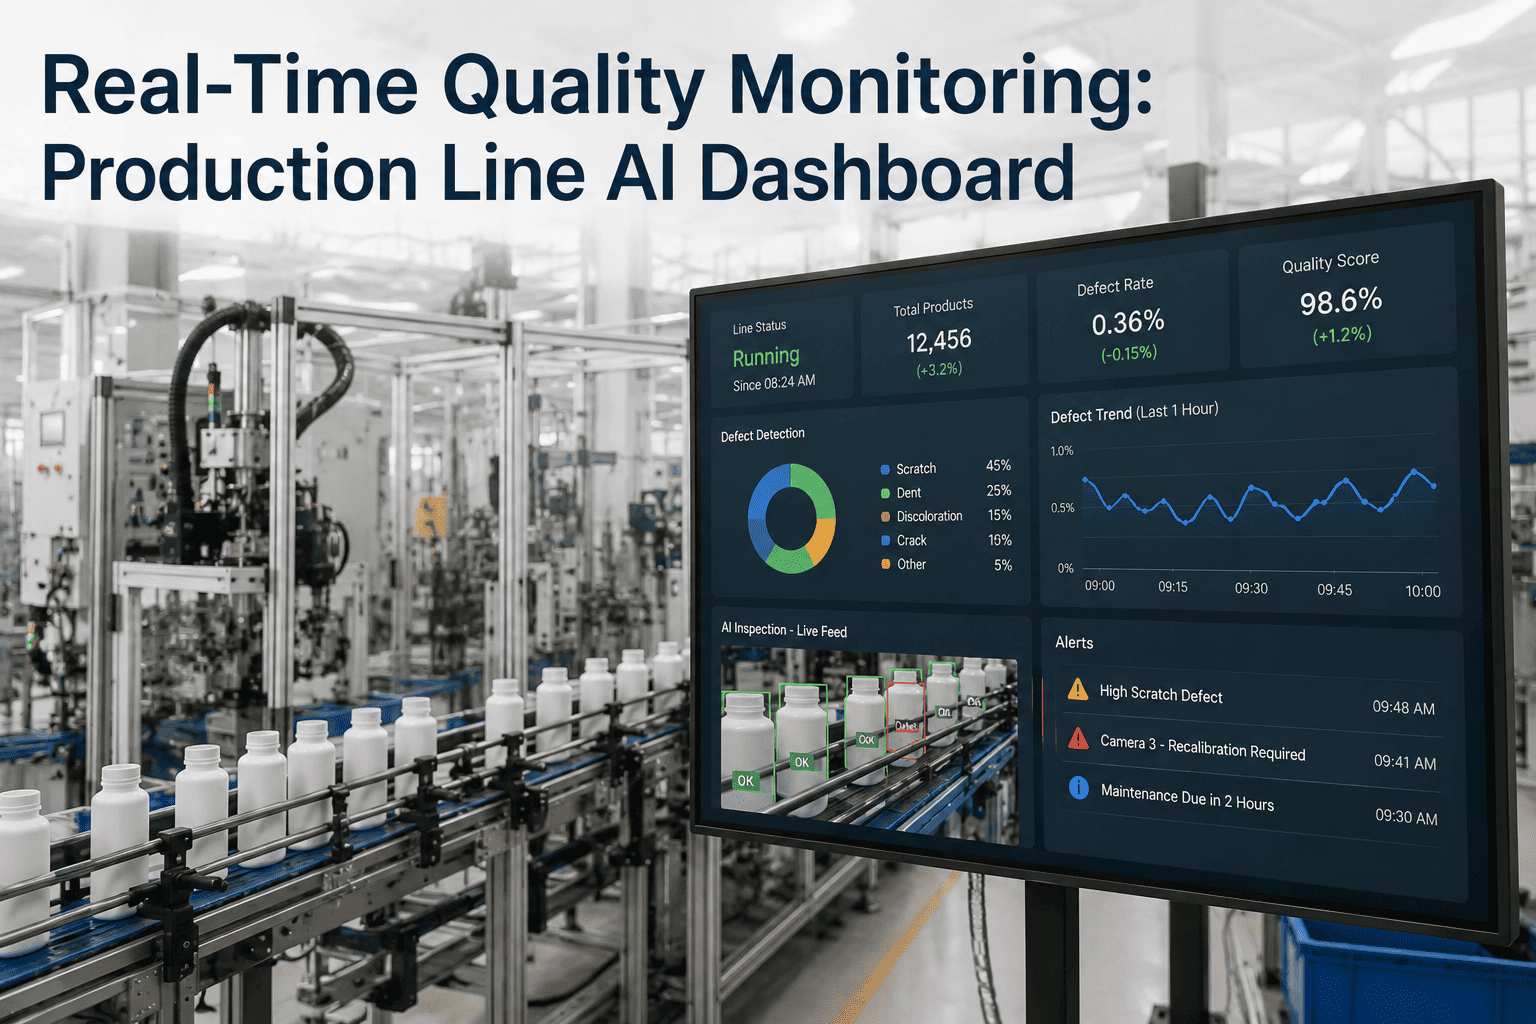
Percentage of units that pass quality inspection without rework. When quality data integrates with machine parameters and material lots, root cause analysis shifts from guesswork to data-driven correlation in minutes.

Mean Time Between Failures (MTBF)
Continuous vibration, temperature, and current monitoring feeds predictive maintenance models that extend MTBF by 30-50%. Condition-based triggers replace fixed-interval PM schedules, catching degradation before failure.

Cycle Time Variance
Comparing actual cycle times to programmed targets reveals where jobs run over or under estimates—improving future quoting accuracy and identifying process bottlenecks. Manufacturers returning quotes within two hours achieve 90%+ win rates.

Throughput & Takt Time
Live throughput tracking against takt time targets ensures production pace matches customer demand. Andon-style dashboards on the floor give operators immediate feedback on whether they are ahead, on target, or falling behind.

Energy Intensity (kWh/Unit)
Correlating energy consumption with production output identifies waste patterns invisible to monthly utility bills. Integrated energy data helps meet tightening ESG reporting requirements and reduces operational costs simultaneously.
Which KPIs are invisible in your current setup? Our engineers will map your data sources and show you which production metrics you can unlock within 30 days.
Schedule Free Demo

Connecting Every Layer of the Manufacturing Technology Stack

No single system holds all the data needed for complete production visibility. Integration must span every technology layer—from individual machine controllers to cloud-based business intelligence—to deliver a true single source of truth.

Enterprise Integration Matrix
Technology Layer Typical Systems Data Contributed Visibility Unlocked
Shop Floor Control PLCs, CNCs, robotics, drives Cycle counts, fault codes, axis positions, speeds Machine-level utilization and performance
Process Monitoring SCADA, DCS, HMI systems Temperature, pressure, flow, vibration, humidity Real-time process condition awareness
Execution Management MES, work order systems Order status, routing, labor, WIP tracking Production schedule adherence and traceability
Business Systems ERP (SAP, Oracle, NetSuite) Demand forecasts, BOM, cost, inventory Business context behind production decisions
Quality Assurance QMS, SPC, LIMS, CMM Inspection results, Cpk values, NCR logs Quality-production parameter correlation
Maintenance CMMS, EAM, condition monitoring Work orders, PM compliance, sensor health data Predictive maintenance and asset reliability

The Cost of Disconnected Systems vs. Integrated Operations

Understanding what manufacturers lose every day to data fragmentation puts the investment case for integration into sharp focus. The performance gap between siloed and integrated factories is not marginal—it is structural.

Operational Impact: Siloed Data vs. Unified Platform
Fragmented / Siloed Data
  • Reports arrive hours or days after production events
  • Operators toggle between 5+ disconnected screens
  • Root cause analysis requires manual data gathering
  • Scheduling conflicts cascade undetected
  • OEE calculated from estimates and operator memory
5-20% hidden capacity loss from data blind spots
Unified Integration Platform
  • Live dashboards refresh every second
  • Single pane of glass across all data sources
  • AI-powered root cause analysis in minutes
  • Real-time scheduling with live machine status
  • Automated OEE from actual machine signals
15-22% average OEE improvement with integrated visibility
Bridge the Visibility Gap Across Your Plant Floor
iFactory connects your machines, MES, ERP, quality, and maintenance systems into one real-time intelligence layer—so every team member sees the production truth, not yesterday's best guess.

Industry-Specific Integration Strategies for Manufacturing Sectors

Each manufacturing vertical presents unique data integration challenges—different equipment ecosystems, regulatory requirements, and production models require tailored connectivity strategies to achieve full visibility.

Integration Priorities by Manufacturing Sector
Sector Core Data Sources Critical Visibility Needs Integration Focus
Automotive Robots, vision, torque, conveyors Takt adherence, genealogy, first-pass yield MES-ERP sync, build traceability chains
Electronics SMT, AOI, reflow, functional test Component traceability, defect clustering SPC-MES bridge, supplier lot correlation
Food & Beverage Batch, filling, CIP, lab instruments Batch genealogy, allergen control, yield LIMS-MES link, recall readiness automation
Pharma / Life Sciences Clean rooms, chromatography, packaging 21 CFR Part 11, electronic batch records Audit trail integrity, deviation workflows
Metals & Heavy Industry Furnaces, rolling mills, heat treatment Energy intensity, metallurgical quality SCADA-historian bridge, energy dashboards
Discrete / Job Shops CNC, CMM, manual stations Job status, utilization, quoting accuracy ERP-scheduler sync, real-time job tracking

Measurable ROI: What Integrated Factories Actually Achieve

The business case for factory data integration is built on documented outcomes from manufacturers who have moved from siloed reporting to unified, real-time visibility. These results compound over time as AI models mature and teams embed data-driven decision-making into daily operations.

Documented Outcomes from Integrated Manufacturing Operations

22%
Average improvement in OEE through automated data collection and real-time visibility

30-50%
Reduction in unplanned downtime with predictive maintenance driven by integrated sensor data

60%
Faster root cause analysis when quality, machine, and process data are correlated automatically

25-40%
Lower maintenance costs by shifting from reactive and calendar-based to condition-based strategies
What could integration unlock at your plant? Our team will model the ROI for your specific equipment, production lines, and operational model—so you can see the business case before you commit.
Get Your ROI Assessment

Step-by-Step Deployment: From Pilot Line to Plant-Wide Visibility

Successful data integration projects follow a phased deployment model that delivers quick wins on a pilot line before scaling across the facility. This approach manages risk, builds organizational confidence, and ensures each phase funds the next.

Proven Implementation Roadmap


Week 1 – 3
Discovery & Data Audit
Map every data source—PLCs, historians, MES, ERP, quality systems. Identify integration gaps, KPI requirements, and dashboard specifications. Define the pilot line scope.


Week 4 – 6
Connect & Normalize
Deploy edge connectors and protocol adapters on pilot line equipment. Establish data normalization rules, validation logic, and the unified data model. Integrate MES and ERP feeds.


Week 7 – 9
Visualize & Validate
Launch real-time dashboards for pilot line KPIs. Configure automated alerts and escalation rules. Validate data accuracy against known production records before trusting the system.

Week 10+
Scale & Optimize
Expand integration to additional lines, cells, and facilities using proven templates. Enable AI-driven analytics, predictive models, and closed-loop automation as the data foundation matures.

Overcoming the Biggest Barriers to Factory Data Integration

Every integration project encounters friction from legacy infrastructure, organizational silos, and the sheer diversity of industrial protocols. Knowing the obstacles in advance—and having proven playbooks to address them—is the difference between a stalled pilot and plant-wide transformation.

Common Challenges and Proven Playbooks
Barrier Operational Impact Proven Resolution
Legacy machines without digital outputs Critical equipment invisible to analytics Retrofit IoT sensor kits and signal converters; edge gateways translate analog to digital without modifying control systems
250+ incompatible industrial protocols No single platform reads all machine data Universal protocol adapters with OPC-UA normalization layer; one connector library covers the entire floor
Poor data quality from manual entry False alerts, unreliable KPIs, eroded trust Automated validation, anomaly detection, and gap-filling at the edge before data reaches the analytics layer
IT and OT organizational divide Competing priorities slow every integration decision Cross-functional integration team with shared KPIs; unified data governance framework bridges both worlds
Scaling beyond the pilot plant Visibility stuck at one facility despite multi-site needs Cloud-native architecture with standardized data models; template-based deployment replicates proven patterns fast
Turn Every Machine Signal into a Smarter Decision
Your factory floor is already generating the data you need. The missing piece is a platform that connects it all—PLCs, MES, ERP, quality, and maintenance—into a live intelligence layer your entire team can act on. iFactory makes every data point visible, contextual, and actionable from day one.

Frequently Asked Questions

How quickly can a data integration platform deliver measurable results?
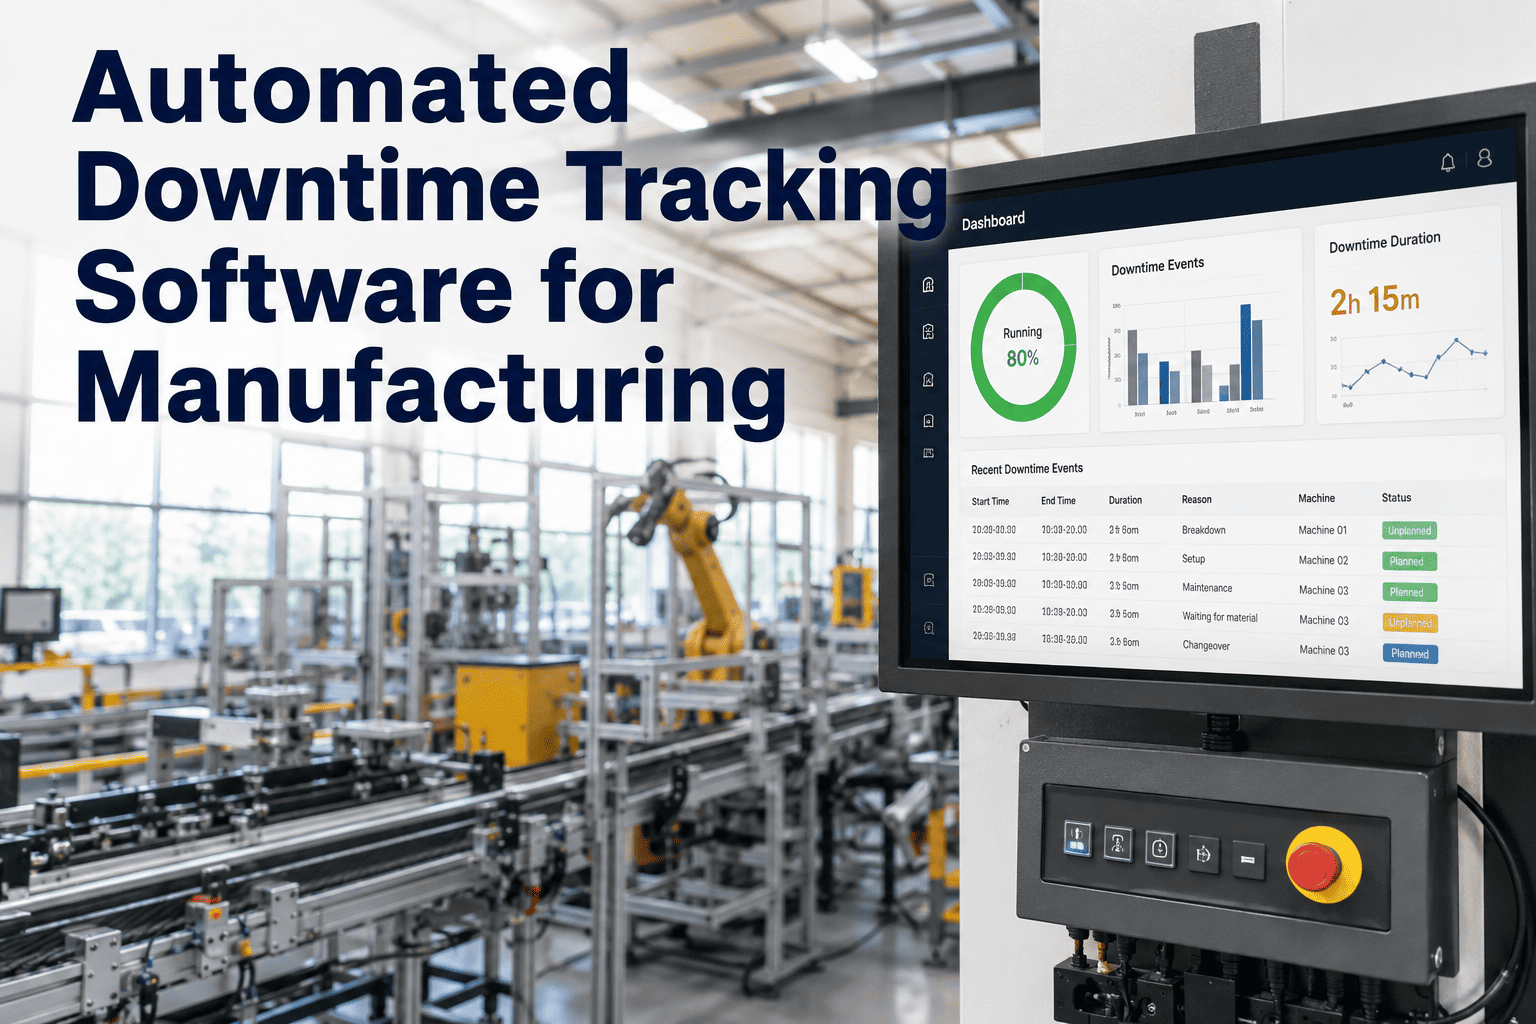
Most manufacturers see meaningful visibility improvements within 30 days of connecting critical systems on a pilot line. Live OEE dashboards, automated downtime tracking, and real-time throughput monitoring deliver immediate value. Deeper AI-driven analytics and predictive models typically mature over 3-6 months as the platform accumulates sufficient operational data for pattern recognition. Book a demo to see a 30-day deployment roadmap customized for your industry.
Can integration platforms connect to legacy equipment that lacks digital outputs?
Yes. Modern platforms support 250+ industrial communication protocols and offer retrofit solutions for older machines without native digital connectivity. IoT sensor kits, current transformers, vibration sensors, and signal converters can bring decades-old equipment into the data ecosystem without requiring replacement or modification of existing control systems. Edge gateways handle protocol translation automatically.
What is the difference between a data integration platform and an MES system?
An MES manages production execution—work orders, scheduling, routing, and labor tracking. A data integration platform connects all systems (including your MES) into a unified data layer for cross-domain analytics and real-time dashboards. Integration platforms complement your existing MES by correlating its data with machine signals, quality results, and maintenance records that the MES was never designed to access. Schedule a demo to see how integration enhances your existing MES without replacing your current technology stack.
How is data security handled in a connected factory environment?
Enterprise-grade security is embedded at every layer: edge-to-cloud encryption, role-based access controls, network segmentation between OT and IT zones, and SOC 2 Type II compliance. Edge processing keeps sensitive operational data on-premises when required, transmitting only authorized aggregated analytics to cloud systems through encrypted channels. According to Check Point Research, manufacturers face an average of 1,585 cyberattack attempts weekly—making layered security architecture essential.
Can the platform scale across multiple factories and geographic regions?
Absolutely. Cloud-native architecture and standardized data models enable template-based multi-site deployment. Once the integration pattern is proven at one facility, replication across additional plants is dramatically faster. Centralized dashboards deliver enterprise-wide visibility while each facility maintains local configurations and views. Schedule a demo to explore multi-plant rollout planning and see how enterprise-wide visibility works in practice.

Share This Story, Choose Your Platform!