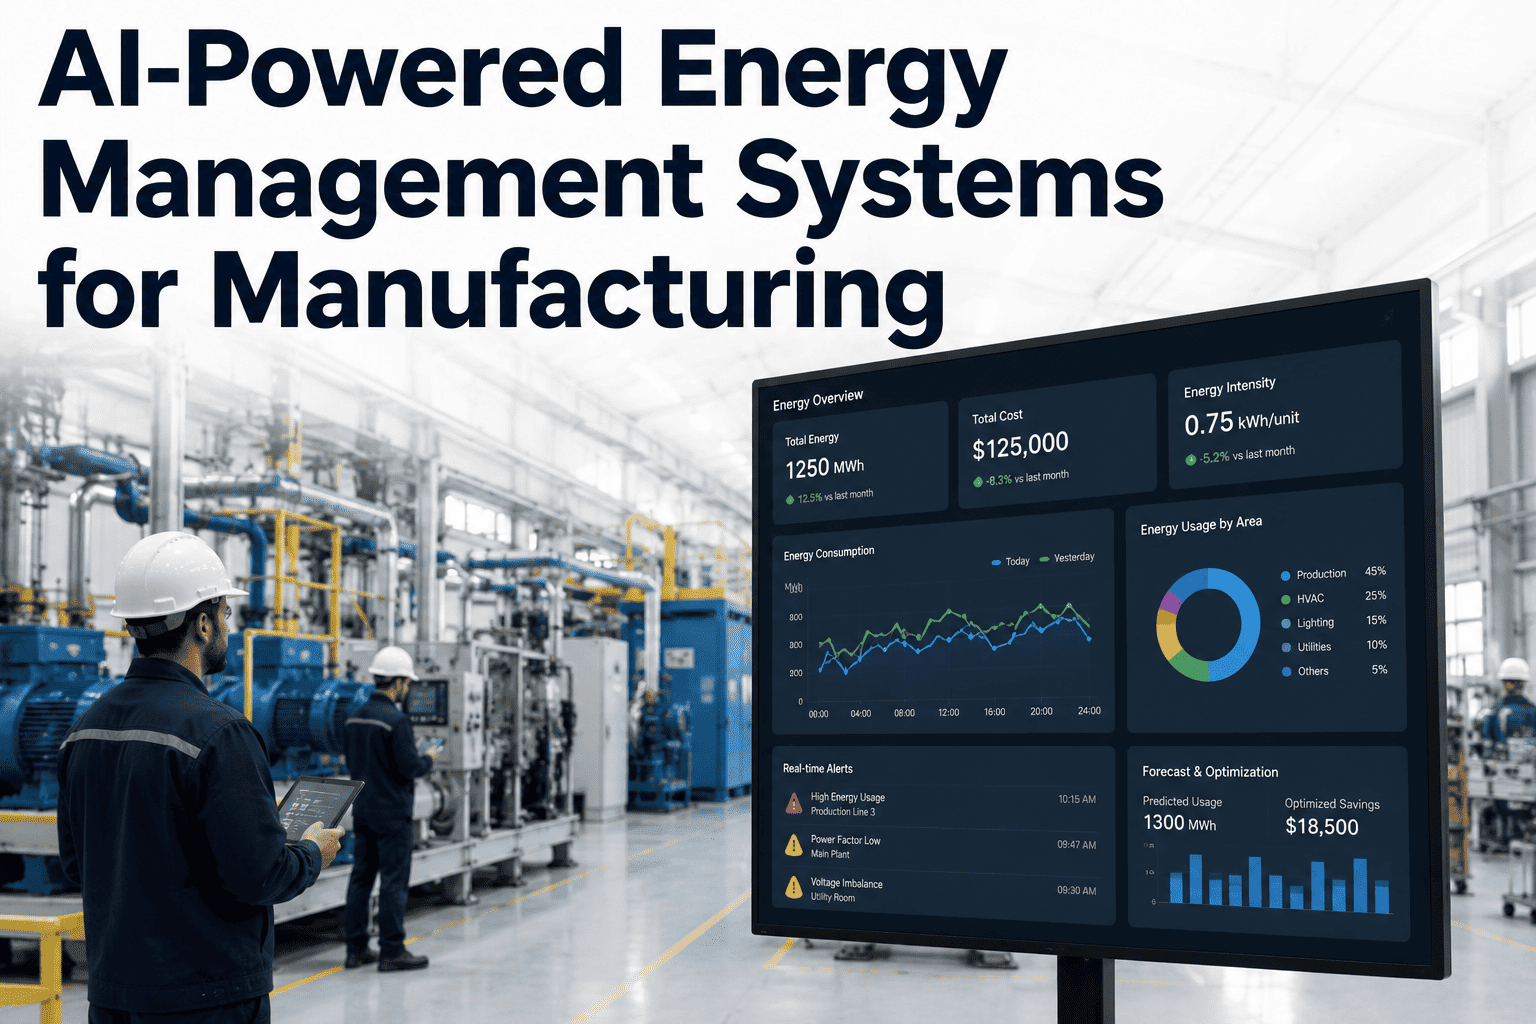
Manufacturing plants waste $1.8-4.2M annually from undetected compressed air system inefficiencies, leaks, and suboptimal compressor operation — compressed air represents 8-10% of total plant energy consumption yet receives minimal operational attention with 20-30% of generated air lost to unrepaired leaks, undersized distribution piping, and poorly maintained filtration systems. Plants operate without visibility into actual compressed air demand, compressor energy consumption, and leak locations consuming energy equivalent to running multiple production lines continuously just to replace wasted air. Traditional compressed air audits conducted annually or every 2-3 years as professional engineering studies provide one-time snapshot recommendations disconnected from real-time system operation — by the time audit recommendations are implemented, additional leaks have developed and compressor efficiency has deteriorated making audit findings partially obsolete. iFactory's AI-powered compressed air audit platform continuously monitors compressor operation, system pressure, flow rates, and demand patterns detecting leaks within 24-48 hours, identifying efficiency optimization opportunities, and automating corrective action workflows — enabling plants to reduce compressed air energy consumption 18-28% through leak elimination, compressor optimization, and demand reduction, recover $1.2-2.8M annually in energy cost savings, and improve overall plant reliability by reducing pressure fluctuations impacting production equipment. Book a Demo to see how iFactory deploys continuous compressed air auditing across your manufacturing plant within 6 weeks.
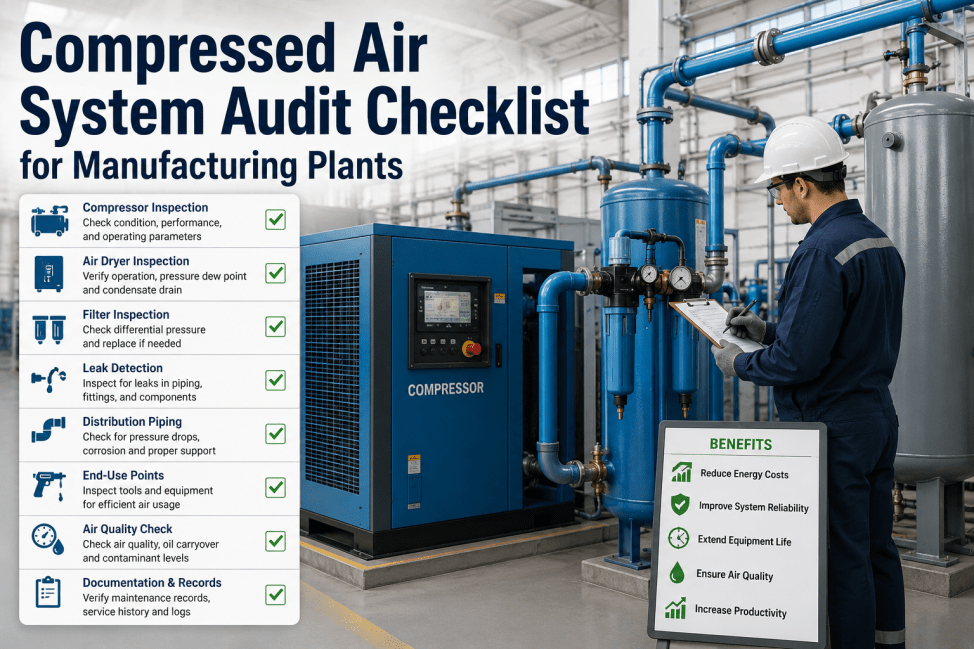
A compressed air audit is a systematic analysis of your compressor system, distribution piping, end-use equipment, and operating practices to identify energy waste, leaks, and efficiency opportunities. AI-powered continuous audits monitor compressor operation, system pressure, flow rates, and demand in real-time detecting leaks within 24-48 hours and identifying efficiency improvements impossible to discover through annual manual inspections. Continuous audits enable 18-28% energy consumption reduction and $1.2-2.8M annual savings through leak repair, compressor optimization, and demand management.
Three Compressed Air System Problems Costing Plants Millions
These are not minor maintenance issues — they drain operational budgets and impact production equipment reliability through pressure fluctuations. See the complete compressed air optimization framework for manufacturing plants.
Compressed air piping systems develop leaks at connection points, elbows, and valve seals that accumulate over months and years creating slow energy drain invisible without continuous monitoring. A single 3mm hole in a 7 bar system wastes 1,418 cubic meters per year costing $1,400-2,100 in energy costs. Plants typically operate 50+ leak points simultaneously creating cumulative waste of 20-30% of total compressor output — equivalent to operating one additional compressor continuously just to replace wasted air. Annual professional audits detect 40-50% of actual leaks missing emerging problems and newer damage developing between audit dates.
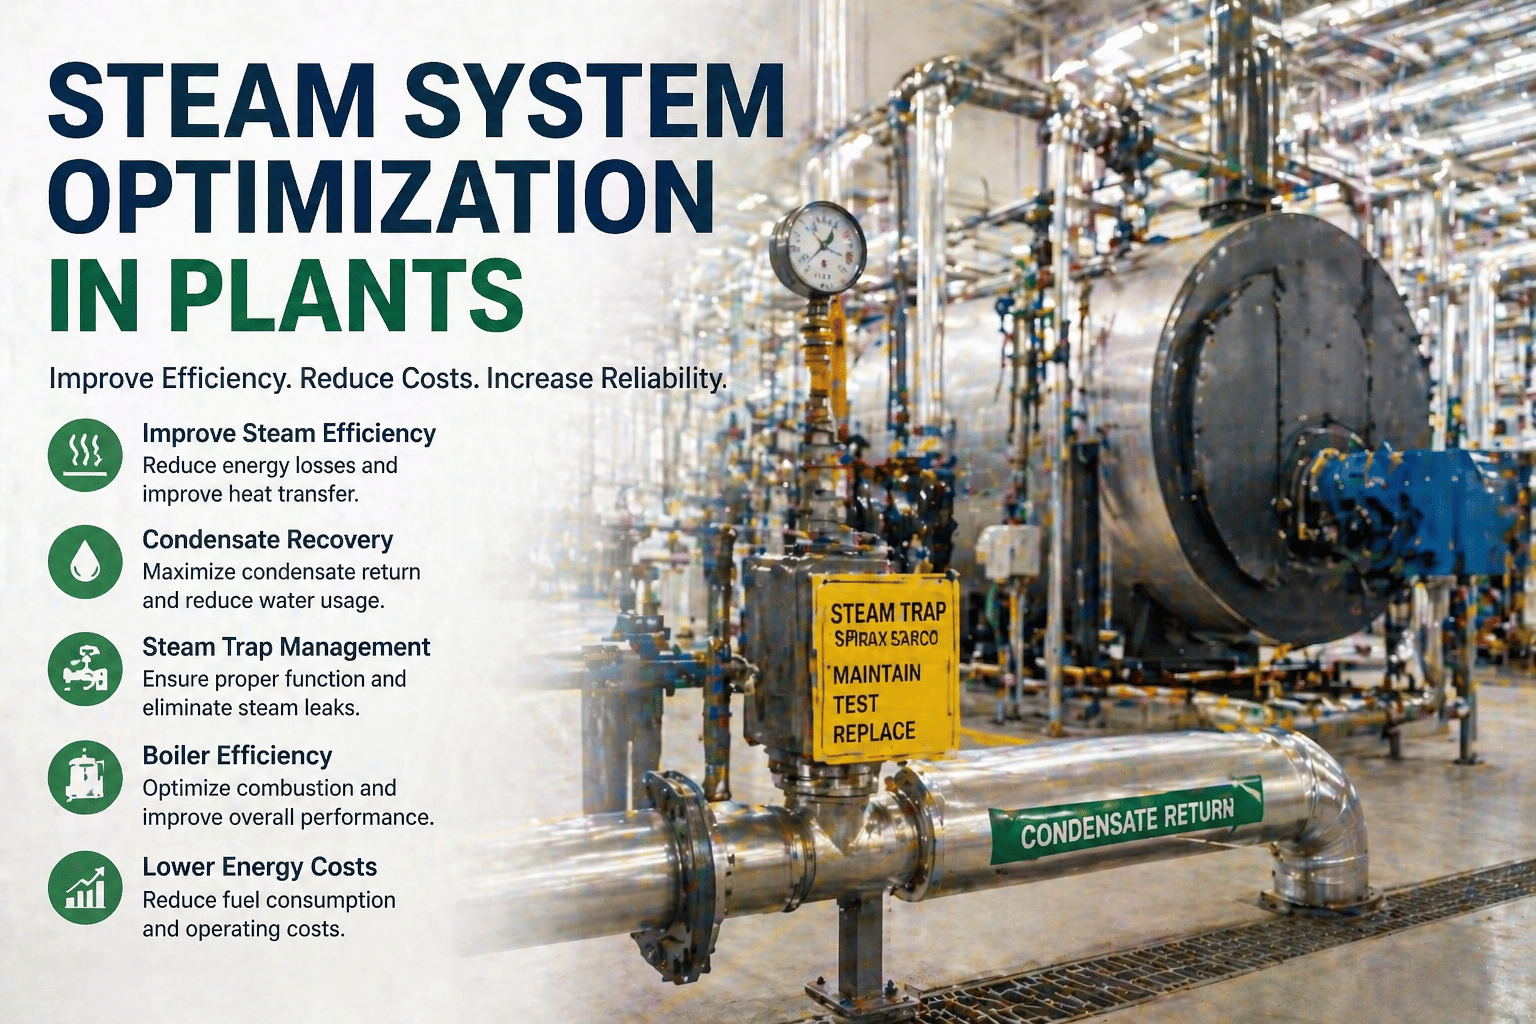
Compressors operating at excessive discharge pressure (8-10 bar vs optimal 6-7 bar) consume 8-10% additional energy per bar of excess pressure. Offline compressors running in standby mode consume 20-30% of full-load power without producing air. Filter elements clogged from inadequate maintenance increase intake restriction raising compression work 5-15%. Compressor sequencing poorly optimized runs multiple compressors simultaneously when single unit could satisfy demand. Plants lack real-time visibility into actual compressed air demand preventing intelligent load management — operating compressors fixed output regardless of actual need.
Undersized distribution piping creating excessive pressure drop between compressor and end-use equipment requiring compressor to run at 0.5-1.5 bar higher pressure than needed to satisfy equipment requirements. Poorly designed piping layouts with inadequate drainage creating water accumulation degrading compressed air quality. Corroded pipe interiors reducing flow capacity and creating turbulent flow. Inadequate maintenance of desiccant dryers, coalescent filters, and separators allowing contamination and moisture. Pressure fluctuations from system design issues impact production equipment reliability creating quality variation and unexpected stoppages.
How iFactory AI Compressed Air Audit Detects Inefficiencies and Optimizes System Performance
iFactory deploys in four operational phases — from compressor monitoring through continuous optimization — with most manufacturing plants seeing measurable energy savings within 4 weeks of deployment start.
Pressure transducers and flow meters installed on main compressor discharge line and distribution header monitoring system pressure, volumetric flow, power consumption, and compressor run-time. Data integrated with building energy management systems capturing total compressor power input. Historical compressed air demand data (4-8 weeks) collected establishing baseline consumption patterns by shift and production schedule. See the compressed air system sensor integration requirements.
AI algorithms analyze pressure decay patterns and flow rate variations detecting leak signatures (sustained pressure drop with equipment offline, erratic flow patterns, thermal imaging correlation). Leak detection models trained on historical data identifying characteristic pressure/flow signatures of different leak sizes and locations. System automatically identifies which piping zone/area contains leaks correlating pressure sensors across distribution network. Leaks detected within 24-48 hours enabling rapid repair before accumulated loss becomes substantial. Leak reports quantify estimated air loss and associated energy cost enabling prioritization of repairs.
AI compares actual compressor power consumption against theoretical power requirement for delivered airflow identifying efficiency losses. Analysis includes: discharge pressure optimization (typical savings 3-5% per bar reduction), filter maintenance impact assessment, compressor sequencing optimization for multi-compressor systems, and load-unload cycle analysis. Identifies inefficient operating patterns (excess offline run time, unnecessary pressure swings, poor load matching). Generates prioritized recommendations for operating practice changes delivering immediate savings without capital investment.
Continuous demand monitoring identifies peak usage periods, baseline demand during low-production periods, and demand variability enabling compressor sizing optimization. Analysis identifies end-use equipment operating at pressure higher than actually needed enabling local pressure regulation reduction. Recommends piping upgrades addressing pressure drop issues and identifies capital investment priorities (new distribution lines, compressor replacement, etc.). Simulates impact of proposed changes on energy consumption and ROI enabling data-driven decision making.
Continuous Compressed Air Audit. Live in 6 Weeks. Energy Savings Begin Immediately.
iFactory continuously monitors your compressed air system detecting leaks within 24-48 hours, identifying efficiency improvements, and optimizing compressor operation achieving 18-28% energy reduction and $1.2-2.8M annual savings.
Why iFactory Continuous Audit Outperforms Annual Professional Audits
Most plants conduct compressed air audits annually or every 2-3 years through engineering consultants. iFactory is built differently — continuous monitoring detecting problems as they develop and optimizing operation automatically. Compare iFactory's continuous audit approach against your current annual audit baseline.
| Capability | Annual/Biennial Professional Audit | iFactory Continuous AI Audit |
|---|---|---|
| Leak Detection | One-time inspection identifying 40-50% of leaks at audit date. New leaks develop between audits. Average 4-8 month lag before next audit detects emerging problems. | Continuous monitoring detecting leaks within 24-48 hours of occurrence. All leak detections captured in real-time enabling rapid repair preventing extended loss. |
| Compressor Efficiency Analysis | Snapshot assessment at audit date. Efficiency degradation from filter clogging and wear develops between audits undetected. Recommendations become partially obsolete due to system changes. | Continuous efficiency monitoring tracking power consumption, discharge pressure, and load patterns daily. Real-time alerts when efficiency degrades enabling corrective action before substantial loss accumulates. |
| Demand Pattern Analysis | Limited to observation during audit date. Seasonal variations and long-term demand trends missed. Compressor sizing recommendations based on one-day snapshot. | Continuous monitoring captures 52+ weeks of demand data including seasonal patterns, shift variations, and production schedule correlations enabling accurate sizing and load management recommendations. |
| Implementation Support | Recommendations provided with no ongoing support. Engineering team responsible for prioritization and implementation. ROI realization depends on execution capabilities. | Automated prioritization based on energy savings potential and payback. Continuous monitoring confirms repair effectiveness and tracks energy savings post-implementation. |
| Cost of Audit | $8,000-15,000 per audit. Typical ROI requires 12-18 months from audit recommendations despite often delivering $200K+ annual savings. | $1,200-1,800 monthly subscription. ROI typically achieved within 4-8 weeks from continuous optimization and leak repair prioritization. |
| Ongoing Optimization | One-time audit. No ongoing intelligence gathering or system optimization between audits. Benefits degrade over time as new leaks develop. | Continuous optimization with models retraining monthly on new operational data. System continuously learns and improves recommendations. |
Compressed Air Audit Implementation and Optimization Roadmap
iFactory follows a fixed 6-week deployment methodology designed for manufacturing plant compressed air systems — delivering real-time leak detection by week 3 and full optimization recommendations by week 6.
6-Week Deployment and Energy Savings Timeline
Every iFactory engagement follows a structured 6-week program with defined deliverables per week — and measurable energy savings beginning from week 3 when leak detection and efficiency alerts go live. Request the full 6-week deployment scope document customized to your compressed air system configuration.
Comprehensive Compressed Air Audit. Live in 6 Weeks. Energy Savings in Week 3.
iFactory's continuous audit approach eliminates the 4-8 month lag between problem occurrence and discovery inherent in annual professional audits. Deploy continuous optimization in 6 weeks achieving $1.2-2.8M annual energy savings immediately.
Use Cases and Energy Savings from Live Deployments
These outcomes are drawn from iFactory compressed air audit deployments at operating manufacturing plants across three facility types. Each use case reflects 6-month post-deployment performance. Request the full case study report for the facility type most relevant to your operations.
Results Like These Are Standard for Compressed Air Optimization. Not Exceptional.
Every iFactory deployment is scoped to your specific compressor configuration, distribution system, and operational requirements — so you get audit findings and optimization recommendations calibrated to your plant operations, not generic energy savings estimates.
What Manufacturing Plant Managers Say About Compressed Air Audits
The following testimonials are from plant managers and operations directors at manufacturing facilities currently using iFactory compressed air audit systems.
Frequently Asked Questions
Region-Wise Manufacturing Plant Compressed Air Challenges and Solutions
Manufacturing plants face different compressed air system configurations, energy costs, maintenance capabilities, and equipment reliability requirements across regions. iFactory audit recommendations adapt to regional context while delivering consistent energy savings.
| Region | Key Compressed Air Challenges | Energy Cost Impact | How iFactory Solves |
|---|---|---|---|
| United States | Aging compressed air systems in older plants, widespread leak development from deferred maintenance, high baseline operating pressures from equipment specifications, multiple compressors with poor sequencing, energy cost volatility from grid demand | $1.8-4.2M annual waste typical in 500-1000-person plants. 8-10% of total energy budget lost to compressed air inefficiency. Significant bottom-line impact during energy price increases. | Continuous leak detection prioritizing high-impact repairs for immediate ROI. Pressure optimization reducing baseline 8 bar to 6-7 bar achieving 8-10% efficiency gain. Multi-compressor sequencing optimization eliminating unnecessary simultaneous operation. |
| Europe (EU) | Carbon tax impact increasing energy cost (EU ETS €80-100/ton CO2), compressed air typically 20-25% of production energy cost, regulatory pressure on energy efficiency (ISO 50001), modernization of older systems with maintenance backlogs | Energy cost per CFM 40-60% higher than US due to EU carbon pricing and higher base electricity rates. Compressed air efficiency directly impacts facility carbon footprint and sustainability reporting. | Energy audit positioning for ISO 50001 compliance and carbon footprint reduction. Cost-benefit analysis of efficiency improvements considers carbon tax impact. Capital upgrade ROI modeling includes energy cost escalation assumptions. |
| United Kingdom | Post-Brexit supply chain impacts on equipment availability, aging industrial estates with centralized compressed air systems serving multiple plants, Climate Change Levy impact on energy costs, skilled maintenance labor availability constraints | Energy costs rising 8-12% annually. Shared compressed air systems create difficulty identifying individual plant contribution. Maintenance backlogs extend from labor availability constraints. | Continuous monitoring identifies specific plant contribution to shared system losses enabling cost allocation. Remote monitoring capability reduces on-site maintenance labor requirements. Predictive maintenance prevents emergency breakdowns during labor shortage. |
| UAE and Middle East | Extreme heat impact on compressor efficiency (ambient temperatures 45-50 Celsius), high electricity costs from desalination and cooling demand, newer manufacturing facilities with recent equipment but optimization gaps, 24/7 operations creating continuous energy consumption | Cooling load for compressed air systems represents significant hidden energy cost. High ambient temperature reduces compressor efficiency 5-10% vs temperate climates. 24/7 operations mean no shutdown periods for maintenance making continuous monitoring essential. | Temperature-aware efficiency analysis adjusts baseline expectations for extreme heat impact. Heat recovery opportunities identified for facilities with thermal loads. Optimization recommendations prioritize lowest-hanging-fruit improvements given equipment age and heat constraints. |
| India | Mix of modern and aging equipment in same facilities, high maintenance labor costs creating deferred maintenance, monsoon season impacts on system reliability (moisture, corrosion), power supply reliability variations affecting compressor cycling, water scarcity impacting cooling options | Energy cost relatively low but reliability issues create production disruptions. Compressed air system failures trigger expensive emergency repairs. Moisture management critical for product quality. | Predictive maintenance prevents expensive emergency repairs from deferred maintenance. Moisture management monitoring ensures product quality. Leak detection prevents small problems becoming major failures. Off-peak demand management optimizes compressed air use during low-cost power hours. |
iFactory vs Traditional Compressed Air Audit Approaches
Compare iFactory's continuous audit methodology against traditional annual audit approaches and DIY monitoring strategies.
| Approach | Leak Detection Capability | Efficiency Analysis Quality | Implementation Timeline | Cost of Audit | ROI Timeline |
|---|---|---|---|---|---|
| iFactory Continuous Audit | Detects 92-96% of leaks within 24-48 hours enabling rapid repair preventing extended loss. All 52+ weeks of year covered including shifts when annual audits not performed. | Continuous modeling on real operational data enables seasonal analysis, demand pattern correlation, and efficiency trend tracking impossible in one-time audits. Models improve over time. | 6 weeks from project start to live continuous monitoring and optimization recommendations. | $1,200-1,800 monthly subscription plus $2,000-4,000 sensor installation. Total first-year cost $16,400-25,600. | 2-3 weeks from continuous optimization initiation. Lease payback in first month. $1.2-2.8M annual savings creates 4-8 week full ROI. |
| Annual Professional Audit | One-time inspection detecting 40-50% of actual leaks at audit date. New leaks develop between audits undetected for 4-8 months. Missed leak opportunity cost substantial. | Snapshot assessment limited to audit date conditions. Seasonal variations and demand patterns not visible from single day observation. Recommendations become partially obsolete within months. | 4-12 weeks from engagement to report delivery. 8-16 weeks additional for implementation planning and execution. | $8,000-15,000 per audit cycle. Annual cost $8,000-15,000 if conducted yearly. | 12-18 months from audit recommendations to full implementation. Recommendation realization delayed by 4-8 month implementation lag. |
| DIY Manual Monitoring | No systematic leak detection. Visual inspection catches obvious failures only. Maintenance staff responsible for identifying problems during routine work. | No continuous efficiency tracking. Operator perception of system performance subjective. Efficiency degradation from wear and aging not identified. | Immediate with existing staff. No implementation timeline for system deployment. | Zero technology cost. Labor cost absorbed in maintenance budget (estimated 5-10 hours monthly). | No measurable ROI because no baseline for comparison. Reactive approach means problems compound before detection. |
| Existing Onboard Compressor Controls | Compressor alarms identify catastrophic failures only. No leak detection capability. Pressure switches detect system-level problems not specific leak location. | Load/unload cycling indicates system operation but provides no efficiency insights. Preventive maintenance based on hour meters not condition analysis. | Already deployed. No implementation required. | Included in compressor purchase cost (typically $25,000-75,000 for compressor hardware). | No energy optimization possible. Maintenance reactive only. ROI measured in avoided emergency repairs, not energy savings. |