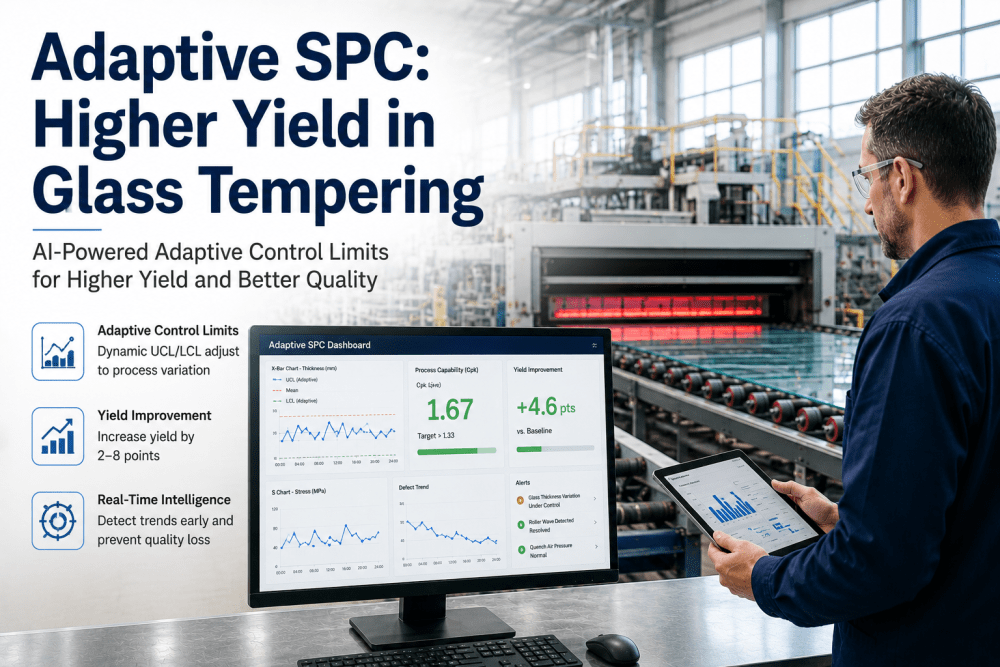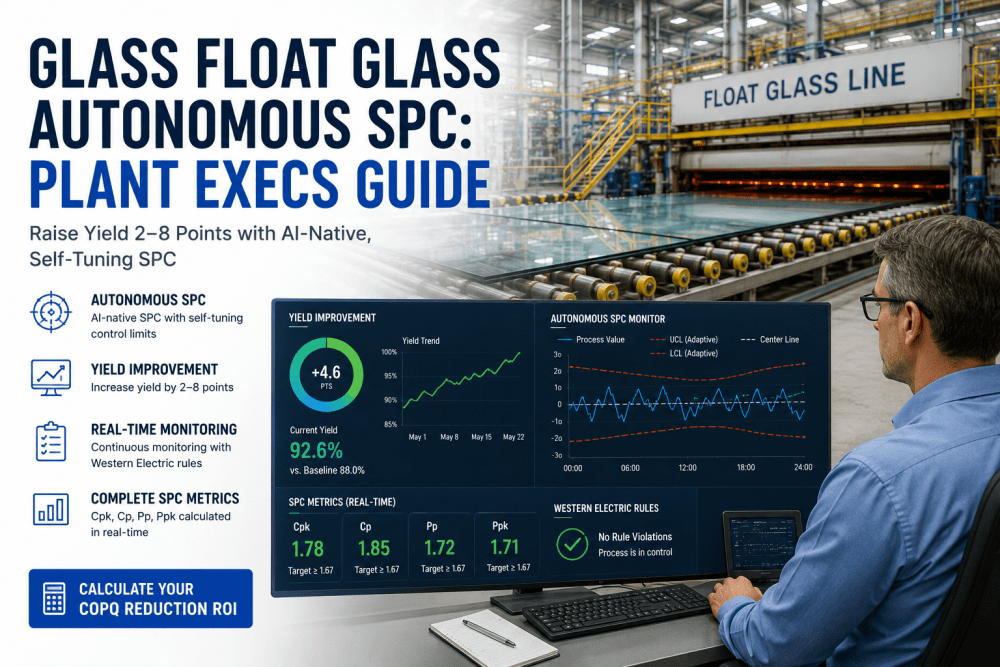
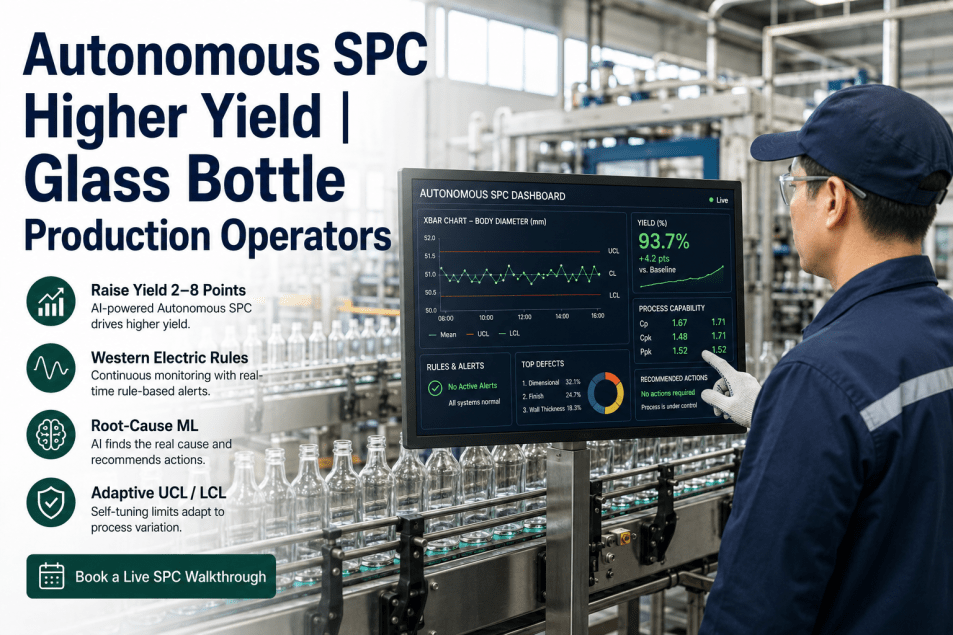
Float glass manufacturing operates on razor-thin margins where a one-percentage-point yield improvement directly translates to hundreds of thousands of dollars in annual profit. Yet most float lines still rely on fixed-limit SPC charts calculated once during commissioning and applied uniformly across all product types, thicknesses, pull rates, and recipes — regardless of how different those operating states actually are. Autonomous SPC replaces static control limits with AI-driven, self-tuning control charts that continuously learn from live process data, detect drift before defects form, and automatically adjust to each product-state condition. For plant executives evaluating quality technology investments, autonomous SPC represents the highest-leverage opportunity for yield improvement — delivering 2 to 8 percentage points of yield gain without new inspection hardware or control system modifications. Book a Demo to see how iFactory's Autonomous SPC Platform calculates yield improvement projections for your specific float line configuration.
01 / The Yield Challenge — Why Fixed SPC Limits Leave Yield on the Table
Float glass yield loss cascades from a single root cause: control limits that do not reflect current process conditions. A fixed SPC limit calculated during steady-state production of 2.3 mm architectural glass will generate false alarms during a changeover to 5 mm automotive glass, triggering unnecessary process adjustments that introduce real variation. The same fixed limit will be too wide during steady-state production of 6 mm glass, allowing genuine drift to go undetected until defects reach the cold-end inspection station. The table below compares how fixed and autonomous SPC approaches perform across the float glass process states that determine yield.
| Process Condition | Fixed SPC Limits | Autonomous SPC Limits | Yield Impact |
|---|---|---|---|
| Steady-State Production | Limits fixed at historical baseline — too wide for current capability, allowing drift to develop undetected | Limits narrow to tightest demonstrated range for that product-thickness-pull rate combination | Earlier drift detection — 30% reduction in defect severity at cold-end inspection |
| Product Changeover | Limits unchanged — generates false alarms from expected process shift during ribbon width and thickness transition | Limits automatically widen to accommodate changeover variation — zero false alarms during transitions | Eliminates unnecessary process adjustments that introduce real variation and reduce first-quality yield |
| Pull Rate Variation | Limits ignore pull rate — same control band at 400 t/d and 600 t/d despite different process dynamics | Limits adjust in real time to pull rate changes — tighter bands at stable rates, wider during ramps | Maintains Cpk 1.67+ across all pull rate conditions — no yield degradation during rate changes |
| Recipe or Color Change | Limits unchanged — iron content and colorant variations generate false SPC signals on furnace parameters | Limits learn recipe-specific variation patterns — distinguishes normal color chemistry shift from genuine drift | Reduces false alarm rate by 90%+ during color campaigns — less operator fatigue, better response to real signals |
02 / Autonomous SPC Architecture — Self-Tuning Control Charts for Every Process State
Autonomous SPC combines machine learning classification, real-time process data streaming, and closed-loop work order automation into a platform that continuously optimizes quality performance. The architecture classifies each minute of production into its operating state — product type, thickness, pull rate, recipe — and applies a dedicated control limit model trained specifically for that state. The result is control limits that are always tuned to the process's real capability at every moment. Book a Demo to explore the architecture in detail.
The self-tuning limit engine ingests real-time process data from furnace crown thermocouples, tin bath temperature sensors, lehr zone controllers, and inline inspection systems — typically 200 to 500 data points per minute per float line. For each operating state, the engine calculates optimal upper and lower control limits using a combination of statistical process capability analysis (Cp, Cpk, Pp, Ppk) and machine learning anomaly detection. The limits automatically narrow during stable production to provide the tightest possible control band for yield protection, and automatically widen during transitions to prevent false alarms. The continuous learning loop refines limit settings based on downstream quality data — if a defect is detected at cold-end inspection, the engine traces the root cause operating state and adjusts the limits for that state to provide earlier warning in future cycles.
Real-time process intelligence operates at two levels. At the variable level, each monitored parameter — crown temperature, oxygen trim, tin bath gradient, lehr zone temperature, ribbon thickness — has its own autonomous control chart that displays the current value, dynamic control limits, and a predictive drift indicator that projects when the variable will approach the control limit if current trends continue. At the process level, a correlation engine analyzes cross-variable interactions — detecting patterns such as a furnace crown temperature shift that historically preceded tin bath gradient instability, which historically preceded dimensional variation at the cold end. The correlation engine generates predictive alerts that give operators 15 to 45 minutes of advance warning before a quality deviation occurs, compared to the 2 to 5 minutes available from fixed-limit SPC systems that detect variation only after the control limit is breached.
When autonomous SPC detects a process deviation that requires action, the platform does not stop at generating an alert — it initiates a closed-loop corrective workflow. The deviation is automatically correlated with the specific operating state, process variable, and equipment zone. A work order is generated in the connected CMMS with the deviation data, recommended corrective action based on historical resolution patterns, and priority assignment based on the projected yield impact if the deviation is not addressed. The platform tracks the corrective action through completion and validates that the process returns to the expected control band. If the deviation is not resolved within the configured time window, an escalation alert is sent to the shift supervisor and plant executive dashboard. This closed-loop capability transforms autonomous SPC from a monitoring tool into a yield management system that drives measurable quality outcomes.
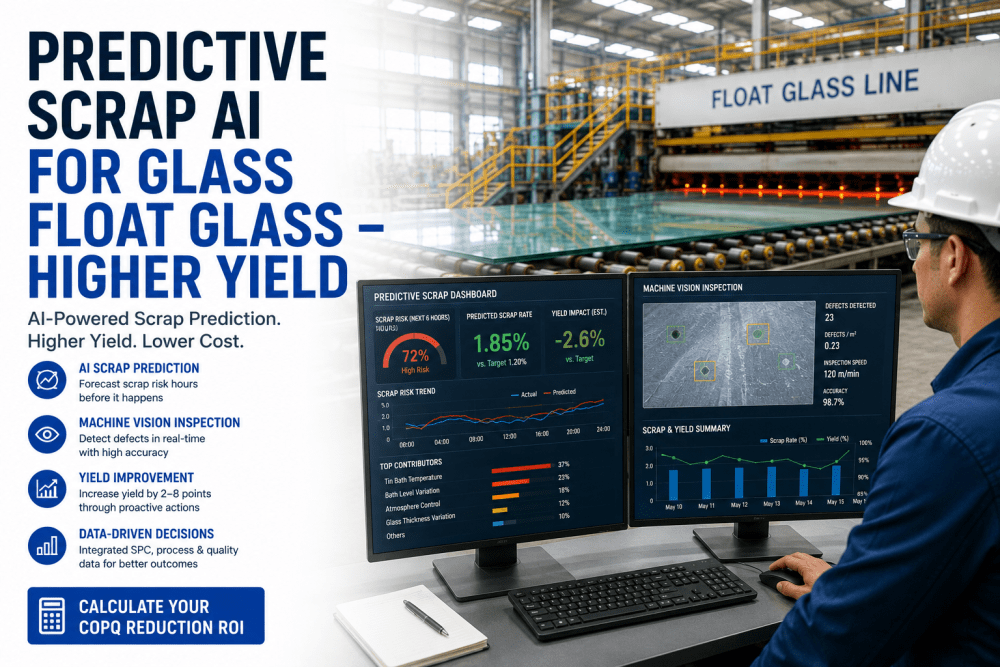
03 / Measured Yield Impact — Documented Results Across Float Glass Production Zones
Yield improvement from autonomous SPC is not theoretical. Float glass facilities deploying the platform have documented consistent yield gains across every production zone. The table below summarizes the measured impact from a 16-week deployment across two float lines producing architectural and automotive glass products. Book a Demo to review the full deployment case study and yield improvement projection for your float line.
| Production Zone | Primary Yield Improvement | Secondary Impact | Time to Measurable Result |
|---|---|---|---|
| Melting Furnace | 2.1 percentage point yield gain from tighter crown temperature and combustion control — reduced bubble and stone defects | 5.8% reduction in specific energy consumption per tonne — tighter control reduces thermal cycling | 4 weeks |
| Tin Bath | 3.4 percentage point yield gain from improved gradient stability — reduced tin pickup and ream defects | 92% reduction in false bath alarms — operators respond to real drift signals, not normal variation | 6 weeks |
| Annealing Lehr | 2.8 percentage point yield gain from product-specific cooling profiles — reduced residual stress and breakage | Lehr zone temperature variability reduced 24% — more consistent annealing across product types | 3 weeks |
| Cold-End Inspection | Overall yield improvement 3.7 percentage points — cumulative benefit from upstream autonomous control | Scrap rate reduced 18% — fewer off-spec products reaching cold-end inspection | 8 weeks (full cascade) |
Expert Review — What a Float Glass Quality Leader Says About Autonomous SPC
I have managed quality systems in float glass for 18 years across four plants producing architectural, automotive, and specialty glass products. When our executive team directed us to evaluate autonomous SPC, I was skeptical — our fixed-limit SPC charts had been in place for over a decade, and I believed the issue was operator compliance, not control limit accuracy. The 16-week pilot proved me wrong. The autonomous limits detected furnace drift an average of 27 minutes earlier than our fixed limits, and they eliminated the false alarm problem that had been eroding operator trust in the SPC system for years. The 3.7 percentage point yield improvement was the headline number, but the operational impact was equally significant — our quality team shifted from investigating false alarms to analyzing real process improvement opportunities. What I tell other quality leaders is that if you have been managing float glass quality with fixed-limit SPC charts, you are operating with one hand tied behind your back. The autonomous platform does not replace quality expertise — it amplifies it by showing your team what actually needs attention and what is normal process variation that they can safely ignore.
Conclusion — Autonomous SPC Is the Highest-Leverage Yield Improvement Investment Available to Float Glass Plants
Fixed-limit SPC charts are not broken — they were state of the art when statistical process control was developed for mass production environments with limited product variation. But float glass manufacturing in 2026 operates with frequent product changeovers, multiple thickness and color campaigns, variable pull rates, and quality specifications that differ by customer and application. In this environment, fixed control limits that cannot distinguish between normal operating state variation and genuine process drift will always generate false alarms during transitions and miss real drift during steady state — both of which reduce yield. Autonomous SPC solves this fundamental limitation by matching control limits to operating states, learning from each state's demonstrated capability, and continuously refining limit settings based on downstream quality outcomes. The documented 2 to 8 percentage point yield improvement, 92% false alarm reduction, and 18% scrap reduction are achieved on the same sensor networks, inspection systems, and control infrastructure already installed on your float line. The platform connects to your existing CMMS, MES, and quality systems through iFactory's integration layer — no data migration, no control system modifications, no additional instrumentation. Book a Demo to start the autonomous SPC assessment for your float line and discover how much yield autonomous control limits can deliver for your operation.
Frequently Asked Questions — Autonomous SPC for Float Glass Manufacturing
Traditional SPC software calculates control limits from a static historical dataset — typically the first 20 to 30 data points after a process change — and applies those same limits until an operator manually recalculates them. Autonomous SPC calculates limits continuously, using machine learning to classify each minute of production into its operating state and applying a dedicated limit model for that state. The system recalculates limits when the operating state changes, when new capability data becomes available, and when downstream quality feedback indicates that the current limit settings are not providing optimal yield protection. The practical difference is that traditional SPC limits are typically recalculated monthly or quarterly, while autonomous limits are effectively live — updating with every operating state transition to ensure control limits always match current process capability.
No. The autonomous SPC architecture includes safeguards that prevent limit drift. Each operating state's control limit model is bounded by the demonstrated process capability — the limits cannot widen beyond the range the process has historically maintained at Cpk 1.33 or better for that specific product state. Additionally, the downstream quality correlation engine continuously validates that current limit settings are associated with acceptable quality outcomes. If the correlation engine detects a relationship between widening limits and increased defect rates at cold-end inspection, the limit drift prevention protocol is triggered — the limits for that operating state are locked to their previous validated range until a root cause investigation is completed. The system is designed to be conservative: it prefers tighter limits that generate more genuine drift detection over wider limits that risk allowing defects to develop undetected.
The data infrastructure requirements are minimal because autonomous SPC operates on the process data your float line already generates. The platform connects to existing process historians, DCS systems, SCADA networks, and inline inspection systems through standard OPC-UA, Modbus TCP, and SQL database connectors. Most float glass facilities have the required data streams already available — crown temperature, oxygen trim, tin bath gradient, lehr zone temperatures, ribbon thickness, and cold-end inspection defect data are typically captured and stored. iFactory's integration team configures the data connectors during the deployment phase, typically completing connectivity within one to two weeks. No additional sensors, control system modifications, or data infrastructure investments are required. The platform can also ingest data from existing fixed-limit SPC systems and operate in parallel during the validation period before transitioning to autonomous control.
The typical deployment timeline is 8 to 12 weeks from project initiation to full autonomous operation. The data connectivity and baseline analysis phase requires 2 to 3 weeks, during which the platform ingests historical process and quality data and establishes baseline performance for each operating state. The model training and calibration phase requires 3 to 4 weeks, during which the autonomous limit models are trained on historical data and validated against held-out data to confirm limit accuracy. The dashboard deployment and operator training phase can be completed during a single maintenance day — the autonomous SPC dashboards replace the existing fixed-limit charts, and operators typically adapt within two to three shifts. Measurable yield improvement — typically 1.5 to 3 percentage points — is observed within the first 4 to 6 weeks of live operation, with full yield improvement realized within 8 to 12 weeks as the models refine their state-specific limit settings through continuous learning. Book a Demo to receive a deployment timeline specific to your float line configuration and product mix.
Yes. iFactory's Autonomous SPC Platform includes pre-built connectors for major quality management systems, manufacturing execution systems, and CMMS platforms. The integration is bi-directional: the platform reads product specifications, quality standards, and process settings from these systems to configure control limit parameters, and writes inspection results, alarm events, work order requests, and yield performance data back into them. Standard connectors are available for SAP QM and PP modules, OSIsoft PI, GE Digital APM, and most SQL-based quality databases. The integration architecture uses REST APIs and OPC-UA protocols, enabling connectivity with custom or legacy systems through iFactory's integration layer without requiring modifications to existing enterprise software deployments. The platform also exports autonomous SPC data in standard formats for regulatory reporting and audit documentation, ensuring continuity with existing compliance workflows.
.png)