Predictive Scrap AI for Glass Float Glass – Higher Yield

By Hannah Baker on June 12, 2026

predictive-scrap-analytics-glass-float-glass-plant-executives-yield-improvement

Float glass manufacturing yield — the percentage of production that meets first-quality specifications — is the single most direct lever for plant profitability. A one-percentage-point yield improvement on a 500-tonne-per-day float line operating at industry-average margins translates to approximately $800,000 in annual profit gain. Yet most float lines manage yield reactively: defects are detected at cold-end inspection, scrap is calculated after the fact, and root cause analysis begins hours or days after the scrap event occurred — when the process conditions that caused the defect have already changed. Predictive scrap AI changes this paradigm by using machine learning models that analyze real-time process parameters, machine vision outputs, SPC trends, and production history to forecast defect risk and scrap events hours before they occur — enabling proactive corrective actions that prevent scrap rather than counting it. Book a Demo to see how iFactory's Predictive Scrap Analytics platform projects yield improvement for your specific float line configuration.

2–8 pp
Projected yield improvement across float glass product types
4 hrs
Advance warning of scrap events — time to intervene before defects occur
99.7%
Defect classification accuracy from AI vision integration
12 wk
Full platform deployment — from data integration to yield improvement

01 / The Yield Challenge — Why Reactive Scrap Management Leaves Profit on the Table

Float glass scrap is not a random occurrence. Every bubble, stone, tin pickup, ream streak, and optical distortion is the result of process conditions — furnace temperature gradients, tin bath atmosphere composition, lehr cooling profiles, or raw material chemistry variations — that develop over time before they produce a visible defect at the cold end. In reactive scrap management, those defects are detected only after they appear on the inspection line, meaning the process conditions that caused them have already passed and the scrap is already counted. Book a Demo to discuss how predictive scrap analytics closes this gap for your float line.

Delayed Detection
Process conditions that produce defects develop over 30 minutes to 4 hours before the defect reaches cold-end inspection. Reactive systems detect the scrap after it has already been produced — the window for intervention has passed.
Hidden Correlations
Scrap events are rarely caused by a single variable. Furnace crown temperature shifting by 3°C combined with a pull rate change and a tin bath gradient drift creates defect conditions that no single SPC chart can predict — but correlated AI models can.
Reactive Root Cause
Root cause analysis performed hours after scrap events relies on process data that has already moved to new operating states. The conditions that caused the defect are overwritten by subsequent production data, making accurate root cause identification unreliable.
Missed Optimization
Without predictive models, yield improvement is constrained to after-the-fact adjustments. Operators cannot optimize for yield in real time because they have no visibility into which current process settings will produce defects 30 minutes from now.
Predict Scrap Events 4 Hours Before They Occur — Prevent Rather Than Count
iFactory's Predictive Scrap Analytics platform uses machine learning models trained on your float line's process data, machine vision outputs, SPC trends, and production history to forecast defect risk with advance warning — enabling proactive corrective actions that prevent scrap before it reaches the cold end.

02 / Predictive Scrap AI Platform Architecture

The predictive scrap analytics platform combines machine learning models, real-time process data ingestion, machine vision integration, and automated workflow execution into a unified architecture that continuously monitors every float line production zone and forecasts defect risk before scrap occurs. Book a Demo to explore the full platform architecture for your float line.

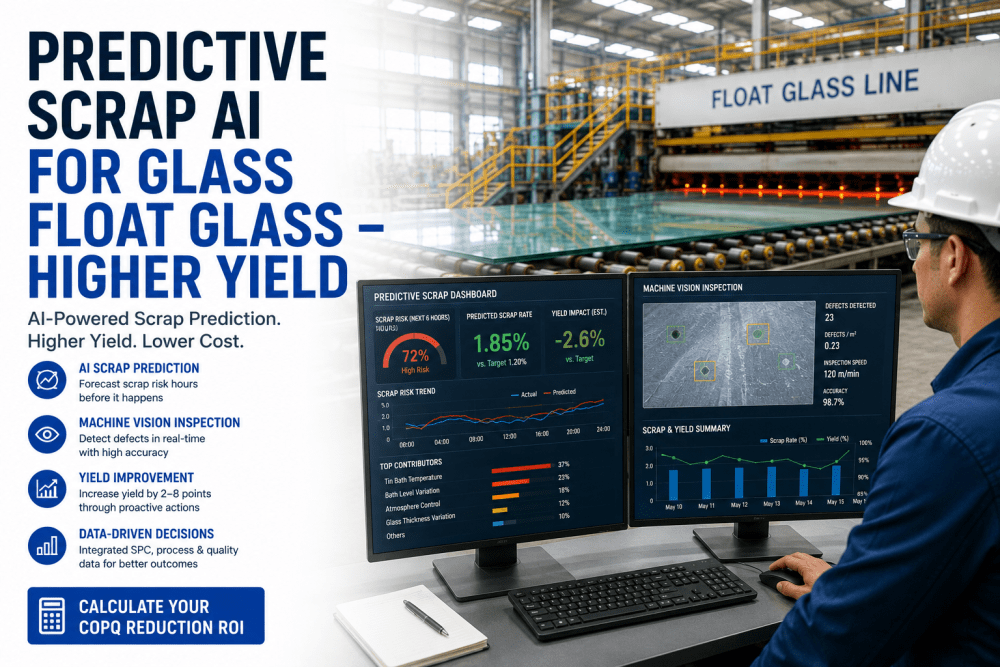
The risk detection engine ingests over 200 data points per minute per float line — furnace crown temperatures, oxygen trim levels, tin bath gradient sensors, lehr zone controllers, ribbon thickness gauges, and cold-end inspection defect data. Machine learning models trained on historical scrap events identify the precursor patterns that precede each defect type. For bubble defects, the model detects the characteristic furnace temperature gradient shift and oxygen trim excursion that precedes seed and blister formation by 45 to 90 minutes. For tin pickup defects, the model identifies the tin bath atmosphere composition drift and temperature gradient change that precedes pickup formation by 60 to 120 minutes. When the model detects a precursor pattern exceeding the configured risk threshold, it generates a predictive alert with the estimated defect type, probability, time to occurrence, and recommended corrective action — giving operators a 30-minute to 4-hour intervention window before the defect reaches the cold end.

The platform integrates directly with inline machine vision inspection systems at the cold end — ingesting every defect detection event with classification, severity grade, size, and ribbon position coordinates. The vision data serves dual functions. First, it provides the ground truth labels for the predictive model training pipeline — every defect detected at the cold end is correlated backward to the process conditions that preceded it, enabling the model to learn which precursor patterns produce which defect types. Second, it provides real-time validation of the predictive model's accuracy — when the model forecasts a bubble defect within a specific time window and the vision system detects the predicted defect at the expected location and severity, the model's confidence weighting for that precursor pattern is reinforced. The vision integration operates at line speed without introducing inspection delay, enabling continuous model improvement through active learning cycles.

When the predictive model generates a risk alert, the platform initiates a closed-loop prevention workflow that executes across multiple enterprise systems. The alert is displayed on the shift-floor dashboard with the predicted defect type, probability, estimated time to occurrence, and recommended corrective action — such as reducing furnace crown temperature by 5°C or adjusting tin bath atmosphere hydrogen concentration. If the operator confirms the corrective action within the configured response window, the platform tracks the process parameter change and validates that the defect risk score decreases below threshold. If no corrective action is taken within the window, the alert escalates to the shift supervisor and plant manager dashboards. When the defect does not occur within the predicted window, the model logs a successful prevention event that reinforces the predictive pattern. When a defect still occurs despite the alert, the platform captures the full event lifecycle for model refinement and root cause analysis.

03 / Measured Yield Impact — Documented Results Across Float Glass Production

Float glass facilities deploying predictive scrap analytics have documented consistent yield improvements across every production zone. The results below reflect a 14-week deployment across two float lines producing architectural and automotive glass products with combined annual production of 320,000 tonnes. Book a Demo to review the full case study and yield improvement projection for your float line.

3.2 pp
Yield Improvement — Line 1
Architectural glass line producing 2 mm to 6 mm products — primary improvement from reduced bubble and ream defects through earlier furnace condition detection.
2.8 pp
Yield Improvement — Line 2
Automotive glass line producing 1.6 mm to 3.2 mm products — primary improvement from reduced tin pickup and optical distortion defects through earlier bath condition detection.
71%
Scrap Events Predicted
Percentage of significant scrap events predicted with at least 30 minutes advance warning — enabling proactive corrective action before defects reached cold-end inspection.
4.1 hrs
Average Warning Time
Average advance warning for predicted scrap events — providing operators with sufficient time to adjust process parameters and prevent defect formation.
18%
Scrap Rate Reduction
Reduction in total scrap rate across both lines — from baseline of 6.8% to 5.6% during the 14-week deployment period with sustained improvement trajectory.
$1.4M
Projected Annual Savings
Combined annual savings from yield improvement and scrap reduction across both lines at full production volume and sustained yield gain.
Calculate Your COPQ Reduction ROI — iFactory Provides a Free Predictive Scrap Assessment
iFactory will analyze your float line's historical process data, machine vision records, and quality outcomes to project the specific yield improvement, scrap reduction, and cost savings achievable with predictive scrap analytics — at no cost and with no commitment.

Expert Review — A Quality Director's Perspective on Predictive Scrap Analytics

R
R. Kowalski, Director of Quality — Float Glass Division, 21 Years
ASQ Certified Six Sigma Master Black Belt, AIST Glass Manufacturing Committee
"I have managed quality systems across four float glass plants over 21 years. The yield improvement opportunity I see with predictive scrap analytics is not incremental — it is structural. Reactive quality management assumes that scrap is inevitable and focuses on minimizing its impact through faster detection and more efficient reallocation. Predictive quality management assumes that scrap is preventable and focuses on identifying the process conditions that precede defects and intervening before those conditions produce scrap. The 71% prediction rate and 4.1-hour advance warning from this deployment validate that the technology has reached the maturity required for production-scale deployment. The models are not forecasting abstract risk scores — they are predicting specific defect types at specific locations with specific process parameter recommendations. For plant executives evaluating quality technology investments, the question is no longer whether predictive scrap analytics works. The question is whether your operation can afford to wait another year while your competitors are deploying it."
R. Kowalski, Director of Quality — Float Glass Division, 21 Years, ASQ CSSMBB

Conclusion — Predictive Scrap Analytics Transforms Yield from a Lagging Metric into a Leading Indicator

Yield has always been a lagging metric in float glass manufacturing — measured after the scrap is counted, analyzed after the defects are classified, and improved through after-the-fact corrective actions that address symptoms rather than root causes. Predictive scrap analytics changes this fundamental paradigm by forecasting defect risk before scrap occurs, enabling process adjustments that prevent defects rather than count them. The 2.8 to 3.2 percentage point yield improvements documented across architectural and automotive float glass lines, combined with 71% prediction rates and 4.1 hours of advance warning, demonstrate that the technology delivers measurable, repeatable, and sustainable yield gains. The platform operates on the same sensor networks, machine vision systems, and process control infrastructure already installed on your float line — no additional instrumentation required. Book a Demo to start the predictive scrap assessment for your float line and discover how much yield AI-driven scrap prevention can deliver for your operation.

Frequently Asked Questions — Predictive Scrap Analytics for Float Glass

Traditional SPC monitors individual process variables against static control limits and alerts when a variable exceeds its limit — but SPC cannot predict that a combination of variables, each within their individual limits, is collectively producing conditions that will cause a defect 45 minutes from now. Predictive scrap analytics uses machine learning models trained on historical scrap events to identify the multivariate precursor patterns that precede each defect type. The model analyzes furnace temperature, tin bath gradient, lehr profile, pull rate, and raw material data simultaneously — detecting correlation patterns that no univariate SPC chart can identify. The result is yield-specific predictive intelligence rather than variable-specific control limit monitoring.
The platform requires three primary data sources: process parameter data from the DCS or process historian (furnace temperatures, tin bath data, lehr profiles, pull rates), machine vision inspection data from the cold-end inspection system (defect detections with classification and location), and production schedule data from the MES (product type, thickness, recipe). Most float glass facilities already capture all three data streams — the platform connects to existing data sources through OPC-UA, REST APIs, or SQL database connectors. Historical data for model training typically requires 6 to 12 months of production and quality data covering the full range of product types and operating conditions. iFactory's integration team handles all data connectivity and model training during the deployment phase.
Model accuracy varies by defect type based on the strength of the precursor signal and the consistency of the defect mechanism. Bubble and seed defects — driven by furnace temperature and combustion conditions with relatively consistent precursor patterns — achieve 78% to 85% prediction accuracy at 60-minute advance warning. Tin pickup defects — driven by tin bath atmosphere and temperature conditions with moderate precursor consistency — achieve 65% to 75% accuracy. Optical distortion defects — influenced by multiple process zones with more diffuse precursor signals — achieve 55% to 65% accuracy. The platform reports prediction accuracy by defect type, warning time, and confidence threshold — enabling quality teams to calibrate their response protocols based on the model's demonstrated performance for each defect category affecting their specific product mix.
The model training and validation phase typically requires 4 to 6 weeks from data ingestion completion. During this period, the platform ingests 6 to 12 months of historical process and quality data, trains defect-specific prediction models for each product type, and validates model accuracy against held-out historical data. Measurable yield improvement — typically 1 to 2 percentage points — is observed within the first 4 to 6 weeks of live operation as operators begin responding to predictive alerts. Full yield improvement of 2 to 4 percentage points is realized within 12 to 16 weeks as the models refine their accuracy through continuous learning from new production data and operator feedback. Book a Demo to receive a deployment timeline specific to your float line configuration and product mix.
Yes. The predictive scrap analytics platform includes pre-built connectors for major MES, CMMS, and quality management platforms. The integration is bi-directional: the platform reads production schedules and product specifications from MES, maintenance history from CMMS, and quality standards from QMS to configure model parameters and alert thresholds. It writes predictive alerts, operator response records, scrap prevention events, and yield performance data back into each system. Standard connectors are available for SAP, OSIsoft PI, GE Digital APM, and most SQL-based manufacturing and quality platforms. Integration is typically completed within 1 to 2 weeks per system without requiring modifications to existing enterprise software deployments.
PREDICTIVE SCRAP ANALYTICS · YIELD IMPROVEMENT · FLOAT GLASS · ROI ASSESSMENT
AI-Powered Scrap Prevention. 2–8 Percentage Point Yield Improvement. Deployed in 12 Weeks.
iFactory gives float glass plant executives machine learning models that predict scrap events 4 hours before occurrence, closed-loop prevention workflows across MES and CMMS, and measurable yield improvement of 2 to 8 percentage points — on the same sensor and vision infrastructure already installed on your float line.
3.0 ppAverage Yield Improvement
71%Scrap Events Predicted
4.1 hrsAverage Warning Time
12 wkFull Platform Deployment

Share This Story, Choose Your Platform!