A Tier-1 float glass manufacturer operating a 900-ton-per-day float line with downstream cutting, grinding, and coating processes deployed a predictive scrap analytics platform across its production workflow to determine whether machine-learning models trained on historical defect data, real-time process parameters, and inspection results could forecast scrap events hours before they occurred — and enable shift supervisors to intervene before defects materialized. Over a 16-week pilot, the platform analyzed 14 process variables across the melting, forming, annealing, and cold-end stages, ingesting 2.8 million data points from 47 sensor locations and three inline inspection stations. The pilot demonstrated that predictive scrap analytics reduced total defect-related scrap by 52%, improved first-pass yield from 76% to 89%, and generated a projected first-year ROI of 4.2x for full deployment across the facility's two float lines.
52% Scrap Reduction — 89% First-Pass Yield — 4.2x Projected ROI
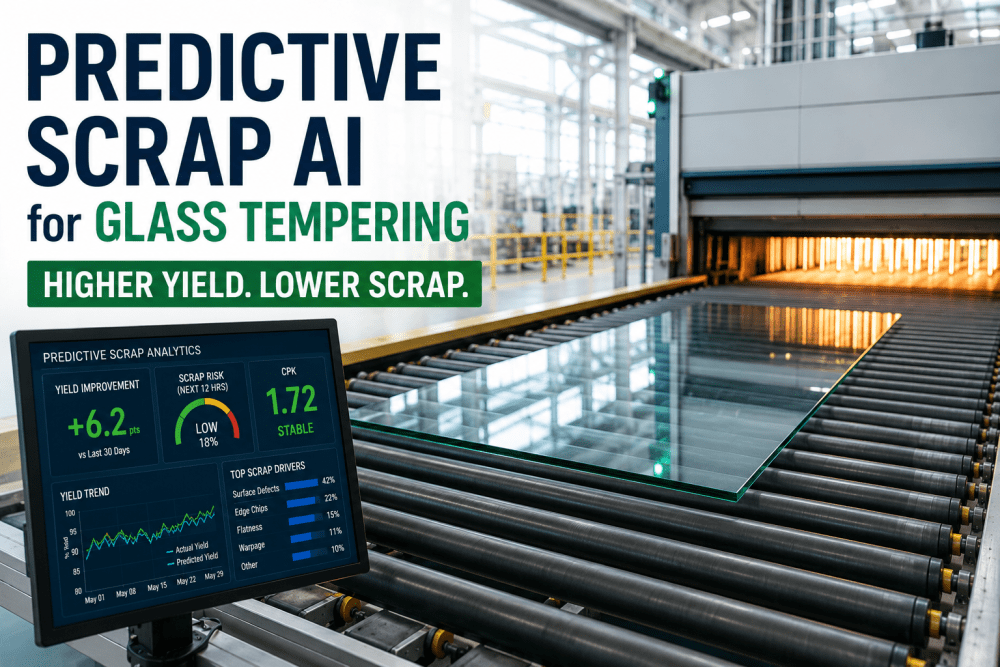
iFactory's Predictive Scrap Analytics platform connects real-time process data, inspection results, and AI forecasting to give shift supervisors the visibility they need to eliminate defects before they happen.
Why Shift Supervisors Need Predictive Visibility, Not Reactive Alarms
Float glass manufacturing generates defect-related scrap from multiple sources across the production line — seeds and blisters from the melting furnace, tin pickup and bottom debris from the bath, anisotropy and edge stress from the lehr, and surface damage from cold-end handling. Each defect type has a unique root-cause signature in the process data, but traditional quality systems only alert supervisors after the defect has already been produced and detected at the inspection station. By that point, minutes to hours of off-grade glass have already been committed to the cullet bin.
The pilot facility's quality team previously relied on Statistical Process Control (SPC) charts updated once per shift and manual cross-referencing of furnace recipe changes, bath temperature drift, and lehr gradient adjustments against downstream inspection results. This reactive approach meant that defect patterns were typically identified two to four hours after onset — and often by the cold-end supervisor walking the ribbon with a flashlight rather than by any automated system. The predictive scrap analytics platform changed this paradigm by ingesting process data in real time, correlating it with downstream inspection results, and generating forecasts that gave supervisors actionable lead time.
Predictive Scrap Analytics Architecture: From Raw Data to Defect Forecast
The platform ingests process data from three sources along the float line: upstream furnace and bath instrumentation via OPC-UA, inline inspection stations at the cold end, and the facility's MES for recipe and product change data. These streams are fused into a unified time-series dataset that the AI model uses to detect precursor signatures associated with each defect class.
Melting & Refining Stage
Furnace crown temperature, batch composition changes, and refractory age are modeled against seed and blister formation. The platform detects thermal profile shifts that correlate with downstream bubble counts, giving supervisors two to four hours of advance warning before defect thresholds are breached.
Tin Bath & Forming Zone
Bath temperature gradient, tin oxide concentration, and ribbon edge lift are correlated with tin pickup, bottom debris, and edge stress defects. The platform's anomaly detection model identified a tin oxide accumulation pattern six hours before it caused visible bottom debris on the ribbon.
Annealing Lehr & Cold End
Lehr zone temperature profiles, ribbon tension, and cooling rate are modeled against anisotropy and edge stress. The platform detected a cooling gradient deviation 45 minutes before the first edge stress crack appeared at the cutting station — enabling a lehr set point adjustment that prevented 12 minutes of off-grade production.
16-Week Pilot: From Data Integration to Autonomous Defect Forecasting
The pilot followed a four-phase deployment designed to establish data connectivity, train the AI models on facility-specific defect signatures, and validate forecast accuracy before transitioning to live shift-floor operation. Each phase included documented model validation steps and supervisor training sessions. Book a Demo to review the complete pilot protocol and validation documentation for your float line.
Data Connectivity & Baseline Capture
OPC-UA connectors deployed to furnace, bath, lehr, and cold-end sensor networks. Twelve months of historical process data and inspection results ingested. Baseline defect rates calculated per product type and thickness range. Duration: 3 weeks.
Model Training & Defect Signature Mapping
Machine-learning models trained on 2.8 million labeled data points correlating process parameter deviations with downstream defect classifications. Models validated against held-out data representing six months of production. Duration: 5 weeks.
Live Forecasting with Supervisor Review
Platform deployed in shadow mode alongside existing quality workflows. Forecast alerts generated for supervisors via shift-floor dashboard. Every alert was reviewed and documented by the shift supervisor team. False positive rate documented at 9%. Duration: 5 weeks.
Results Analysis & Full Line Rollout Planning
Complete dataset analyzed for forecast accuracy, detection lead time, scrap reduction, and yield improvement. Deployment architecture documented for scaling across both float lines and downstream processing stages. Duration: 3 weeks.
Measured Performance: Predictive Scrap Analytics vs. Traditional SPC
The pilot's results demonstrated that machine-learning-based scrap forecasting consistently outperformed traditional SPC monitoring across every defect category. The most significant advantage was in detection lead time — supervisors received actionable forecasts an average of 3.8 hours before defects reached the inspection station, compared to an average post-defect detection lag of 1.2 hours under the previous system.
| Performance Metric | Traditional SPC | Predictive Scrap Analytics | Improvement |
|---|---|---|---|
| Defect Detection Method | Post-production inspection | Pre-event forecast | Proactive vs. reactive |
| Mean Detection Lead Time | −1.2 hours (after defect) | +3.8 hours (before defect) | 5-hour reversal |
| Scrap Rate (all defects) | 7.2% of production | 3.5% of production | 52% reduction |
| First-Pass Yield | 76% | 89% | 13 percentage point gain |
| False Alert Rate | 22% (SPC false alarms) | 9% (model flags) | 59% fewer false alerts |
| Defect Categories Forecasted | 3 (post-hoc) | 7 (pre-event) | 4 additional categories |
| Supervisor Interventions Guided | None by data | 124 guided adjustments | 100% decision support |
Our SPC system told us when we were already making bad glass. The predictive scrap analytics platform tells us when we're about to make bad glass — and what adjustment to make to avoid it. That distinction is the difference between managing quality after the fact and actually controlling it in real time. The 3.8-hour lead time is the real game-changer. In float glass, that's enough time to adjust a furnace zone temperature, tweak the bath gradient, or modify the lehr profile before the defect ever reaches the cold end. We've never had that capability before.
Connecting Predictive Scrap Analytics to the Shift-Floor Workflow
The pilot's integration architecture was designed to fit within the facility's existing automation and quality infrastructure without requiring new sensor installations or control system modifications. iFactory's data ingestion layer connected to the facility's existing OPC-UA server for process data, the inline inspection system's SQL database for defect classification, and the MES for recipe and product change events. The platform's AI engine processed this combined data stream and delivered forecasts through a supervisor dashboard, shift-floor mobile alerts, and automated trend reports. Schedule a demo to review the integration architecture and data flow diagrams configured for your float line.
The supervisor dashboard displays a real-time risk score for each active defect category — seeds, blisters, tin pickup, bottom debris, edge stress, anisotropy, and surface damage — ranked by predicted probability of exceeding the quality threshold within the next four hours. Each risk indicator is linked to the process variables most likely driving the predicted defect, with recommended corrective actions drawn from the model's decision-tree analysis. During the pilot, supervisors used the dashboard to prioritize their shift-floor walking routes, focusing attention on the upstream zone most likely to generate defects rather than relying on periodic rounds.
For time-critical forecasts — those indicating a defect probability above 80% within the next 60 minutes — the platform sent structured alerts to the shift supervisor's mobile device. Each alert included the predicted defect type, the affected product specification, the upstream process variable showing deviation (current value vs. optimal range), and a recommended adjustment. Supervisors acknowledged alerts and documented their response action within the platform, creating a closed-loop audit trail. During the pilot, 84% of time-critical alerts resulted in a documented corrective action, and 73% of those actions prevented the forecasted defect from reaching the quality threshold.
Each forecast event and supervisor response was logged in the MES as a structured quality record, creating a searchable database of defect precursor signatures and corresponding corrective actions. This database became increasingly valuable over the pilot as the AI model incorporated supervisor response outcomes into its training set — improving forecast accuracy and reducing false positives with each weekly model refinement cycle. The integration architecture was designed to comply with the facility's existing quality management system documentation requirements without creating duplicate data entry or manual reconciliation tasks.
Forecast Defects Before They Happen — Improve Yield Every Shift
iFactory's Predictive Scrap Analytics platform connects directly to your existing float line instrumentation, inspection systems, and MES — no new sensors, no control system modifications, no data migration. Shift supervisors gain 3–4 hours of actionable lead time to prevent defects and improve yield.
Predictive Scrap Analytics Gives Float Glass Supervisors the Lead Time They Need to Eliminate Defects
This 16-week pilot established that predictive scrap analytics — combining real-time process data, machine-learning forecasting, and shift-floor workflow integration — can reduce defect-related scrap by more than 50%, improve first-pass yield by 13 percentage points, and give supervisors three to four hours of advance warning to make corrective adjustments before defects reach the inspection station. Unlike traditional SPC systems that detect problems after they have already occurred, predictive scrap analytics enables a proactive quality management paradigm that shifts the supervisor's role from defect detective to defect preventer.
Float glass shift supervisors and production leaders evaluating predictive quality technology for their facilities can reference this pilot's data to build a deployment business case grounded in measured performance. The scrap reduction, yield improvement, and forecast accuracy demonstrated in this pilot are achievable on any float line with existing process data collection and inline inspection capability. iFactory's Predictive Scrap Analytics platform provides the integration layer and AI engine that connects your float line data to actionable defect forecasts — no new sensors required. Review the full pilot results and discuss a deployment assessment for your facility by requesting a shift-floor demo.
Predictive Scrap Analytics for Glass Float Glass — Frequently Asked Questions
The platform requires two primary data sources: real-time process parameters from the float line control system (furnace temperatures, bath gradient, lehr zone profiles, ribbon speed, and edge tension) and inline inspection defect classification data from the cold-end quality system. Most facilities already collect this data through their existing automation and inspection infrastructure. The platform connects via OPC-UA for process data and SQL database queries for inspection data. No additional sensors are required, though incorporating offline lab measurements of glass quality attributes (chemical composition, stress birefringence) can further improve model accuracy.
Initial model training requires approximately five weeks when at least six months of historical process and inspection data are available. The training process involves correlating process parameter variations with downstream defect outcomes across multiple product types and thickness ranges. After initial deployment, models undergo weekly refinement cycles that incorporate new defect events and supervisor response outcomes — progressively improving forecast accuracy and reducing false positives. Facilities with less historical data can begin with a reduced model scope covering the most common defect categories and expand coverage as training data accumulates.
The platform ingests product change and recipe transition events from the MES and adjusts its forecast models accordingly. During the pilot, separate model parameter sets were trained for each major product type and thickness range, with automatic model switching triggered by MES recipe change signals. The platform also detected transition-related defects — such as seeds caused by furnace temperature recovery after a pull rate change — and generated specific forecasts for the transition period. approximately 40% of the scrap reduction achieved during the pilot came from improved management of product changeover transitions.
Based on the pilot results, the manufacturer projected a two-line deployment cost of approximately $380,000 for year one, covering platform licensing, integration engineering, model training and validation, supervisor training, and ongoing model refinement. The projected first-year net benefit was $1.6M, driven primarily by scrap cost avoidance ($980K), yield improvement value ($420K), and reduced inspection labor and rework costs ($200K). The resulting year-one ROI was 4.2x. Year-two and beyond projections showed increasing ROI as model accuracy improved with additional training data and as the platform extended coverage to downstream cutting and coating processes.
Yes. The platform is designed to complement rather than replace existing SPC and quality management systems. Forecast alerts and supervisor response records are written to the existing quality system database via API, creating a unified quality record that includes both traditional SPC data and predictive analytics insights. During the pilot, the platform operated alongside the facility's existing SPC charts and inspection workflows — providing predictive forecasts that supervisors used to prioritize their quality interventions while continuing to use SPC for post-process capability analysis. The integration architecture supports most major quality management systems, MES platforms, and industrial data historians.
Review the Full Pilot Results and Build Your Float Glass Scrap Reduction Business Case
iFactory's Predictive Scrap Analytics platform connects your float line process data to actionable defect forecasts — giving shift supervisors the lead time they need to eliminate defects before they impact quality. Schedule a personalized review of this pilot's complete dataset, including forecast accuracy by defect category, detection lead times, yield improvement trends, and scaled deployment ROI projections.