Predictive Scrap AI: Lower Energy in Glass Float Glass
By Hannah Baker on June 11, 2026
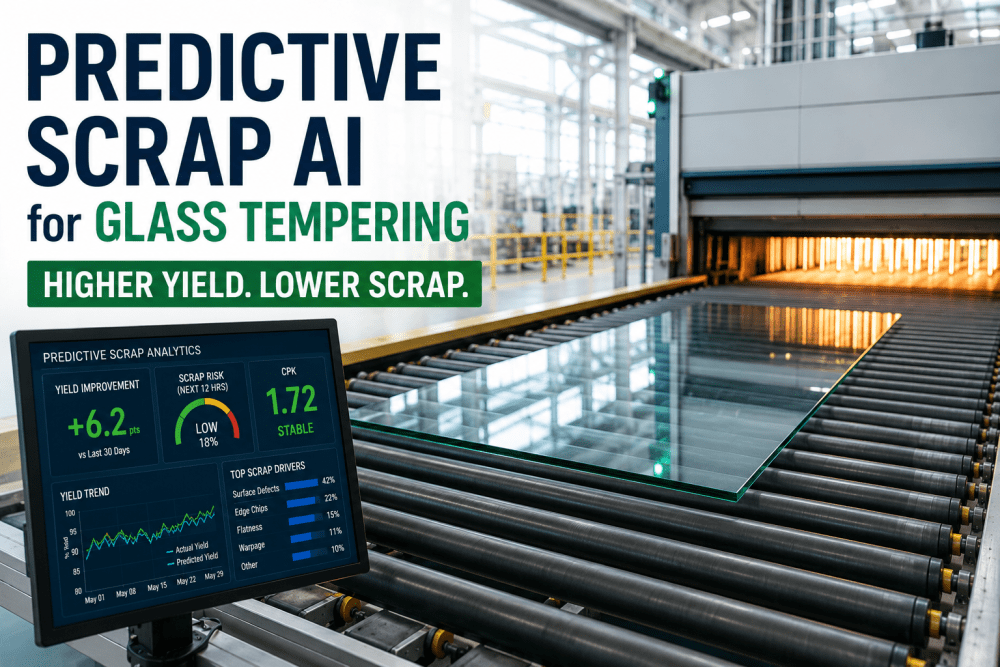
Every ton of rejected glass on a float line carries the full energy cost of melting, refining, and annealing — and that cost evaporates the instant the cullet hits the reject conveyor. For shop-floor operators managing ribbon temperature, tin bath atmosphere, and lehr profiles in real time, the link between scrap events and specific energy consumption is immediate: a break or ream that forces a line slowdown burns extra energy per saleable square meter. Predictive scrap analytics changes the equation entirely — forecasting defects before they form, so operators adjust process parameters early, keep the ribbon sound and drive specific energy lower with fewer lost tons.
iFactory Predictive Quality
Predictive Scrap AI: Lower Energy in Glass Float Glass
Forecast defects before they form, reduce specific energy consumption by 4–10%, and give operators an AI-native SPC tool that turns float line data into actionable process adjustments.
A float line furnace operates at roughly 1,550°F melt temperature around the clock, consuming 7–10 GJ of energy per ton of glass produced. When a stone, knot, ream, or tin pickup forces that ton to the cullet pile, the natural gas and electricity that brought it to temperature are written off in full. The loss is not theoretical — it is a direct, measurable cost that lands on the energy bill without a single saleable square meter to show for it.
Reject Energy Waste
Every scrapped ton wastes the full melt energy — roughly $50–80 per ton in fuel cost alone, before labor and overhead are added.
Line Slowdown Penalty
Defect events often force pull-rate reductions. Lower throughput with the same furnace load raises specific energy per saleable ton immediately.
Grade Downgrade Waste
Glass that meets quality but not prime-grade specifications still consumed full energy — downgrades are an invisible scrap equivalent on the energy ledger.
Hidden Cullet Return
Recycled cullet saves raw material but the energy to remelt it is still spent twice — energy that predictive quality could have preserved as prime glass.
How Predictive Scrap Analytics Works on the Float Line
Predictive scrap analytics brings machine learning models directly to the float line data stream — ribbon temperature profiles, tin bath hydrogen flow, lehr zone thermal gradients, historical defect patterns — and surfaces forecasts on the terminal the operator already works from. The operator does not need to interpret a dashboard; the system highlights the risk and suggests the adjustment.
Stream
Line sensors, process historian, QC data aggregated in real time
Forecast
ML model predicts defect probability 15–30 minutes ahead
Alert
Operator receives alert with suggested parameter adjustment
Adjust
Tempering, lehr, or tin bath parameter optimized inline
Sustain
Defect prevented, energy per saleable ton reduced
Want to see how this workflow fits your float line? Book a demo and we will walk through your data streams live.
AI-Native SPC vs. Traditional SPC on the Float Line
Statistical process control has been a staple of float glass quality for decades, but conventional SPC suffers one fundamental limitation: it flags a problem after the data has already deviated. AI-native SPC shifts the window — forecasting the deviation before it registers on the control chart, and coupling that forecast with a specific process recommendation the operator can act on.
Specific energy per saleable ton trended in real time
See It on Your Data
Live SPC Walkthrough for Float Glass Operators
Bring a week of your line data — ribbon temperatures, tin bath setpoints, lehr profiles, and defect logs. We will show you what predictive scrap analytics forecasts that your current SPC does not.
Adaptive Process Control: What It Looks Like on the Terminal
The system does not add another screen to the operator station. Alerts and suggestions appear inside the existing HMI or on a complementary panel alongside the ribbon temperature display. When the model forecasts a ream risk emerging from a tin bath hydrogen imbalance, the operator sees a clear notification: "Ream probability rising — consider reducing H₂ flow by 2–4% over the next 5 minutes." The suggestion is specific, the reasoning is transparent, and the operator remains in control of the decision.
Ribbon Temperature
Forecasts hotspot drift and suggests crown burner trim to maintain uniformity before the profile deviates.
Tin Bath Atmosphere
Detects hydrogen / nitrogen ratio drift and alerts before tin pickup or ream defects form on the ribbon.
Lehr Zone Profile
Monitors cooling gradients across zones and flags annealing stress risks before the ribbon reaches the exit.
Pull-Rate Optimization
Correlates line speed with defect probability to recommend the maximum saleable pull rate for current conditions.
Expert Review: What Float Glass Operators Are Saying
"We deployed predictive scrap analytics on our #2 float line midway through Q2. The operators picked it up inside two shifts — not because the interface was simpler, but because it spoke their language. Instead of watching a control chart and guessing, they got a forecast with a specific number: 'Reduce bath hydrogen 3% over the next five minutes.' The defect rate for ream and tin pickup dropped in the first week, and the energy team calculated a 6.3% improvement in specific energy within the first month. The operators will tell you the same thing I will: this is the first AI tool that actually respects what they already know about the line."
Tom Westerfeld
Senior Process Engineer, Flat Glass Manufacturing
Start With a Live Walkthrough
See Predictive Scrap Analytics on Your Float Line
No demo data. No slide decks. We connect to your process historian or QC database and show you what the model forecasts from your actual line conditions — with your operators in the room.
Conclusion: From Reactive Scrap to Predictive Yield
Predictive scrap analytics does not replace the operator's judgment — it extends it with a forecast horizon that was never available before. For float glass operations, the outcome is fewer lost tons, lower specific energy consumption, and a line that runs more consistently shift after shift. The data is already on the line. The models are ready. The only question is which defect gets prevented first.
See it on your data. Book a demo and bring your line's process historian.
Frequently Asked Questions
What is predictive scrap analytics for float glass?
Predictive scrap analytics applies machine learning models to float line process data — ribbon temperature profiles, tin bath atmosphere readings, lehr zone temperatures, and historical quality outcomes — to forecast defect probability 15 to 30 minutes before a defect forms. The system alerts the operator with a specific parameter suggestion, enabling proactive adjustment rather than reactive scrap sorting.
How does reducing scrap also reduce energy consumption?
Every ton of glass that reaches the reject conveyor carries the full melt energy embedded in it — roughly 7–10 GJ per ton. When scrap is prevented, that energy stays captured in saleable glass. Additionally, defect-driven line slowdowns raise specific energy per ton because the furnace load remains constant while throughput drops. Preventing defects keeps pull rates higher and specific energy lower.
Do operators need data science or AI training to use this system?
No. The system surfaces alerts and suggestions inside the existing operator HMI or alongside it — no separate analytics dashboard to learn. Operators act on plain-language recommendations such as "Reduce tin bath hydrogen flow by 2% over the next 5 minutes." Training requires less than one shift to reach comfortable use.
How does the system integrate with existing float line controls?
Integration is read-only and inbound. The platform connects to your process historian, PLC data stream, or QC database via standard industrial protocols. It runs on a pre-configured edge server inside your network — no external egress, no write path to process controls. The operator receives suggestions; the operator decides whether to act.
What is the typical payback period for predictive scrap analytics on a float line?
Customers typically measure payback in under six months based on scrap reduction alone, with additional energy savings accelerating the return. Specific results depend on line size, current scrap rate, and product mix. A typical 600-ton-per-day float line with an 8% scrap rate can recover $3,000–5,000 per day in avoided energy and material waste at full deployment.


.png)