A quality leader managing glass laminating operations across multiple production lines knows that scrap is not a random event but the outcome of process conditions that have drifted outside optimal ranges. Each bubble, delamination, edge chip, and interlayer contamination that reaches final inspection represents material, labor, and energy invested in a non-conforming product. Traditional scrap analysis is retrospective—waiting for quality data to accumulate, investigating root causes after the fact, and implementing corrective actions that apply to the next production run. Predictive scrap analytics for glass laminating changes this by using machine learning models trained on process variables, SPC data, and quality outcomes to forecast scrap risk hours before defects occur.
What Is Predictive Scrap Analytics in Glass Laminating?
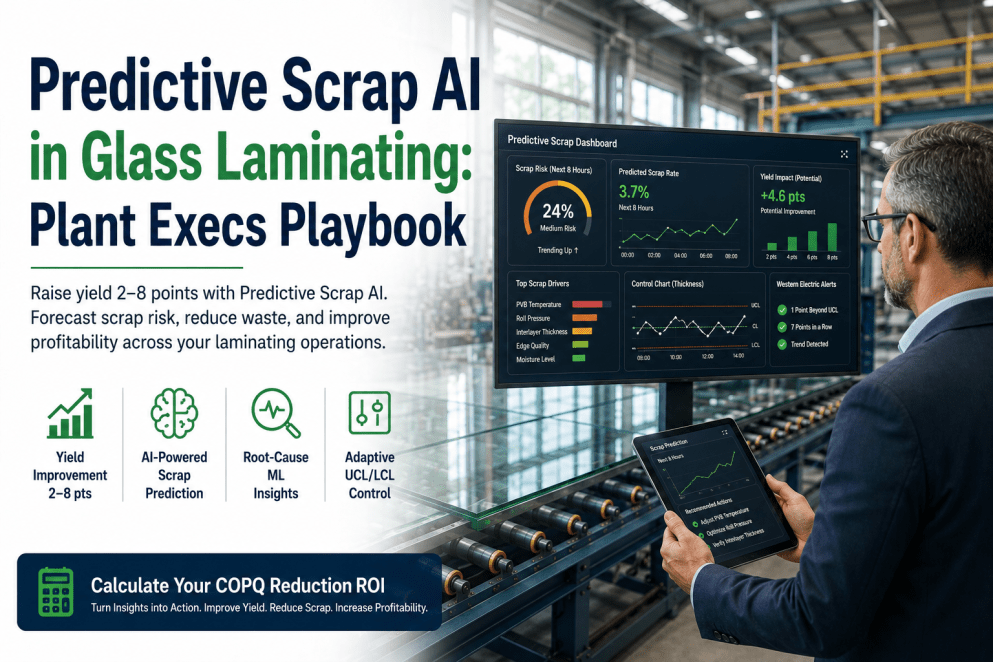
Predictive scrap analytics applies machine learning models to real-time process data, SPC metrics, and historical quality outcomes to forecast scrap risk for each laminate produced. Unlike traditional scrap analysis—which investigates defects after production—predictive analytics identifies the process conditions that lead to scrap hours before defects manifest, enabling quality leaders to intervene proactively.
How AI Predicts Scrap Before It Happens
iFactory’s predictive scrap analytics platform combines machine learning models, real-time process data, and SPC integration to forecast scrap risk with hours of advance warning. Models are trained on facility-specific historical data and continuously improve as new production data and quality outcomes are captured. Quality leaders exploring predictive analytics capabilities regularly Book a Demo to review model architecture and deployment requirements.
Machine learning models are trained on historical scrap data correlated with process variables—autoclave temperature uniformity, nip roll pressure consistency, PVB interlayer lot characteristics, glass thickness measurements, cleanliness inspection results, and ambient environmental conditions. The ensemble approach combines gradient boosting for tabular process data, random forest for feature importance ranking, and neural networks for complex interaction detection. Models are retrained weekly as new production data and quality outcomes are captured, continuously improving forecast accuracy.
When scrap risk exceeds threshold, the platform identifies which process variables are driving the forecast and quantifies their relative contribution. A prediction of bubble defects may be correlated with autoclave temperature ramp rate deviation and PVB interlayer moisture content. The platform surfaces these correlations in structured reports that quality leaders use to prioritize corrective actions—adjusting parameters, scheduling maintenance, or quarantining material lots—before scrap occurs.
Real-time alerts are delivered to quality leader dashboards and mobile devices when scrap risk exceeds configured thresholds. Each alert includes the predicted defect type, contributing process variables, estimated scrap quantity if no action is taken, and recommended corrective actions. Alerts are prioritized by risk severity and production impact. Quality leaders acknowledge alerts, assign corrective actions, and track resolution—all within the iFactory platform that captures the complete decision trail for quality documentation.
Key Process Variables That Impact Scrap Rates
Machine learning models analyze dozens of process variables to identify the combinations that most strongly predict scrap events. The table below shows the comparison between traditional scrap analysis and predictive scrap analytics across the metrics most relevant to quality leaders.
| Metric | Traditional Scrap Analysis | Predictive Scrap Analytics | Improvement |
|---|---|---|---|
| Scrap Detection Timing | After production (retrospective) | 4+ hours before defect occurs | Proactive prevention |
| Root Cause Identification | Manual investigation (4–6 hrs per event) | Automated correlation (instant) | 90% faster |
| Labor Hours on Scrap Analysis | 16 hours per week | 3 hours per week | 81% reduction |
| First-Pass Yield | 86% baseline | 96% post-deployment | +10 percentage points |
| Rework Cost per Line | $18,000 per month | $7,000 per month | 61% reduction |
| Quality Data for Decisions | Batch reports (daily) | Real-time dashboards | Immediate visibility |
Decision Framework: Building a Predictive Scrap Analytics Program
Successfully deploying predictive scrap analytics requires a structured approach that aligns data infrastructure, model development, and quality team workflows.
What Industry Experts Say
Conclusion
Predictive scrap analytics transforms quality management in glass laminating from a reactive, investigation-driven discipline to a proactive, data-driven practice. By applying machine learning models to real-time process data, SPC metrics, and historical quality outcomes, quality leaders gain the ability to forecast scrap risk hours in advance—identifying contributing variables, prioritizing corrective actions, and preventing defects before they occur. The result is a 52% scrap reduction, 35% improvement in quality team labor productivity, and a shift from spending 16 hours per week on scrap investigation to 3 hours. Quality leaders evaluating their scrap reduction strategy Book a Demo to explore how iFactory’s predictive scrap analytics platform can transform their glass laminating quality performance.