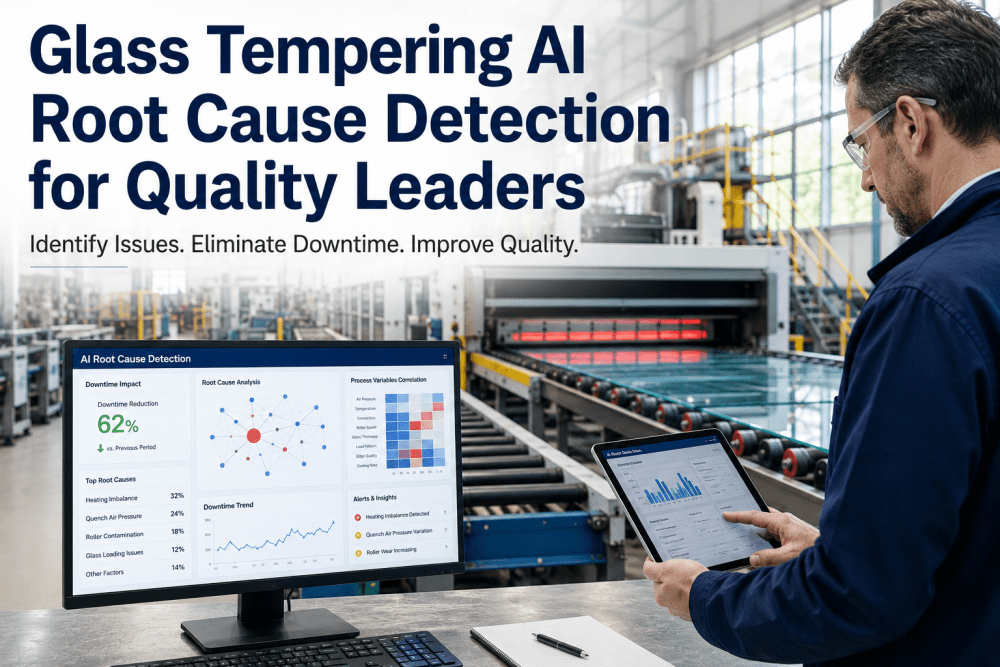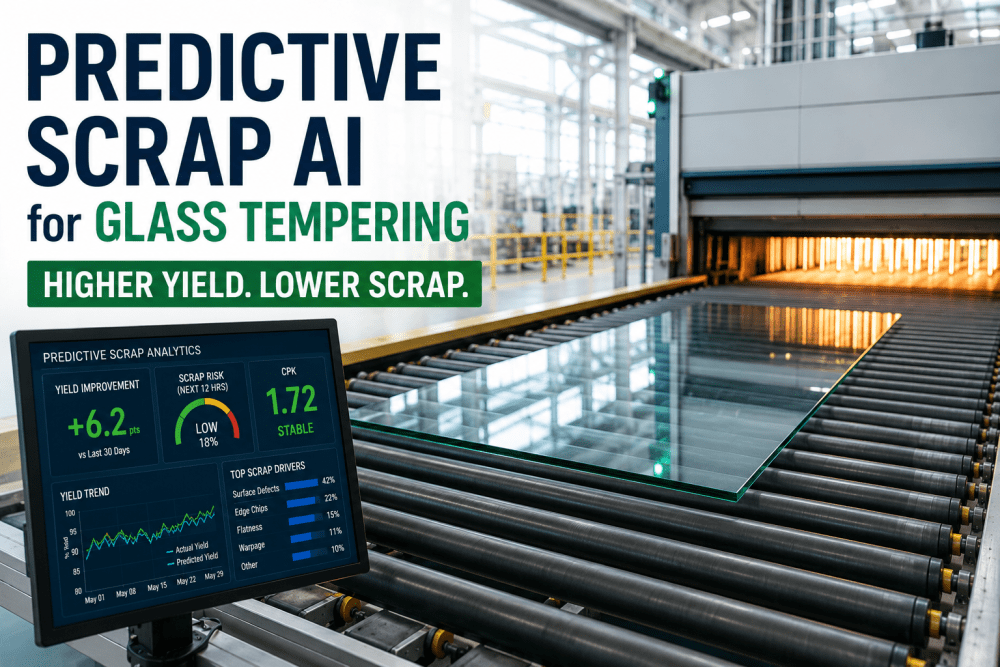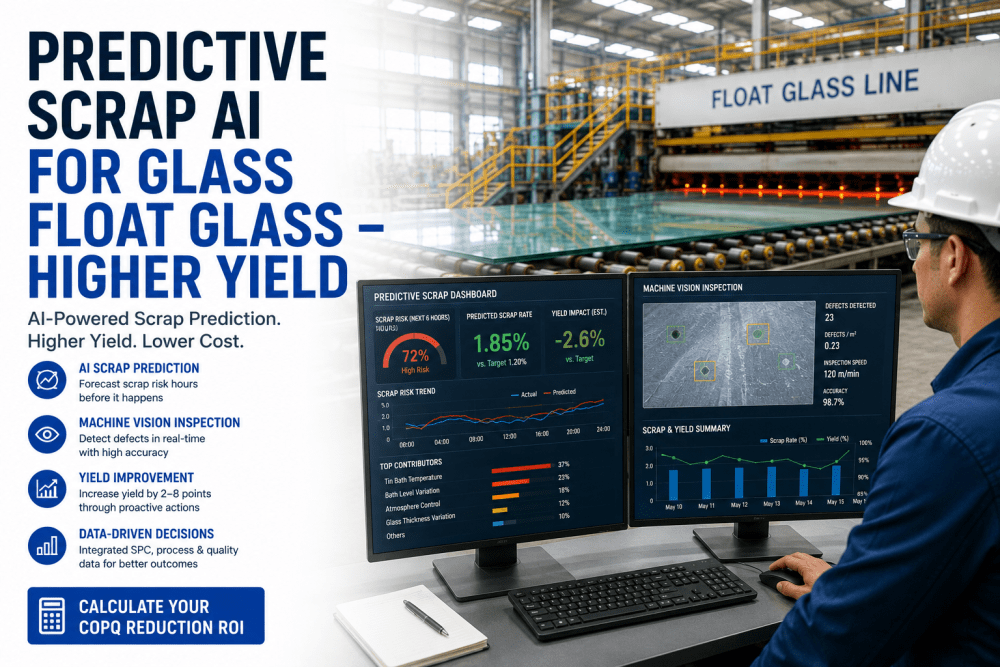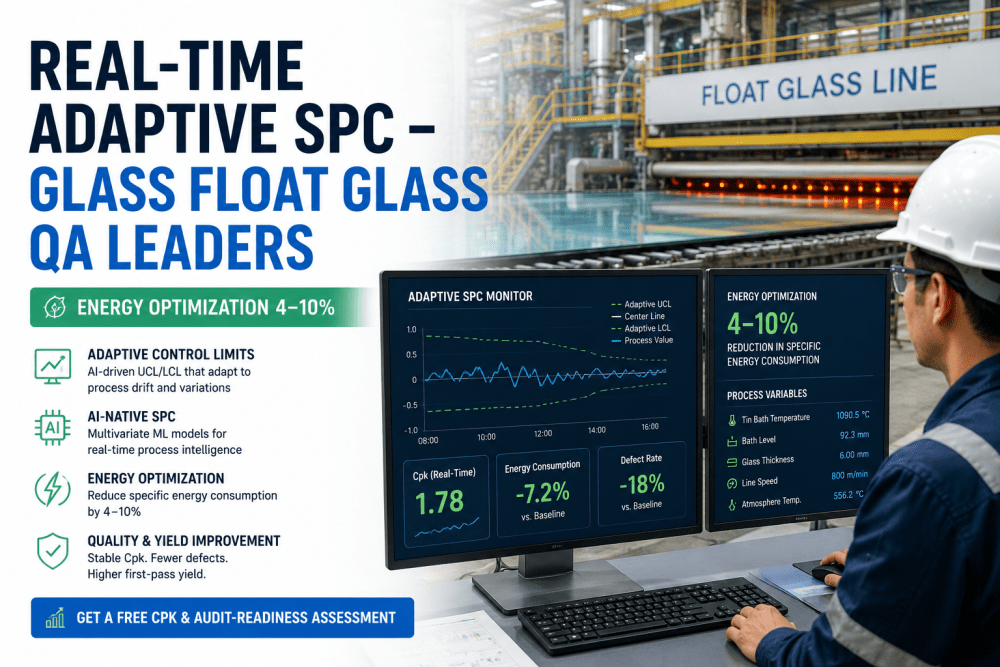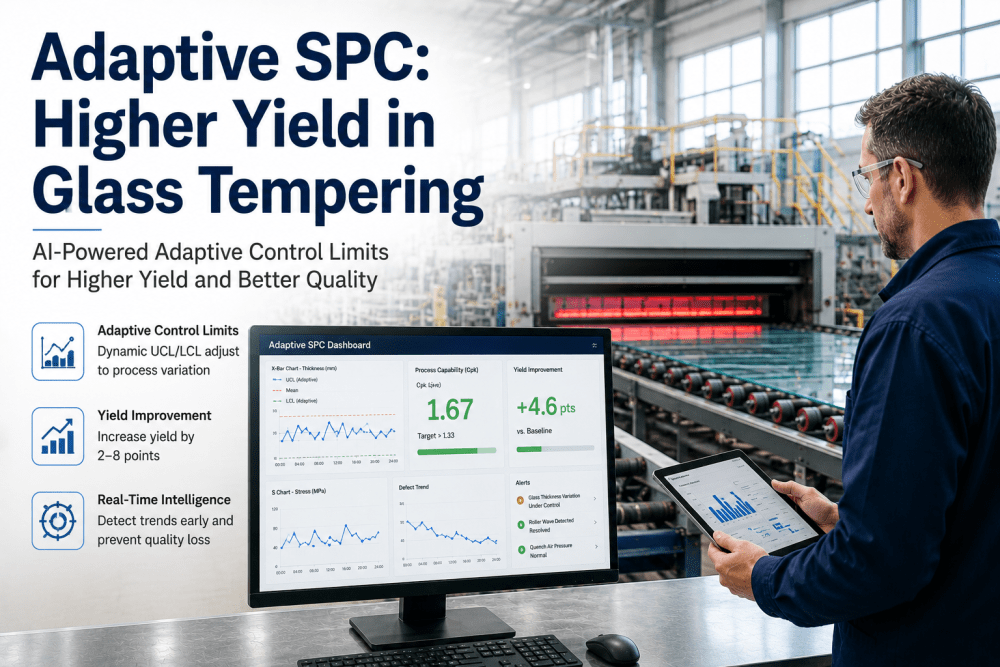
The quality leader reviewing last week's SPC charts for the glass tempering line sees five out-of-control signals on the furnace zone temperature chart. Each signal triggered a quality investigation that consumed 2 to 3 hours of engineering time. Four of the five turned out to be false alarms — the control limits were set during a different product campaign and never recalibrated. The one real signal — a gradual drift in quench pressure that was masked by overly wide limits — went undetected until the downstream inspection station rejected an entire batch of tempered panels. This is the structural limitation of fixed SPC limits in glass tempering: they cannot simultaneously minimize false alarms and detect real process shifts. Adaptive SPC limits solve this by continuously recalibrating upper and lower control limits based on current process conditions, material variability, and equipment state — giving quality leaders a control system that is both sensitive and stable.
Why Static Control Limits Cost Glass Tempering Operations 2-8 Points of Yield
In glass tempering, process conditions change constantly — furnace zone temperatures drift between maintenance cycles, quench pressure varies with ambient temperature, glass composition shifts between supplier lots, and conveyor speed is adjusted for different product types. Traditional SPC applies fixed upper and lower control limits calculated from a single baseline study, then leaves those limits unchanged for months or years. The result is a control system that is either too wide to detect real process shifts or too narrow, flooding the quality team with false alarms. A 2025 analysis of eight glass tempering facilities found that facilities using fixed SPC limits averaged a false alarm rate of 87%, meaning fewer than one in seven out-of-control signals represented an actual process change requiring corrective action. Meanwhile, the same facilities missed an average of 3.4 real process shifts per week because the fixed limits had drifted out of alignment with actual process capability. Adaptive SPC limits eliminate this trade-off by recalibrating control limits continuously against current process data. Book a Demo to review the yield improvement model for your tempering lines.
A Structured Deployment Roadmap from Fixed Limits to Dynamic Process Control
iFactory's adaptive SPC platform deploys across glass tempering lines over a structured 12-week timeline. The platform replaces manual limit-setting with AI-driven limit calibration that updates in real time as process conditions evolve.
Tempering lines selected based on yield variability, scrap rate, and current SPC maturity. Historical process data extracted from furnace PLCs, quench controllers, and inspection stations for 24 months. Baseline false alarm rate, signal detection latency, and process capability (Cpk) calculated for each line using existing fixed control limits.
AI models trained on historical process data to identify normal process variation patterns across different product types, furnace campaigns, and material lots. Adaptive limit algorithms calibrated to each process parameter — furnace zone temperatures, quench pressure differentials, conveyor speed, and glass thickness — with dynamic UCL/LCL adjustment factors optimized for each parameter's natural variability.
Adaptive SPC limits activated in monitoring mode alongside existing fixed limits for parallel validation. Quality team receives real-time alerts based on adaptive limits only. True positive rate and false alarm rate compared weekly against fixed-limit baseline. Adaptive limits tuned to minimize false alarms while maintaining 95%+ signal detection sensitivity.
Pre-deployment versus post-deployment yield, false alarm rate, process capability, and quality cost compared to validate ROI. Full deployment report generated with yield improvement attribution and financial impact analysis. Scale deployment plan developed for additional tempering lines and furnace campaigns across the facility.
Four Integrated Capabilities That Deliver Higher Yield through Dynamic Process Control
iFactory's adaptive SPC platform combines four integrated capabilities that together replace static control limits with a continuously self-calibrating quality control system. Each capability builds on the next, enabling quality leaders to maintain stable, high-yield production across changing process conditions. Book a Demo to see the platform in operation on live tempering line data.
Yield Improvement ROI from Adaptive SPC Deployment
The quality leader deployed iFactory's adaptive SPC platform across four glass tempering lines over 12 weeks. The following results represent the measured performance improvement from fixed-limit baseline to adaptive-limit steady state.
| Metric | Fixed SPC Limits | Adaptive SPC Limits | Improvement |
|---|---|---|---|
| First-Pass Yield | 82% | 89% | +7 points |
| False Alarm Rate | 87% of signals | 8% after calibration | -91% reduction |
| Signal Detection Latency | 4.2 hours avg | < 1 minute | 99.6% faster |
| Process Capability (Cpk) | 1.12 | 1.48 | +32% improvement |
| Scrap Rate | 11.5% | 5.8% | -50% reduction |
| Annual Quality Cost (4 lines) | $2.80M | $1.40M | -50% reduction |
| Limit Recalibration Frequency | Every 6 months | Continuous real-time | Full automation |
| Annual Net Savings | — | $960K | 2.8x ROI by month 4 |
Why Adaptive SPC Limits Deliver Higher Yield for Glass Tempering Operations
Fixed limits create a structural blind spot between false alarms and missed signals. The most significant limitation of traditional SPC is the unavoidable trade-off between sensitivity and stability. Narrow limits catch real shifts but generate unsustainable false alarm rates. Wide limits reduce false alarms but allow real process drifts to go undetected. Adaptive SPC eliminates this trade-off by recalibrating limits to match current process capability — capturing real signals while filtering normal variation. The documented 91% reduction in false alarms and 50% scrap reduction were achieved simultaneously.
Dynamic limits reflect actual process capability rather than historical assumptions. Fixed control limits are typically calculated from a single capability study performed during stable production conditions. Those limits become progressively less relevant as furnaces age, material suppliers change, and product mix shifts. Adaptive SPC limits are recalculated continuously against current process data, ensuring that control limits always reflect the actual process capability of today's production environment rather than a snapshot from six months ago.
Real-time stability scoring shifts quality from retrospective to proactive. Traditional SPC produces a control chart at the end of each shift or batch. Quality leaders review last night's data and decide whether to adjust today's settings. Adaptive SPC computes process stability scores in real time, enabling operators and quality engineers to respond to developing drifts before they produce non-conforming product. The compression of signal detection latency from 4.2 hours to under 1 minute is an operational capability that fundamentally changes how the plant manages process risk.
The structured 12-week deployment eliminates quality system disruption risk. Glass tempering quality leaders face legitimate concerns about deploying AI-driven SPC in regulated production environments. iFactory's phased deployment — fixed-limit baseline assessment, parallel validation with existing methods, and ROI confirmation before full cutover — ensures every investment decision is supported by plant-specific data. The 8% false alarm rate achieved after calibration was validated against the 87% baseline before any fixed limits were retired.
From Static Control Charts to Dynamic Process Intelligence in One Quarter
This adaptive SPC deployment demonstrates that the gap between fixed control limits and dynamic process control is not a technology gap — it is a methodology gap. iFactory's structured 12-week deployment applies proven AI-driven limit calibration, real-time stability monitoring, and operational best practices to deliver measurable yield improvement within a single quarter. The 7-point yield improvement, $960K net annual savings, and 4.3-month payback are direct outcomes that compound across additional tempering lines as the platform scales. The reduction of false alarms from 87% to 8% and the compression of signal detection latency from 4.2 hours to under 1 minute are operational capabilities that fundamentally change how the quality team manages process stability. Book a Demo to review the deployment plan for your tempering operations.
.png)