Every quality team has sat through the same ritual: a room full of engineers spends two full days building a failure mode and effects analysis, everyone agrees on the severity, occurrence, and detection scores, and the document gets filed away. Six months later a new supplier, a process change, or a new failure mode has already made half of those scores wrong, but nobody revisits the document until the next scheduled audit. FMEA is not a bad tool, it is a static one being asked to describe a process that keeps changing underneath it. The fix is not doing FMEA less carefully, it is keeping the same analysis alive using the production and quality data your plant already generates. If your FMEA lives in a spreadsheet that only gets opened once a year, book a demo and we will show what a living FMEA looks like in practice.
Risk Analysis
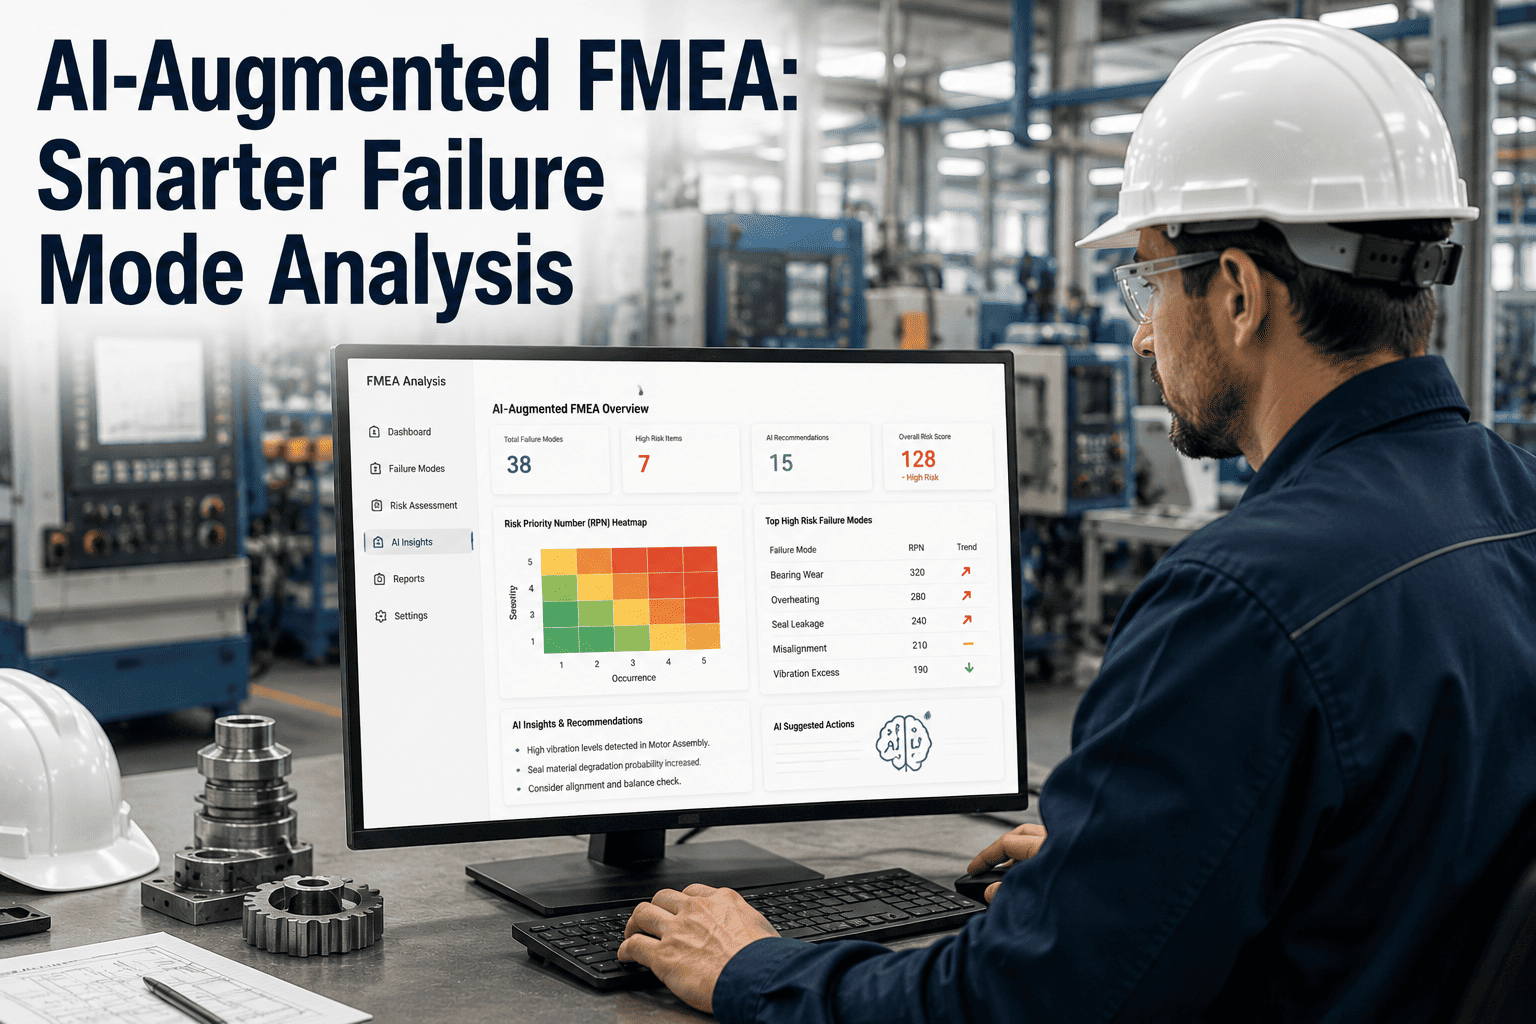
AI-Augmented FMEA: Keeping Failure Mode Analysis Alive
Why a workshop-built FMEA goes stale within months, and how production data keeps the analysis current automatically
Why Traditional FMEA Goes Stale So Quickly
An FMEA built once in a conference room reflects the process as it existed on that specific day, and plants rarely stay unchanged for long.
Scores Are a Snapshot
Severity, occurrence, and detection ratings reflect the process at one point in time and are rarely revisited between formal reviews.
Real Failure Data Lives Elsewhere
Actual occurrence rates sit in quality and maintenance systems that the FMEA document never connects back to.
Changes Outpace the Review Cycle
New suppliers, tooling, and process tweaks happen continuously, while formal FMEA reviews often happen only once a year.
The Three Factors Behind Every Risk Score
S
Severity
How serious the consequence is if the failure mode occurs, typically rated on a fixed scale agreed by the team.
O
Occurrence
How frequently the failure mode is expected to happen, ideally grounded in real historical failure data rather than a guess.
D
Detection
How likely current controls are to catch the failure before it reaches the customer, based on the inspection methods actually in place.
Risk Priority Number equals Severity multiplied by Occurrence multiplied by Detection, and any one of the three going stale skews the entire number
Static Workshop FMEA vs a Living FMEA
| Aspect |
Static Workshop FMEA |
Living FMEA |
| Occurrence scoring |
Estimated from memory during the workshop |
Calculated from actual quality and maintenance records |
| Update frequency |
Annual or after a major incident |
Continuous, as new failure data arrives |
| New failure modes |
Added only at the next scheduled review |
Flagged automatically as they appear in production data |
| Detection accuracy |
Reflects controls that existed at review time |
Reflects current inspection and monitoring methods |
See What Your FMEA Would Look Like Live
Bring your current FMEA spreadsheet and we will show which occurrence and detection scores your production data would actually update.
How AI Keeps the Analysis Current
1
Connect quality and maintenance data sources
2
Recalculate occurrence scores from real failure rates
3
Flag new or rising failure modes automatically
4
Route updated risk priority numbers to the review team
Mistakes That Keep an FMEA Stuck as a Static Document
Scoring occurrence from opinion, not data
Even a well-intentioned engineering estimate drifts from reality once actual failure rates start moving in a different direction.
Treating the FMEA as an audit artifact
A document maintained only to satisfy an audit checklist rarely gets used for actual day to day risk decisions on the floor.
No link between FMEA and control plans
When the detection column is not tied to the actual inspection methods in place, the score becomes disconnected from reality.
Waiting for the annual review to add new modes
A failure mode that appeared last month sits unscored and unmanaged until the next scheduled workshop months away.
Frequently Asked Questions
Does this replace the FMEA workshop entirely?
No, the initial workshop where the team defines failure modes, effects, and causes is still valuable and should still happen. What changes is what happens after the workshop, where occurrence and detection scores update from real data instead of sitting fixed until the next scheduled session.
What data sources feed into a living FMEA?
Quality inspection records, maintenance work orders, and defect tracking systems are the most common sources, since they already capture how often failure modes actually occur. The system needs to be told which data source corresponds to which failure mode during setup, and from there the scoring updates continuously.
Will this change our FMEA format or scoring scale?
No, the severity, occurrence, and detection scale your team already uses stays the same. The change is in how the occurrence and detection numbers get calculated, moving from a periodic estimate to a continuously updated figure grounded in your own production data.
How does the system flag a brand new failure mode?
When a defect or failure pattern appears in the connected data that does not match an existing entry in the FMEA, it gets surfaced to the review team as a candidate new failure mode rather than silently going unscored.
Book a demo to see how new modes are presented for review.
Is this suited for a small quality team without dedicated FMEA staff?
Yes, in fact smaller teams often benefit the most, since automating the score updates removes the burden of manually tracking failure rates across every part number. Reach out to
support if you want to see how this fits a leaner quality team's existing workload.
Stop Managing Risk From a Document Nobody Opens
Bring your current FMEA and recent quality data, and we will show exactly which scores have drifted from reality.