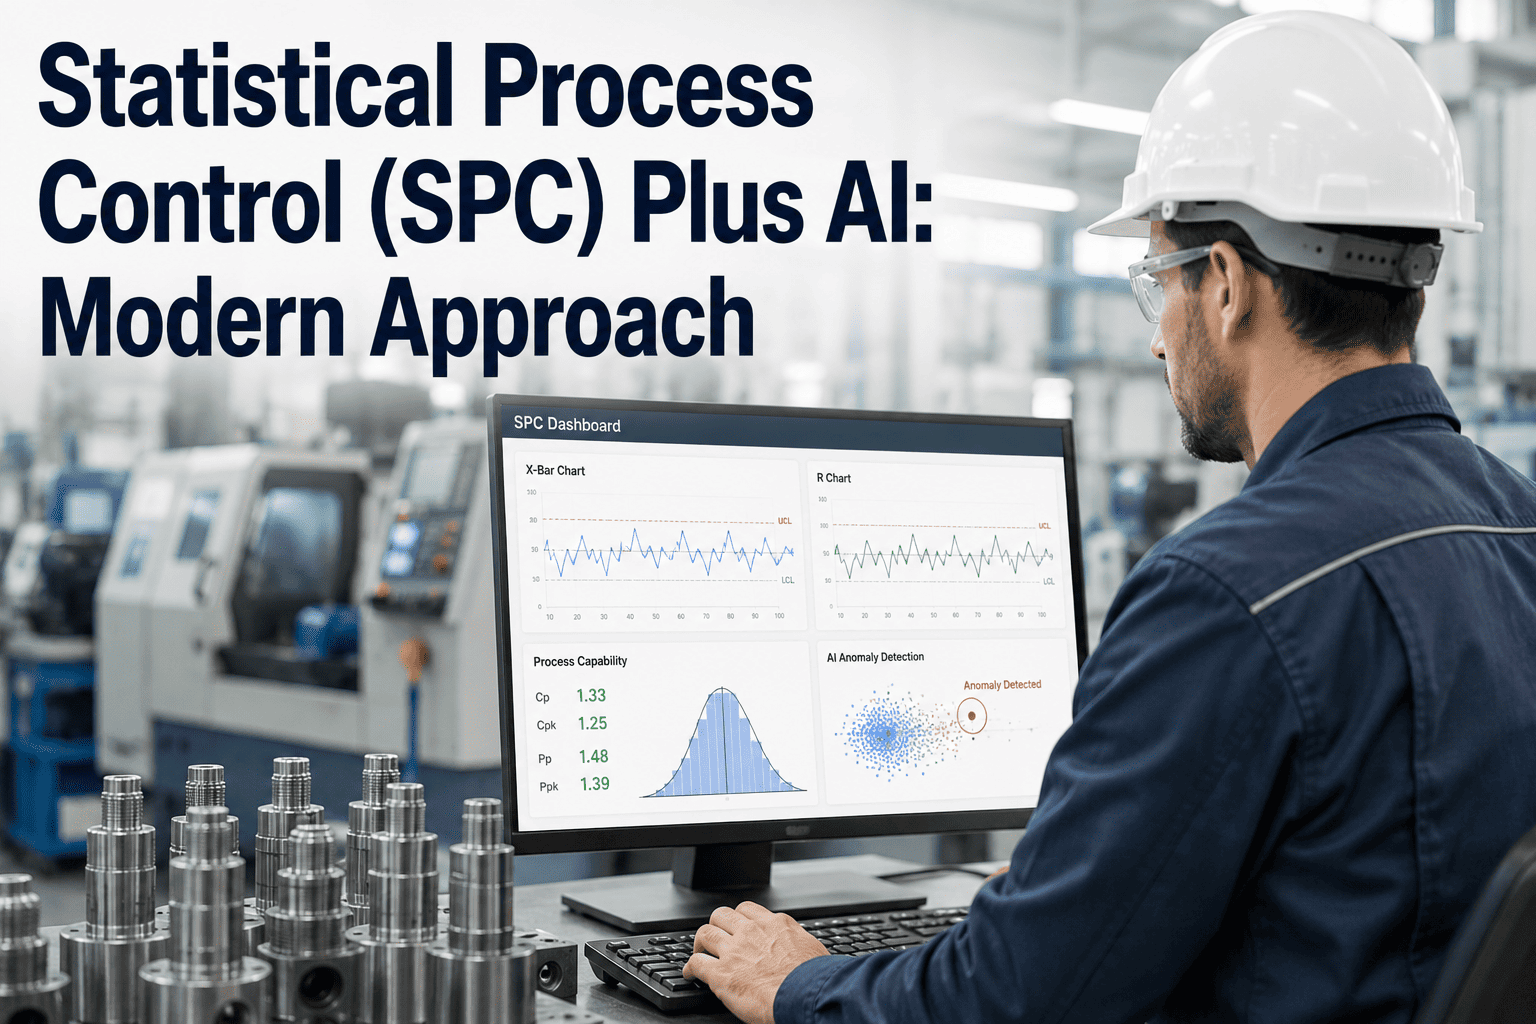
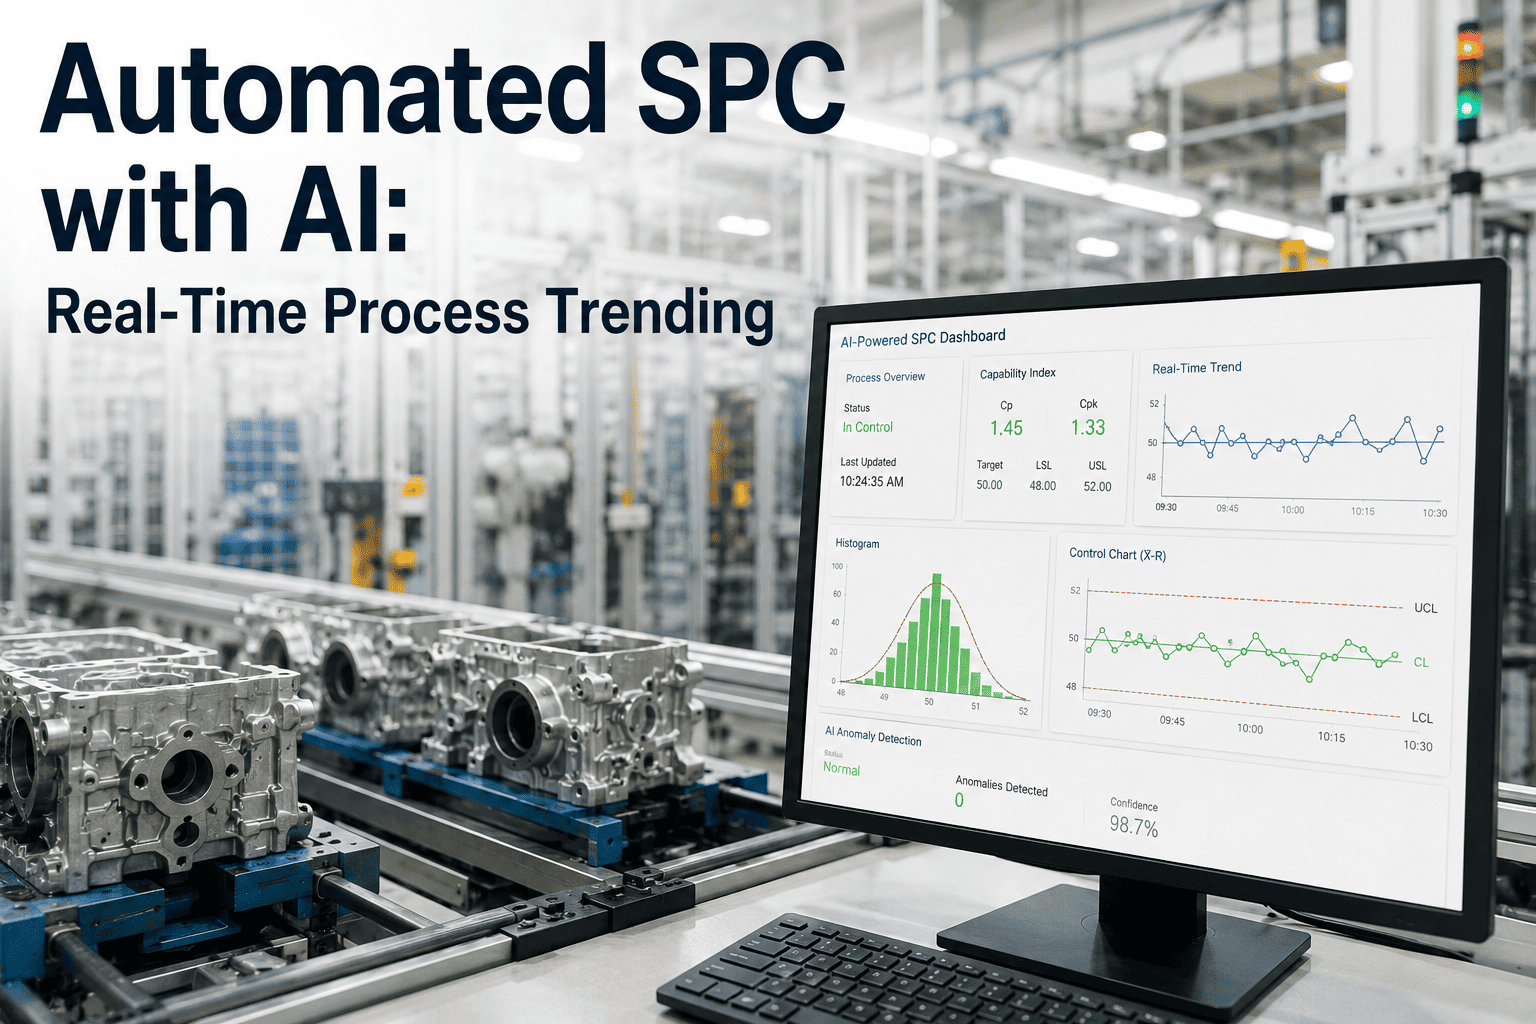
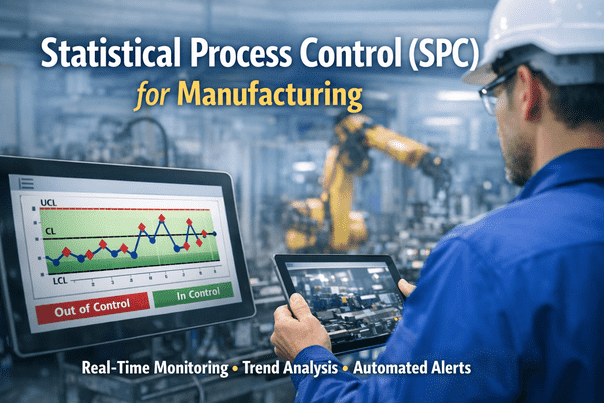
Statistical process control has been the backbone of shop floor quality for seven decades, and the core idea still holds up: plot a measurement, watch for it drifting outside control limits, act before it becomes a defect. What has not kept pace is the speed of detection. A classic X-bar chart typically needs several consecutive out-of-control points before a shift is confirmed, and by then the process may have already produced scrap. AI does not replace the chart, it watches the same data with more sensitivity and catches the drift hours earlier. If your SPC program still relies on someone noticing a pattern on a chart, book a demo and we will show what AI-enhanced monitoring catches on your process data.
Quality Systems
Statistical Process Control Plus AI: The Modern Approach
Seventy years of proven SPC theory, now catching process drift hours before a traditional control chart would flag it
What a Classic Control Chart Catches, and Misses
An X-bar and R chart is built to flag a process that has already shifted meaningfully, which means smaller, earlier drifts often pass through undetected until the shift accumulates.
Upper Control Limit
Gradual drift building here goes unflagged by a standard chart until it crosses the limit
Lower Control Limit
Where AI Extends What SPC Can See
Layer 1
Traditional Control Limits
Standard upper and lower bounds based on process capability, still the foundation of the monitoring system.
Layer 2
Pattern Recognition Rules
Runs, trends, and cyclical patterns are flagged automatically instead of relying on a person spotting them visually.
Layer 3
Multivariate Correlation
AI watches multiple process variables together, catching combinations that would look normal on any single chart alone.
Classic SPC vs AI-Enhanced SPC
| Capability |
Classic SPC |
AI-Enhanced SPC |
| Detects a hard control limit breach |
Yes |
Yes |
| Detects gradual drift before a breach |
Limited, depends on manual pattern review |
Yes, flagged automatically |
| Correlates multiple variables at once |
Requires separate charts per variable |
Yes, watched together continuously |
| Adapts limits as the process matures |
Manual recalculation required periodically |
Recalibrates continuously against real data |
See Where Your Charts Have a Blind Spot
Bring a sample of your process data and we will show which drifts a traditional chart would have caught late, or missed.
Signals AI Catches Before the Chart Reacts
Slow Mean Shift
A gradual drift toward one control limit that stays inside the bounds for many samples before finally breaching.
Reduced Variation Clustering
Data points tightening unnaturally close to the centerline, often a sign of a sensor or measurement issue rather than genuine process improvement.
Cross-Variable Drift
Two related measurements moving together in a way that looks fine individually but signals a shared root cause.
Shift-to-Shift Divergence
A process that behaves differently across operators or shifts without ever technically leaving the control limits.
How Teams Roll This Into an Existing SPC Program
1
Connect existing SPC data sources
2
Run AI monitoring alongside current charts
3
Validate flagged drifts against real outcomes
4
Fold alerts into the daily quality review
Mistakes That Undermine an SPC Modernization
Replacing charts instead of augmenting them
Operators still need a visible chart on the floor. AI should add an early warning layer, not remove the tool they already trust.
Ignoring measurement system variation
If the gauge or sensor itself is noisy, AI will flag phantom drifts that have nothing to do with the actual process.
Not validating alerts before trusting them
Running the system in parallel with human review for a period first builds confidence before alerts drive real decisions.
Overloading operators with too many alerts
Every new signal type needs a clear priority level, or the volume of alerts trains people to ignore all of them equally.
Frequently Asked Questions
Does this replace our existing control charts?
No, the control charts your operators already use stay in place as the primary floor-level tool. AI runs as an additional layer watching the same data for patterns that a chart alone would take longer to reveal, giving your quality team earlier notice without changing what operators see on the line.
What data do we need to get started?
Historical measurement data from your existing SPC system is usually enough to begin, since the model can learn your process's normal variation from what you already collect. No new sensors or measurement systems are required to start, though additional data sources can be added later for broader coverage.
How is this different from just tightening our control limits?
Tightening limits increases false alarms on normal variation, while AI-based detection looks for the shape of a pattern rather than a single threshold crossing. This means it can catch a genuine slow drift without generating extra noise from ordinary process variation.
Book a demo to see the difference on your own data.
Will this work with our existing quality management software?
Most SPC and quality platforms expose the underlying data through a database connection or export, which is enough to connect an AI monitoring layer alongside them. The integration typically does not require replacing the quality software your team already relies on.
How long before the system learns our process well enough to trust it?
Most processes with a reasonable history of existing SPC data can establish a working baseline within the first few weeks, though the parallel validation period against human review typically runs a bit longer before alerts are fully trusted. Reach out to
support for a more specific estimate based on your process history.
Catch the Drift Before the Chart Does
Bring your existing SPC data and we will show what AI-enhanced monitoring would have flagged earlier over your last few months of production.