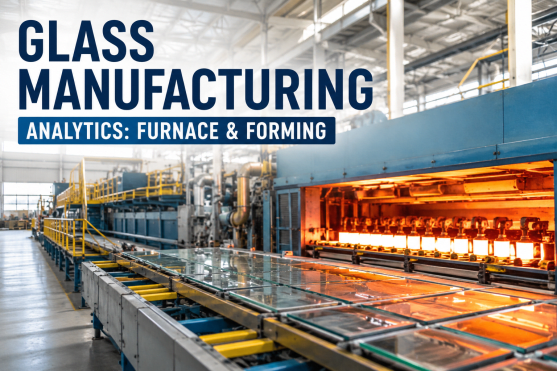
Glass manufacturing is a continuous thermal process where furnace temperatures exceeding 2,800°F, forming machine cycle rates measured in seconds, annealing lehr residence times calculated in hours, and inspection system rejection rates tracked in parts per million combine to create one of the most data-intensive production environments in industrial manufacturing. Each glass plant generates terabytes of process data daily from thermocouple arrays in the melting furnace, pull speed sensors on forming machines, temperature zone controllers in annealing lehrs, and vision inspection stations at cold-end quality checkpoints — yet most management teams lack the integrated analytics layer to convert that data into actionable production intelligence. A 1% improvement in furnace energy efficiency at a mid-size glass container plant represents $40,000–$80,000 in annual fuel cost reduction, while a 2% reduction in forming defect rate at a float glass facility can recover $200,000–$500,000 in annual yield value. iFactory AI's industrial analytics platform closes the gap between raw process data and measurable operational improvement by ingesting real-time furnace, forming, annealing and inspection data into a unified intelligence layer purpose-built for glass manufacturing environments. This guide covers the analytics architecture, equipment-specific monitoring configurations, and deployment strategies that glass plants are using to convert machine and process data into measurable gains in energy efficiency, forming yield, quality consistency, and overall equipment effectiveness.
Why Glass Manufacturing Analytics Requires a Process-Integrated Approach
Unlike discrete manufacturing where analytics focus on individual machine cycles and throughput, glass manufacturing analytics must address a continuous thermal process where conditions in the furnace directly determine outcomes at the forming station, which in turn dictate annealing requirements and final quality. A temperature excursion in the melting furnace — a crown hot spot shifting by 15°F — propagates through the refiner, forehearth, and delivery system to change gob temperature at the forming machine by 8–12°F within 20 minutes, shifting glass viscosity enough to cause a 3–5% increase in wall thickness variation across the container or sheet. This interconnected process dynamic means analytics must be process-wide, not machine-isolated.
The equipment-specific analytics approach means glass plants can deploy monitoring configurations that match their actual process failure mode profile rather than applying generic thresholds. iFactory AI's analytics modules are pre-configured for each glass process stage — furnace melting, fining, conditioning, forming, annealing, cold-end inspection — and calibrated during the standard 8–12 week deployment. Book a Demo to review equipment-specific configurations for your glass plant.
Furnace Analytics: Thermal Profiling, Energy Optimization, and Refractory Life Management
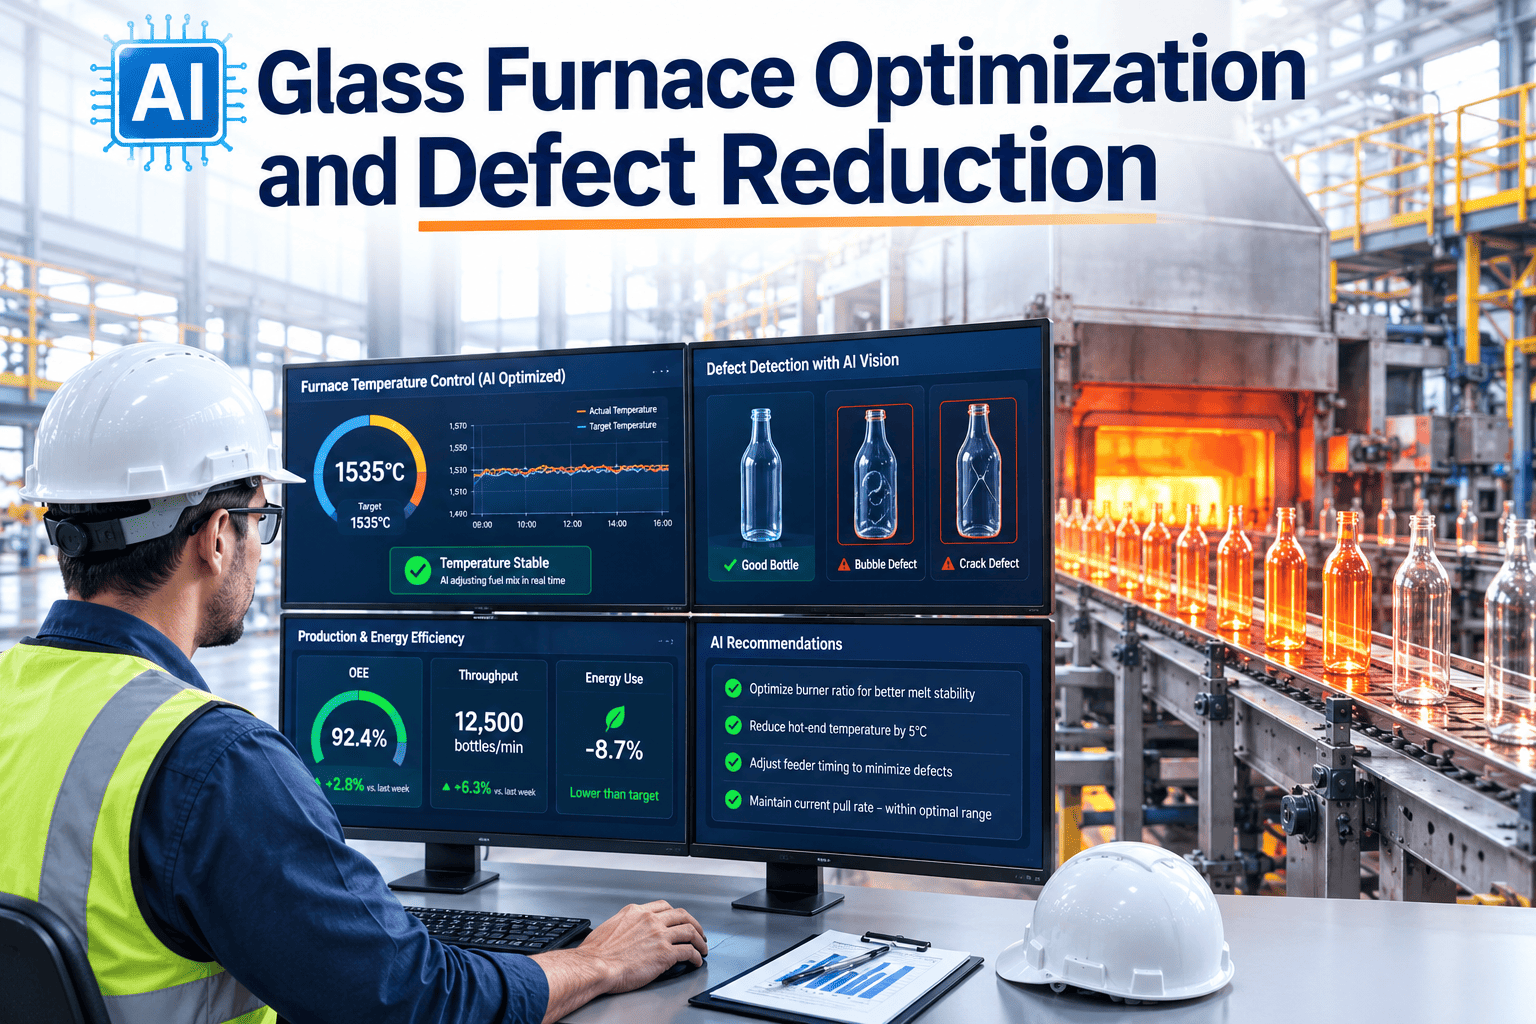
The glass melting furnace is the single most capital-intensive asset in any glass plant, with a typical rebuild cycle of 8–15 years at a cost of $8 million to $25 million depending on furnace size and type. Analytics that extend furnace campaign life by even one year deliver returns measured in millions. iFactory AI's furnace analytics module ingests data from crown thermocouples, sidewall thermocouples, flame port cameras, batch feeder sensors, and flue gas analyzers to build a continuous thermal model of the furnace that identifies developing issues 4–8 hours before they would appear in traditional temperature log review.
Forming and Annealing Analytics: Cycle Optimization, Defect Reduction, and Quality Traceability
The forming stage — whether glass container IS machines, float glass tin bath forming, or fiberglass bushing forming — is where the furnace's thermal output is converted into salable product, and where the largest quality and yield improvement opportunities exist. A 1% forming yield improvement at a container glass plant with six 10-section IS machines running at 350 containers per minute per machine represents approximately 300,000 additional salable containers per month — revenue impact of $45,000–$90,000 depending on product mix. iFactory AI's forming analytics module correlates gob weight, mold temperature, blank and blow mold dwell times, vacuum pressure, and cooling air flow to develop predictive defect models that alert operators to developing quality issues 5–15 minutes before reject rates exceed target.
Gob Weight and Temperature Control — The Glass Delivery Foundation
Analytics begins at the forehearth exit where gob weight, temperature, and viscosity determine every downstream forming outcome. iFactory AI ingests gob weight sensor data, forehearth zone temperatures, and shear mechanism timing to predict gob weight variation 10–20 cycles before it reaches rejectable limits. The platform correlates gob temperature variation with furnace thermal profile changes, enabling the hot-end team to address furnace conditions affecting gob quality before the forming section experiences yield loss. Plants deploying gob weight predictive analytics document a 15–25% reduction in weight-related rejections within the first 60 days of deployment.
Mold Temperature and Cycle Optimization — Forming Consistency at Speed
Mold temperature is the single most dynamic variable in glass container and pressware forming, changing by 50–100°F between start-up and steady-state operation and varying across the mold cavity array by 20–40°F under normal conditions. iFactory AI's forming analytics module tracks each mold cavity's temperature profile, blank and blow mold dwell times, cooling air flow, and lubricant application to build cavity-specific performance models. When a cavity begins trending toward out-of-spec temperature, the platform alerts the forming operator 8–12 minutes before the defect shows up at cold-end inspection — enough time to adjust cooling or schedule a mold change during the next job rotation rather than reacting to a reject spike.
Annealing Lehr Profile Control — Stress Management and Breakage Prevention
The annealing lehr is the temperature-controlled conveyor system where glass containers or sheets undergo controlled cooling to relieve thermal stresses — and it is the stage most likely to operate outside specification without detection until cold-end breakage rates reveal the problem. iFactory AI's annealing analytics module monitors each lehr zone temperature, belt speed, and glass temperature at entry and exit to calculate the actual cooling profile versus the target annealing curve. When thermal profile drift exceeds specification, the platform alerts the hot-end team with specific zone adjustment recommendations — converting a process parameter that most plants check twice per shift into a continuously monitored, analytics-driven control loop.
Cold-End Inspection Correlation — Closing the Quality Feedback Loop
The highest-value analytics capability in glass manufacturing is the ability to trace cold-end inspection rejects — check detector failures, pressure tester rejects, vision inspection defects — back to the specific furnace, forming, and annealing conditions that caused them at the time of forming. iFactory AI's quality correlation engine matches every cold-end reject to the process snapshot at the moment that container or sheet was formed: furnace crown temperature, gob weight, mold cavity ID, mold temperature, forming timing, annealing zone profile, and pack-to-lehr transfer conditions. This closed-loop traceability enables process engineers to identify root causes in hours rather than weeks and to implement corrective actions at the hot-end that prevent defects rather than sorting them at cold-end. Glass plants with full quality feedback loop analytics document a 20–35% reduction in cold-end reject rates within 6 months of deployment.
iFactory Integration Architecture for Glass Manufacturing Analytics
The operational value of glass manufacturing analytics depends on the depth and reliability of the integration between the analytics platform and the plant's existing control systems, quality systems, and maintenance management platforms. iFactory AI's platform is built as the integration backbone for glass plant digital transformation, providing the furnace control system connectivity, forming machine data acquisition, inspection system integration, CMMS connectivity, and analytics layer that converts process data into actionable production intelligence. The platform connects to existing PLCs, DCS, SCADA, and MES infrastructure without requiring equipment replacement or control system modification. Book a Demo to see iFactory's integration architecture configured for your specific glass manufacturing environment.
| Integration Layer | Glass Plant Data Source | Analytics Capability | iFactory Module | Measured Impact |
|---|---|---|---|---|
| Furnace DCS Integration | Crown thermocouples, sidewall TC array, flame port cameras, flue gas analyzers, batch chargers | Real-time thermal profile monitoring, specific energy tracking, refractory wear trend prediction | Furnace Analytics Module with multi-zone thermal model and combustion optimization AI | 12–18% energy reduction; 8–14 month extended furnace campaign |
| Forming Machine Integration | IS machine controllers, gob weight sensors, mold temperature probes, vacuum/pressure transducers | Cavity-specific performance monitoring, gob weight prediction, mold temperature trend analytics | Forming Analytics Module with per-cavity model and predictive defect alert engine | 25–35% defect rate reduction; 15–25% weight-related reject reduction |
| Annealing Lehr Integration | Zone temperature controllers, belt speed drives, glass temperature pyrometers (entry/exit) | Cooling profile vs. target curve monitoring, zone-specific drift detection and adjustment recommendations | Annealing Analytics Module with thermal profile conformance tracking | 30–50% reduction in thermal-stress-related breakage |
| Inspection System Integration | Check detectors, pressure testers, vision inspection stations, thickness gauges | Real-time defect trending, cold-end reject correlation to hot-end process parameters | Quality Analytics Module with lot genealogy tracing and root cause correlation engine | 20–35% cold-end reject rate reduction; root cause in hours vs. weeks |
| CMMS Integration | Maintenance work orders, PM schedules, equipment history, spare parts inventory | Predictive maintenance alerts, condition-based PM scheduling, equipment health scoring | Predictive Maintenance Module with glass-equipment-specific failure mode models | 30–45% unplanned downtime reduction; 15–25% maintenance cost reduction |
| OEE and Production Analytics | Production counts, changeover times, speed data, reject data, schedule attainment | Line-level OEE tracking, bottleneck identification, shift performance analytics with trend context | Production Analytics Module with glass-specific availability, performance, and quality metrics | 5–10% overall OEE improvement; shift-level performance visibility |
Glass Manufacturing Applications by Process Type
Different glass manufacturing processes — container glass, float glass, fiberglass, and specialty glass — have distinct analytics requirements shaped by their forming technology, product geometry, quality specifications, and production volume profiles. iFactory AI's platform adapts its analytics configurations to each process type while maintaining a common integration architecture and data model. The following sections detail the specific analytics deployment approach for each glass manufacturing process type.
Container Glass — High-Speed IS Machine Analytics for Maximum Yield
Container glass plants operate IS (individual section) machines at cycle rates of 200–450 containers per minute with 6 to 20 sections, each producing 1 to 4 containers per cycle depending on machine configuration and product design. The analytics challenge is managing per-cavity variation across 24 to 80 simultaneous mold cavities while maintaining gob weight consistency, mold temperature stability, and annealing profile conformance at line speeds where a 5-minute drift in a single cavity can produce 500–1,500 out-of-spec containers before cold-end inspection detects the problem. iFactory AI's container glass analytics module monitors every cavity on every IS machine, tracking mold temperature, gob weight per cavity, blank and blow mold dwell times, and cooling air pressure — generating cavity-specific trend alerts that give forming operators 8–12 minutes of advance warning before quality drift reaches reject threshold.
Float Glass — Tin Bath Forming and Sheet Quality Analytics
Float glass manufacturing transforms molten glass into continuous ribbon on a molten tin bath — the most precise forming process in glass manufacturing, producing sheet with thickness tolerances measured in hundredths of a millimeter. The analytics challenge in float glass is maintaining thermal uniformity across the tin bath width (typically 3–5 meters) while controlling ribbon speed, tin temperature profile, top roller pressure, and lehr cooling rate to achieve target thickness, flatness, and optical quality. iFactory AI's float glass analytics module ingests data from the tin bath thermocouple array, top roller position sensors, ribbon pyrometers, and online thickness gauges to build a continuous forming model that detects developing quality issues — thickness drift, edge curl, anisotropy — 15–30 minutes before they appear in downstream inspection.
Fiberglass — Bushing Forming and Fiber Property Analytics
Fiberglass manufacturing uses platinum-rhodium bushings with hundreds or thousands of individual orifices to draw molten glass into continuous filaments, with fiber diameter tolerance measured in microns and production speeds reaching 15–30 meters per second per filament. The analytics challenge in fiberglass is maintaining glass viscosity and temperature uniformity across the bushing plate while monitoring filament break rates, fiber diameter distribution, and size application consistency — all at line speeds where a 2°F bushing temperature variation shifts fiber diameter by 0.5–1.0 microns. iFactory AI's fiberglass analytics module monitors bushing temperature distribution, glass level in the forehearth, filament break rate by bushing position, and fiber diameter online measurement to provide real-time forming quality visibility and predictive alerts for developing process issues.
Expert Review: Lessons From Glass Manufacturing Analytics Deployments
I have been in glass manufacturing operations for 22 years — float, container, and fiberglass — and I have seen every generation of process control technology in that time. What is different about the current generation of AI-powered industrial analytics is that it finally addresses the interconnection problem between furnace conditions, forming performance, and final quality that we have always known existed but never had the tools to analyze systematically. We deployed iFactory AI's platform at our container glass plant 14 months ago on a furnace feeding two 10-section IS machine lines. The biggest single insight in the first 90 days was discovering a correlation between a 10°F crown temperature oscillation that occurred every 4–6 hours and a corresponding 2.5% variation in gob weight on one of the two forehearths — a relationship that had been invisible because the furnace DCS and the IS machine controllers operated on separate data systems with no cross-referencing. Correcting the oscillation reduced weight-related rejects on that line by 18% in the first month. The cold-end inspection integration has been equally transformative: we can now trace a check detector reject back to the specific mold cavity, forming cycle, and furnace temperature at the time that container was formed — and close the feedback loop in under 30 minutes instead of the 2–3 days it took with manual correlation. For operations leaders evaluating glass analytics: the technology works, the business case is clear at any plant producing more than 200 tons per day, and the deployment timeline is shorter than you expect — we were live with furnace and forming analytics in 9 weeks.
— Plant Manager, U.S. Container and Float Glass Manufacturing — 22 Years Industry Experience — iFactory AI Reference Customer 2026Conclusion
Glass manufacturing analytics represents a proven operational improvement opportunity for plants operating furnace, forming, annealing, and inspection equipment — from container glass IS machines running at 400 containers per minute to float glass tin baths producing architectural-quality sheet to fiberglass bushings drawing filaments at 20+ meters per second. The interconnection between furnace thermal conditions, forming machine settings, annealing lehr profiles, and final quality outcomes creates the analytics value proposition: improvements in any process stage propagate through the entire production system, and analytics is the tool that makes those propagation effects visible, quantifiable, and actionable.
The documented outcomes at glass plants deploying iFactory AI's integrated analytics architecture — 12–18% furnace energy reduction, 25–35% forming defect reduction, 20–35% cold-end reject reduction, and 30–45% unplanned downtime reduction — are the result of addressing real operational constraints that traditional monitoring systems have never reliably solved. iFactory AI's platform is deployable in 8–12 weeks without replacing existing DCS, PLC, SCADA, or MES infrastructure. Book a Demo to see how iFactory AI's analytics platform is configured for glass furnace, forming, and quality applications at your specific plant.
Frequently Asked Questions
iFactory AI monitors crown and sidewall temperature profiles across all furnace zones, specific energy consumption (MMBtu/ton), flue gas oxygen and NOx levels, glass level and batch charger performance, refractory wear trends via thermal gradient analysis, and bubble/cord formation correlation with thermal and chemistry variations. The platform ingests data from existing furnace DCS thermocouples, flame port cameras, and flue gas analyzers without requiring additional sensor installation. Book a Demo to review furnace analytics configurations for your specific glass furnace type.
iFactory AI's forming analytics module monitors every mold cavity individually, tracking mold temperature, gob weight per cavity, blank and blow mold dwell times, and cooling air pressure across all sections. The platform generates cavity-specific trend alerts 8–12 minutes before quality drift reaches reject threshold — enabling forming operators to make targeted adjustments per cavity rather than reacting to a bulk reject spike. The module also correlates cold-end inspection rejects back to specific cavities and forming cycle parameters, closing the quality feedback loop and enabling root cause identification in hours rather than days.
Yes. iFactory AI connects to existing furnace DCS, PLC-based forming machine controllers, annealing lehr zone controllers, and cold-end inspection systems through standard industrial communication protocols including OPC-UA, Modbus TCP, Siemens S7, Allen-Bradley Ethernet/IP, and REST API interfaces. The platform does not require replacement of existing control infrastructure and deploys alongside current systems during a standard 8–12 week implementation. Integration with CMMS, MES, and ERP systems is included in the standard deployment scope.
iFactory AI's predictive maintenance module analyzes equipment-specific data streams — furnace refractory temperature gradients, sidewall thermocouple trends, IS machine section timing variances, forehearth heating element current draw, lehr belt tension and tracking data — to generate equipment health scores and failure probability assessments. When an asset's failure probability exceeds threshold, the platform generates a maintenance recommendation with 72+ hours of advance notice, enabling the maintenance team to schedule intervention during planned changeovers rather than reacting to a breakdown mid-production. Glass plants with full predictive maintenance integration document 30–45% reduction in unplanned furnace and forming line downtime.
Most glass plants deploying iFactory AI document positive ROI within 4–8 months, driven primarily by forming yield improvement and energy cost reduction from the first three months of analytics-driven process optimization. Furnace energy savings of 12–18% and forming defect reduction of 25–35% typically materialize within 60–90 days as the analytics models calibrate to the specific furnace and forming equipment profile. The longer-term value — extended furnace campaign life, reduced cold-end rejects via quality traceability, and ongoing OEE improvement — compounds over 12–24 months. The platform deploys in 8–12 weeks without requiring replacement of existing DCS, PLC, SCADA, or inspection systems.

.png)