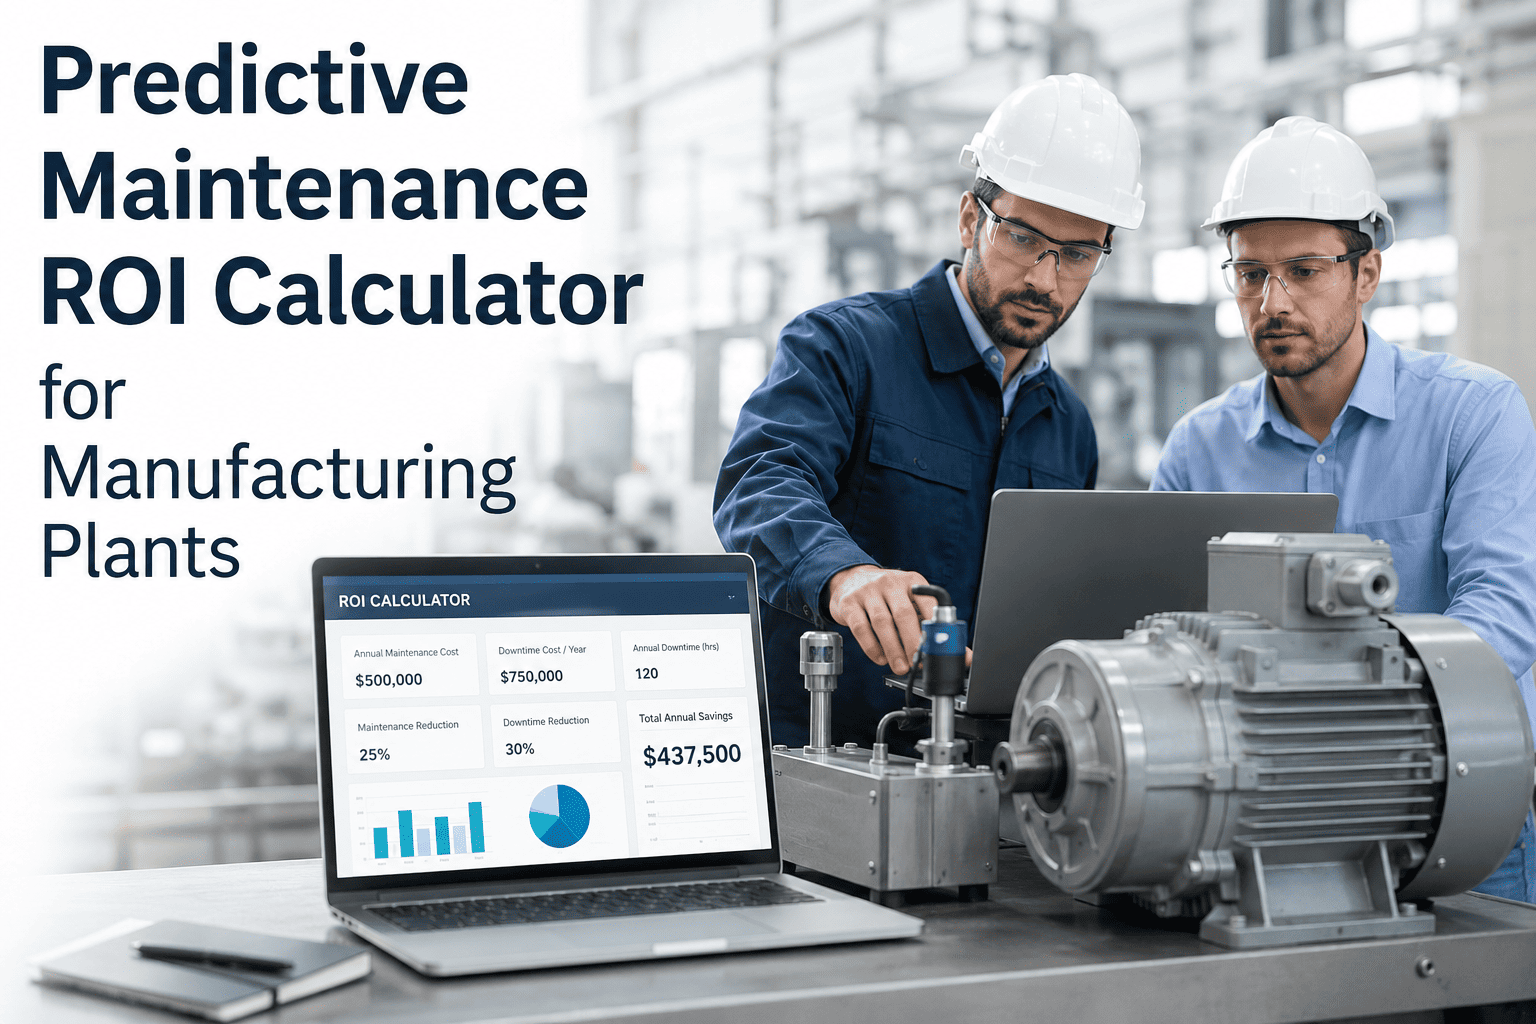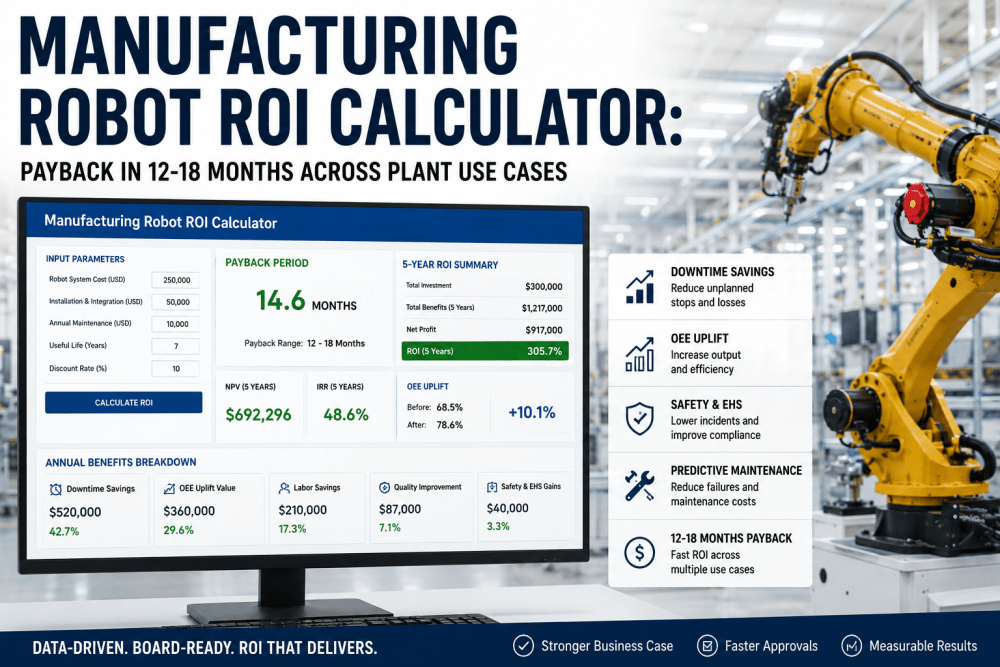
The boardroom conversation has shifted. Manufacturing leaders no longer ask whether to automate—they ask how fast the robot pays for itself. With U.S. labor costs running $50–$70 per hour fully loaded, downtime costs hitting $125,000 per hour median, and robot prices dropping 40% year-over-year in some categories, the math now favors automation across nearly every plant use case. This guide gives you a board-ready ROI framework with real numbers, OEE uplift math, predictive maintenance savings, RaaS-vs-CAPEX comparisons, and a 12–18 month payback playbook you can defend to your CFO.
A Board-Ready ROI Framework Across Plant Use Cases
The Core ROI Formula Every Plant Manager Should Use
Most ROI proposals fail board scrutiny because they only count labor savings. The defensible formula captures four value drivers: direct labor cost reduction, throughput gains, quality and scrap improvements, and downtime avoided through predictive maintenance. The payback period equation is straightforward—but the inputs are where the rigor lives.
Robot Payback by Plant Use Case: Real 2026 Numbers
Payback varies dramatically by application, shift count, and integration scope. A cobot tending a CNC machine on two shifts pays back faster than a heavy 6-axis welding cell on one shift. The table below maps realistic ranges based on industry deployment data—use these as benchmarks when you build your own model.
| Plant Use Case | Robot Type | Installed Cost | Annual Savings | Payback Window |
|---|---|---|---|---|
| CNC Machine Tending | Cobot (UR10/equivalent) | $75K–$120K | $90K–$140K | 8–14 months |
| Pick & Place / Kitting | Cobot + Vision | $85K–$140K | $80K–$130K | 10–18 months |
| Robotic Welding Cell | 6-axis Industrial | $180K–$320K | $150K–$220K | 14–24 months |
| Palletizing & Packaging | Cobot / Light Industrial | $95K–$160K | $90K–$150K | 12–18 months |
| AI Visual Inspection | AI Vision + Robotics | $60K–$110K | $70K–$120K | 8–16 months |
| Material Handling AMR | Autonomous Mobile Robot | $50K–$95K/unit | $55K–$90K | 10–18 months |
| Heavy Press / Forging | High-payload 6-axis | $220K–$400K | $160K–$250K | 16–28 months |
Want a sensitivity-tested ROI model for your exact plant? Book a Demo and we'll walk you through iFactory AI's robot-ROI calculator built on real OEE and downtime data.
OEE Uplift: Where the Hidden Money Lives
The average discrete manufacturer scores 66.8% OEE, leaving roughly one-third of planned production unrealized. Only 3% of plants reach world-class at 85%. The gap between those two numbers is where automation pays for itself—often more than the labor-savings line alone. A 20-point OEE improvement on a $15M production line recovers approximately $3.75M in annual capacity without buying a single new machine.
Availability
Robots run lights-out across 2nd and 3rd shifts. Predictive maintenance cuts unplanned downtime 35–45%.
Performance
Consistent cycle times eliminate speed losses from operator fatigue and changeover variability.
Quality
±0.02mm repeatability with AI vision QC drives first-pass yield up and scrap down by 50%+.
Predictive Maintenance ROI: The Overlooked Multiplier
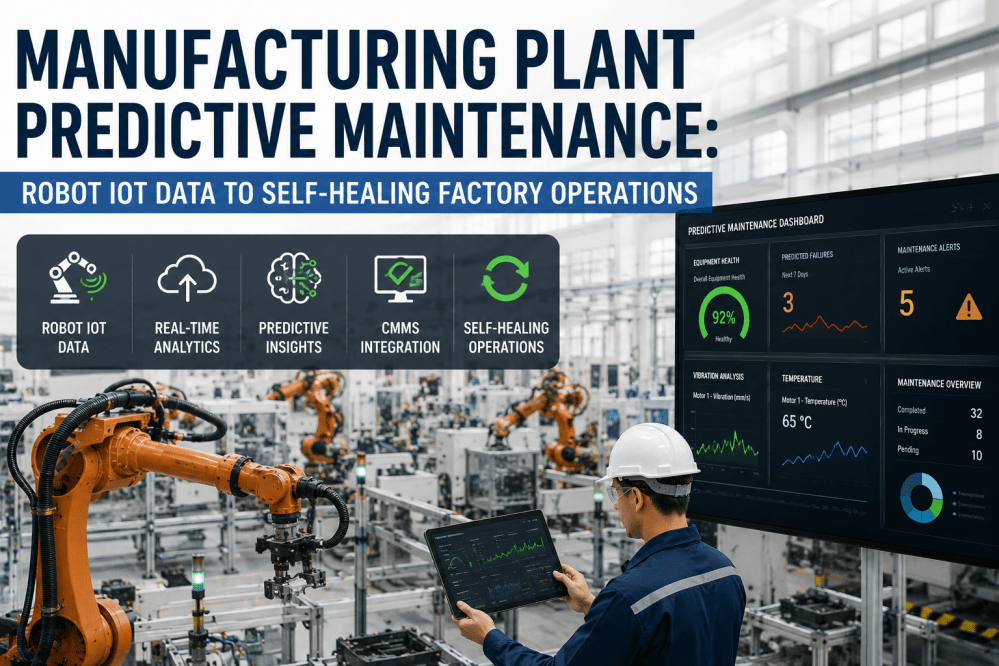
Most CFOs underbudget predictive maintenance gains in robot ROI models. Siemens published a deployment showing 250% ROI within 18 months from a single predictive maintenance program—driven by a 40% reduction in emergency calls and a 15% OEE lift. When you integrate robots with a CMMS and AI-driven condition monitoring, the math compounds.
AI predictive maintenance flags bearing wear, vibration anomalies, and thermal drift before failure.
Optimal-condition operation defers capital replacement of $500K+ machines by 2+ years.
Well-maintained robots and motors run within design specs, cutting kWh per unit produced.
Siemens-documented program outcome combining downtime cuts and maintenance labor savings.
CAPEX vs RaaS: Which Pricing Model Wins?
The decision between buying robots outright (CAPEX) and subscribing through Robotics-as-a-Service (RaaS) depends on capital availability, integration risk, and deployment horizon. RaaS rates typically run $1,500–$8,000 per unit per month, or $2–$5 per operating hour, bundling hardware, software, and field service. CAPEX wins on lifetime cost beyond 18 months; RaaS wins on speed of approval and downside protection.
Outright Purchase
Subscription Model
5-Step Workflow: From Approval to Payback
The fastest-payback deployments follow a disciplined sequence. Skipping baseline measurement is the single biggest reason robot projects miss their ROI targets—you cannot prove improvement against an OEE number you never recorded.
Baseline Your OEE & Downtime
Most factories discover their real OEE is 15–25 points lower than management estimates once automated monitoring kicks in. Capture availability, performance, and quality losses for 30–60 days before procurement.
Identify the Bottleneck Cell
Run a Pareto on losses. If breakdowns dominate, automation plus predictive maintenance wins. If changeover dominates, SMED first then automate. Pick a single cell with the largest loss exposure.
Build the Defensible ROI Model
Include labor, throughput, quality, downtime avoided, energy, and insurance/safety improvements. For payback >24 months, switch to NPV/IRR with your WACC (typically 8–12%).
Pilot, Measure, Iterate
Deploy one cell. Track actual vs forecasted savings weekly through MES and CMMS integration. Refine your model with real data before scaling to the next cell or shift.
Scale With Proof in Hand
One validated cell unlocks faster approvals for the next ten. The Dynamic Group cobot deployment scaled from one shift with three operators to three shifts with one operator per shift—using documented pilot data.
How iFactory AI Powers Each ROI Lever
iFactory AI is built specifically for the levers that drive robot ROI—OEE analytics, predictive maintenance, AI vision inspection, digital twin simulation, and robotics integration—on a single platform with real-time visibility for plant managers and CFOs alike.
OEE Analytics
Automatic OEE calculation from PLC and sensor data with loss Pareto analysis—so every improvement dollar targets the largest loss first.
Predictive Maintenance
AI-driven anomaly detection on vibration, temperature, and current draw. Auto-generated work orders prevent the failures that erode your ROI.
AI Vision Inspection
Sub-millimeter defect detection at line speed. Replaces manual QC, improves first-pass yield, and feeds quality data straight into the OEE model.
Digital Twin Simulation
Model robot cell ROI virtually before you spend on hardware. Validates throughput, takt time, and integration risk so the business case holds up.
Robotics AI Integration
Native connectors for cobots, AMRs, and 6-axis arms. Real-time robot utilization data feeds the same dashboard your CFO reviews.
Automated ROI Reporting
Actual vs forecasted ROI tracked monthly. Generate the board-ready report in one click—payback, NPV, IRR, and sensitivity included.
Ready to see iFactory AI calculate live ROI on your production line? Book a Demo with our manufacturing automation team.
Expert Review: What Separates 12-Month Paybacks From 36-Month Misses
The fastest-payback robot projects share three traits we see consistently: they start with a measured OEE baseline before procurement, they model all four ROI drivers—not just labor—and they integrate the robot into MES and CMMS from day one so improvement is auditable. Plants that skip baseline measurement typically report 24–36 month paybacks. Plants that follow the discipline routinely land at 12–18 months on cobot deployments and 14–22 months on 6-axis cells. The technology is mature; the business-case rigor is what varies.
Conclusion: The 12–18 Month Payback Is Real—If You Earn It
Manufacturing robot ROI in 2026 is no longer a leap of faith. Cobots tending CNC machines, AI vision systems inspecting parts, and AMRs moving material reliably deliver 12–18 month paybacks across U.S. plants when the four ROI drivers are modeled honestly and the deployment is integrated with MES, CMMS, and OEE analytics from day one. The risk is not the technology—the risk is building a business case on labor savings alone, skipping baseline measurement, and running one shift when you could run three. Plants that follow the discipline outlined above consistently land below the 18-month payback threshold, with many cobot deployments hitting 8–14 months. The robots are ready. The math works. The remaining question is execution.
Frequently Asked Questions
Calculate Your Robot ROI With Real Plant Data
iFactory AI gives you the OEE baseline, predictive maintenance gains, and integration framework that turn an automation pitch into a board-approved 12–18 month payback.