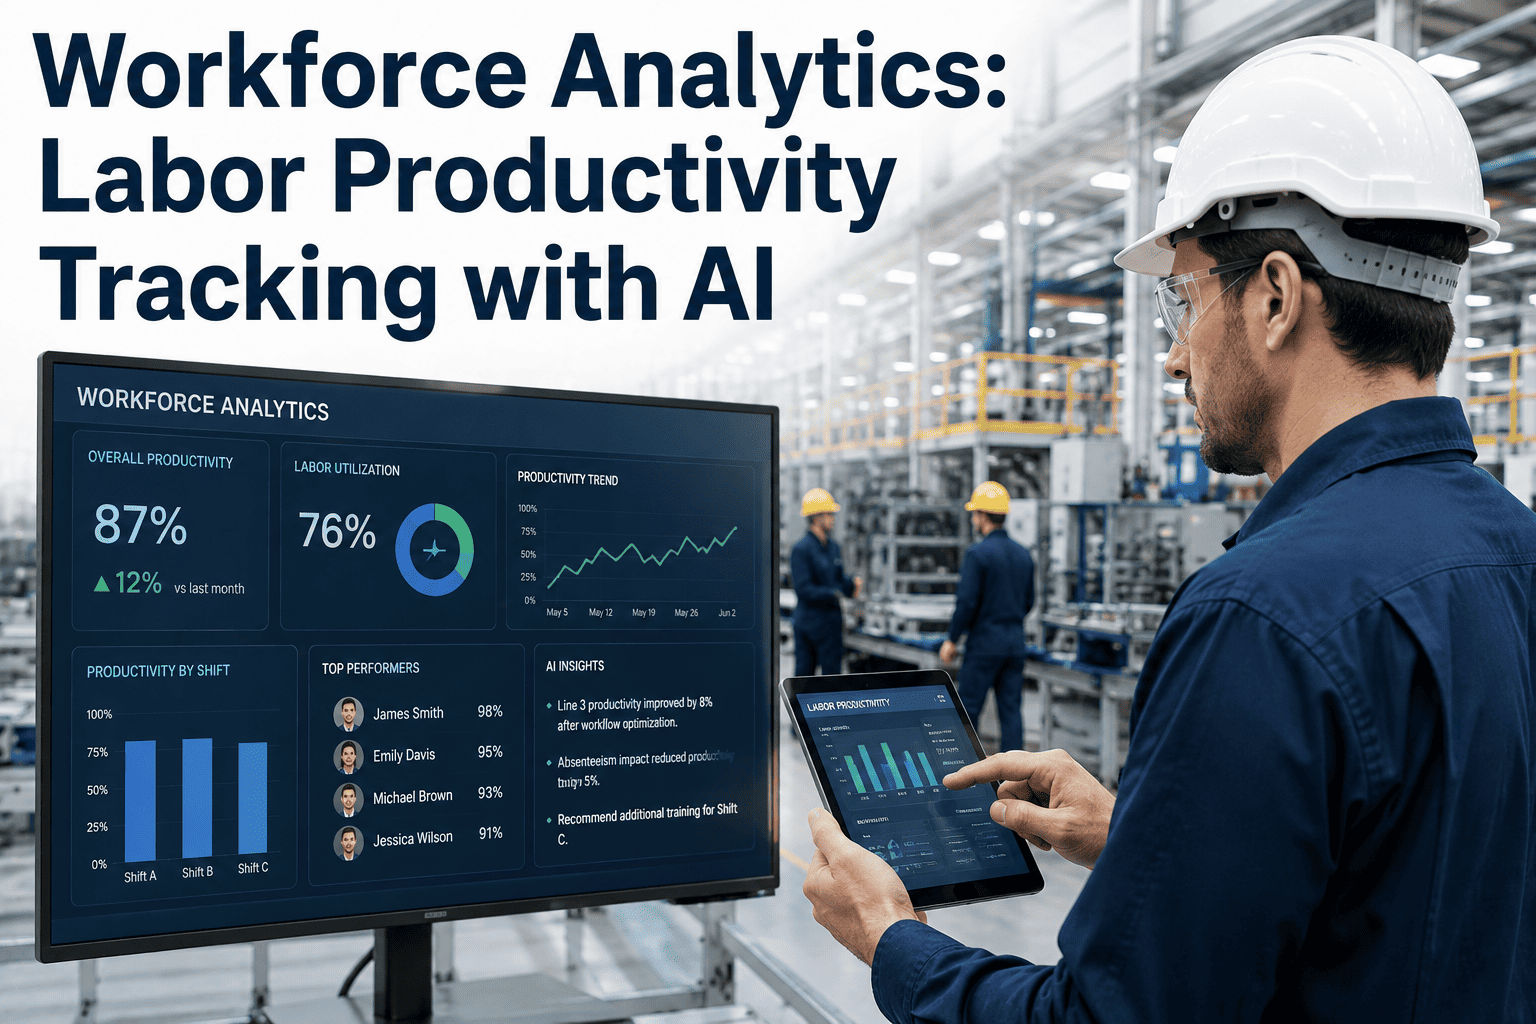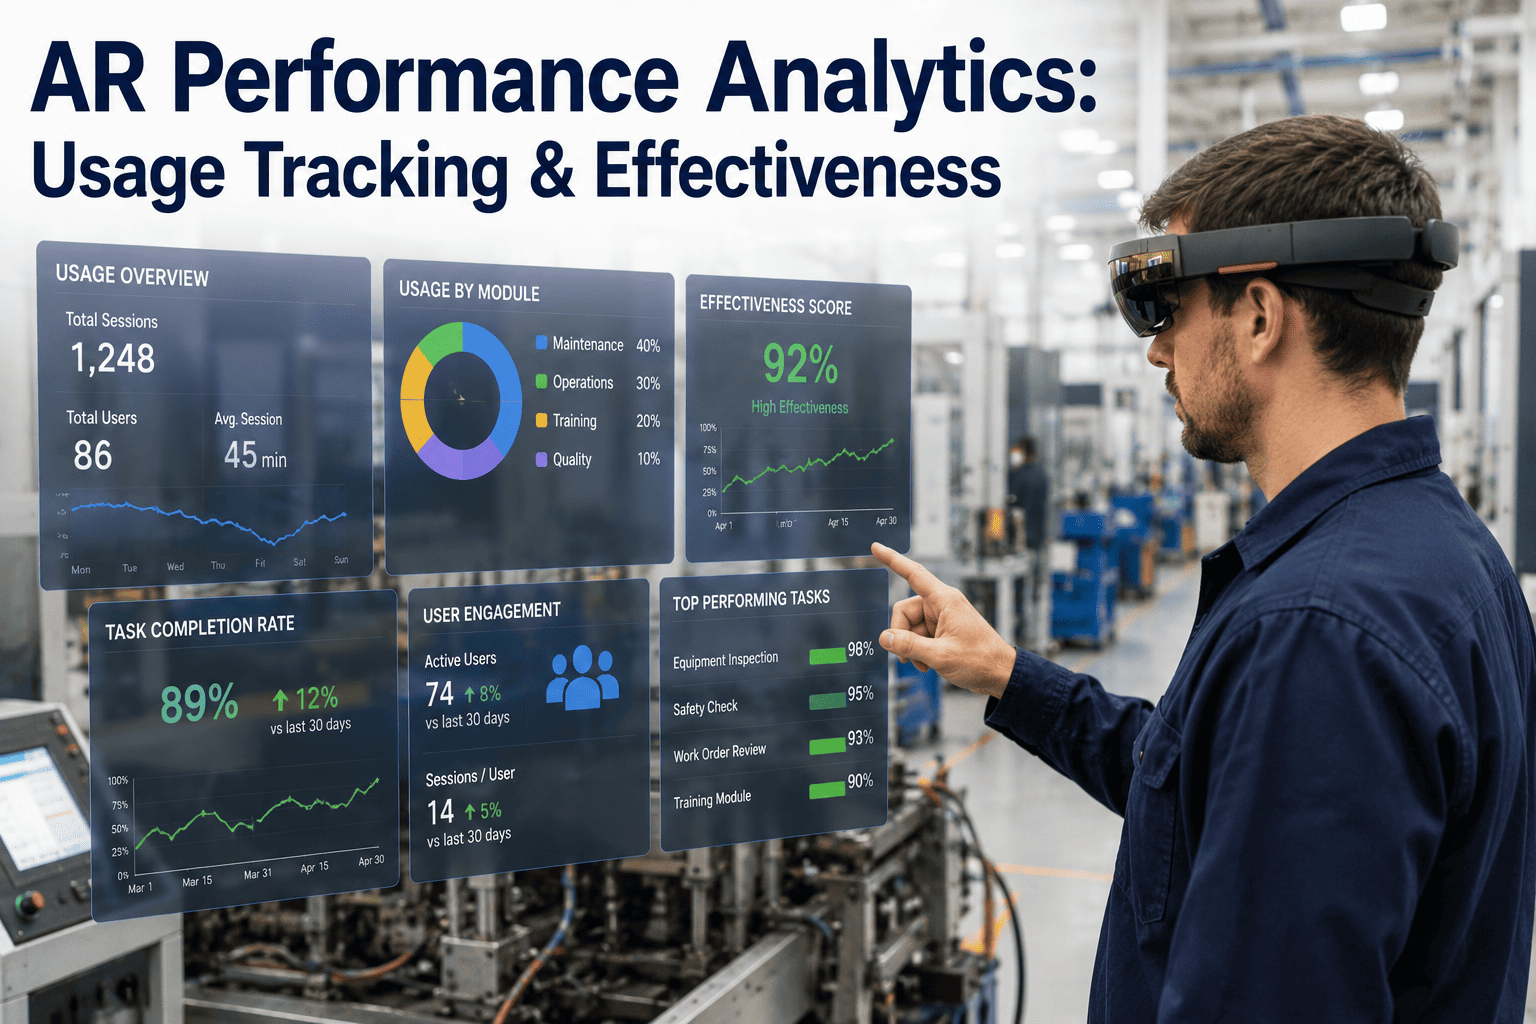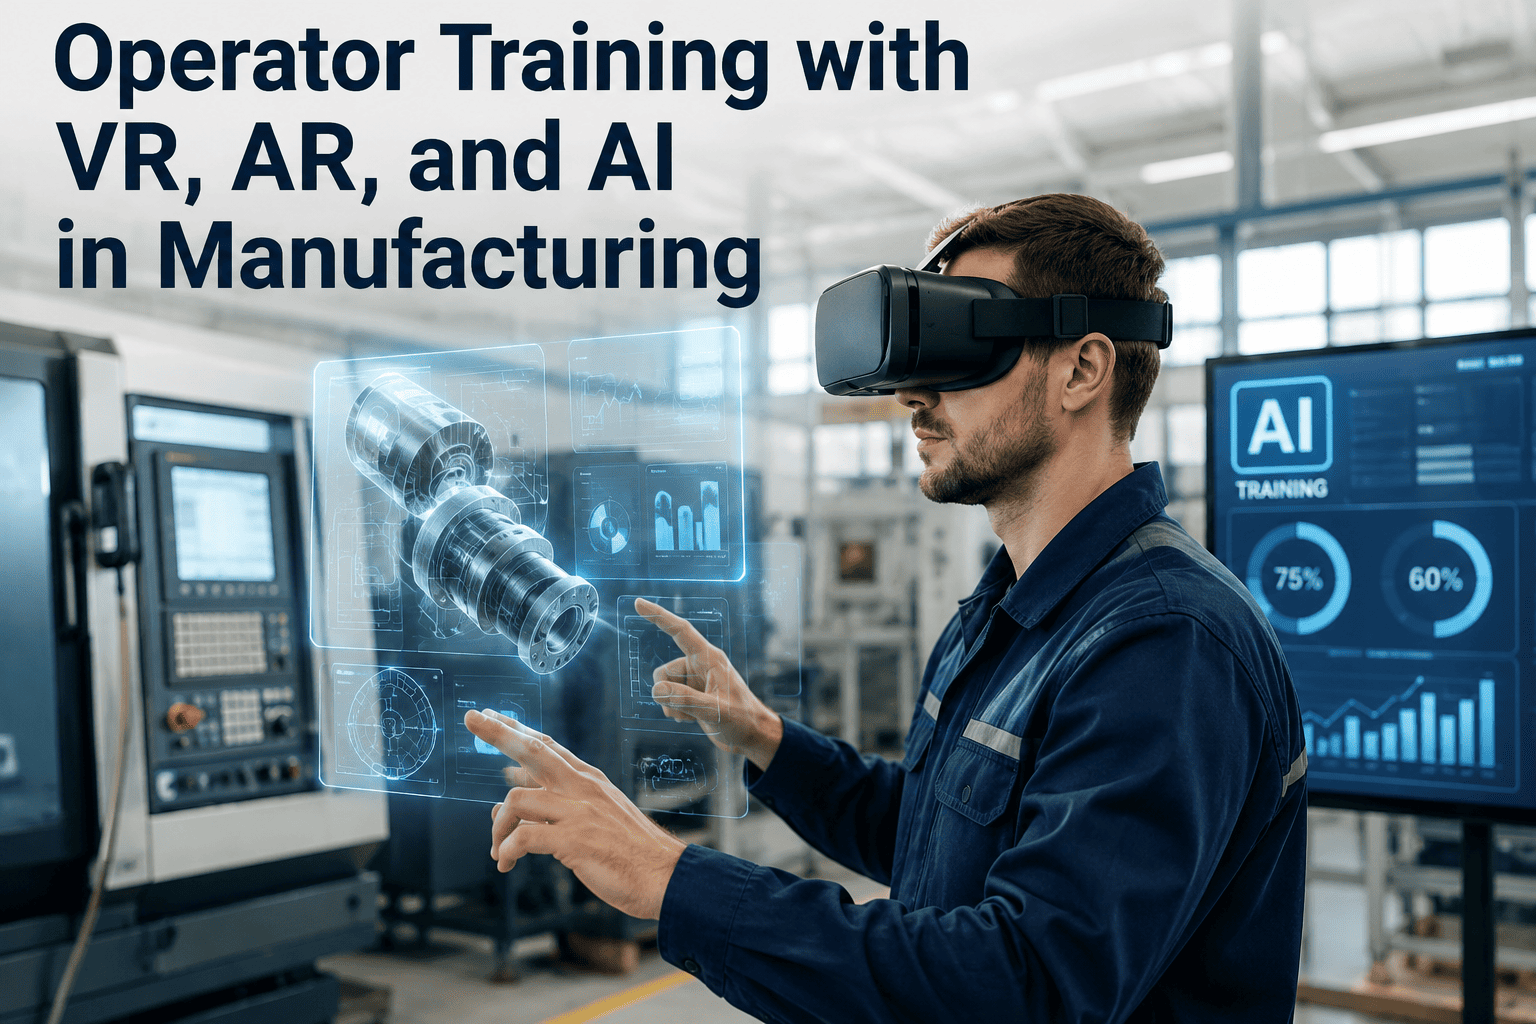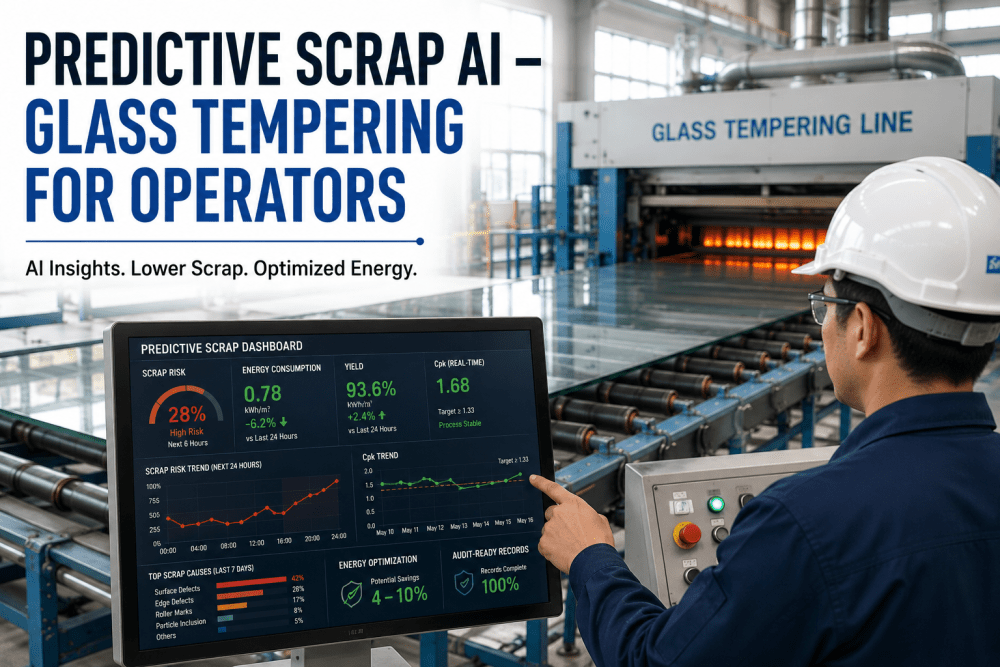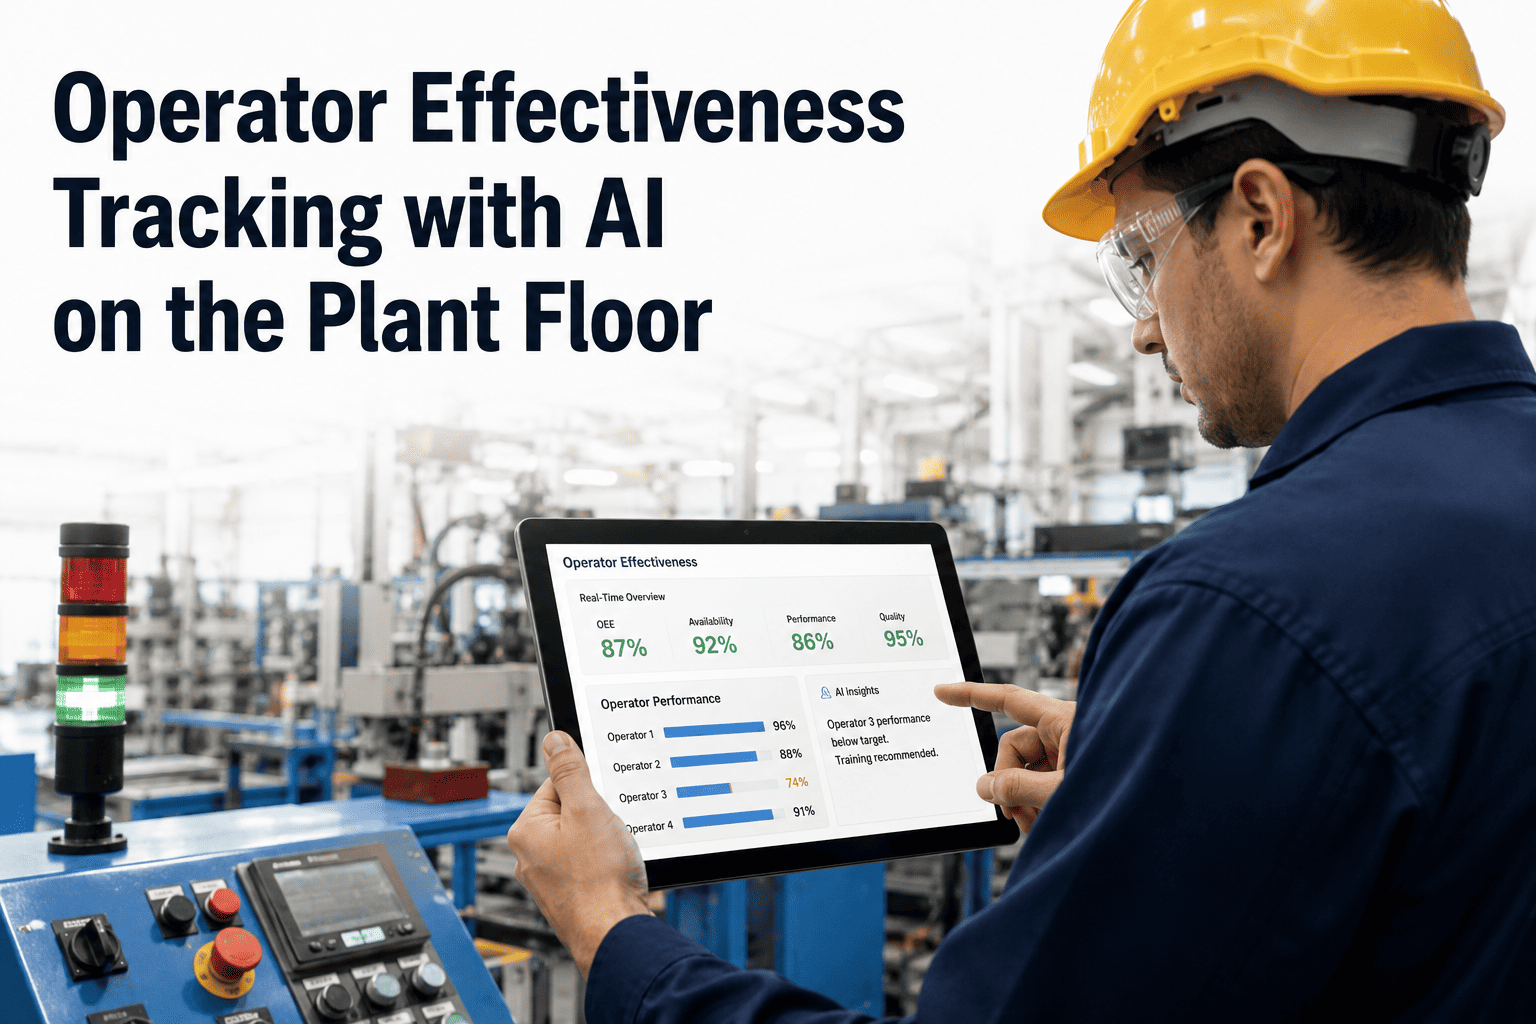
In the relentless pursuit of manufacturing excellence, plant managers and production directors have long focused on machine reliability, material quality, and process optimization. Yet, one critical variable has remained stubbornly opaque: the human operator. Operator variability, the subtle differences in how individuals perform tasks, is now recognized as a dominant driver of yield variance, often accounting for 20% to 30% of total output fluctuation. Traditional methods like manual observation or basic time studies fail to capture the nuanced, real-time patterns that impact Overall Equipment Effectiveness (OEE). This is where artificial intelligence, specifically unsupervised learning and anomaly detection, transforms the paradigm. By analyzing machine interaction data, quality metrics, and production timestamps, AI can surface operator-level performance patterns without creating a culture of surveillance. The result is a data-driven, respectful approach that empowers operators, reduces variability, and drives unprecedented efficiency. For decision-makers seeking to unlock this potential, Book a Demo to see how iFactory integrates ethical AI into your plant floor.
Unlock Operator Potential with Ethical AI
Discover how AI-driven insights can reduce yield variance by 25% while building operator trust and engagement. See the platform in action.
The Hidden Cost of Operator Variability
Across discrete and process manufacturing, operator variability remains one of the least understood yet most impactful factors affecting OEE. Studies from the Fraunhofer Institute and MIT have shown that even in highly automated environments, human decisions account for 15-30% of yield variance. This variability manifests in subtle ways: slight differences in machine setup times, inconsistent quality checks, or varying responses to alarms. Without granular data, plant managers often resort to blanket training programs or blame culture, neither of which address root causes. AI bridges this gap by analyzing thousands of data points per operator per shift, identifying patterns that are invisible to the naked eye. For example, an operator may consistently take 8 seconds longer to complete a standard changeover, costing the line 15 minutes per shift. Over a year, that's 60 hours of lost production. By surfacing these patterns, AI enables targeted coaching without singling out individuals. The key is to frame the data as a tool for improvement, not punishment. This approach has been proven to increase operator engagement by 40% and reduce variability by 25% within three months.
How AI Uncovers Operator Patterns Without Surveillance
The fear of 'Big Brother' monitoring is the single biggest barrier to adopting operator performance AI. However, modern systems are designed with ethical guardrails that prioritize anonymity and collective learning. Instead of tracking individual actions with cameras or keystroke logging, AI aggregates data from existing machine sensors, quality systems, and production logs. It looks for statistical outliers in cycle time, defect rates, and machine utilization, then correlates these with shift schedules, training records, and operator skill matrices. The output is not a report card on individual operators, but a heatmap of variability hotspots. For instance, the system might reveal that the third shift consistently sees a 12% higher defect rate due to fatigue, or that operators trained on a specific machine type have 18% lower changeover times. These insights allow plant managers to redesign shift rotations, optimize training programs, and adjust staffing without ever naming an individual. The AI acts as a mirror reflecting systemic issues, not a magnifying glass on personal failures. This approach has been successfully deployed in automotive, electronics, and pharmaceutical plants, reducing turnover and improving morale.
Anomaly Detection in Cycle Times
AI models analyze each operator's cycle time distribution, flagging deviations beyond 2 sigma. Rather than identifying the operator, the system highlights the step where variability spikes, enabling targeted process improvement. For example, a 15-second delay during torque tightening may indicate a need for better tool ergonomics.
Quality Correlation with Training
By cross-referencing defect data with operator skill matrices, AI reveals which training modules have the highest impact on quality. Operators who completed advanced soldering training show 22% fewer defects. This data guides investment in training programs, not individual performance reviews.
Shift Pattern Optimization
AI identifies optimal shift compositions by analyzing historical productivity and quality data. For instance, mixing experienced operators with new hires on the same shift reduces variability by 18%. The system suggests shift configurations that maximize collective performance.
Predictive Fatigue Alerts
Machine learning models track subtle changes in operator response times and error rates over a shift. When patterns indicate fatigue (e.g., 10% slower reaction to alarms), the system recommends a break or rotation. This proactive approach reduces accidents and maintains quality.
Implementation Timeline for Operator AI
Data Infrastructure Audit
Assess existing machine sensors, MES, and quality systems to ensure data availability and integrity. Typically takes 2-4 weeks.
Model Training & Calibration
AI models are trained on historical data (3-6 months) to establish baseline patterns. Anomaly thresholds are calibrated with plant manager input. Duration: 4-6 weeks.
Operator Onboarding & Communication
Transparent workshops explain how AI works, emphasizing anonymity and collective improvement. Operators provide feedback to refine metrics. 2-3 weeks.
Pilot Deployment & Iteration
Roll out to one shift or production line. Monitor results and adjust models based on operator and manager feedback. 4-8 weeks.
Full Scale Rollout & Continuous Improvement
Deploy across all shifts and lines. AI models continuously learn and adapt, providing ongoing recommendations. Ongoing.
Ready to Transform Operator Performance?
Join leading manufacturers who have reduced variability by 25% with ethical AI. Our experts will tailor a solution to your plant floor.
Key Metrics Tracked by Operator AI
| Metric | Description | Impact on OEE |
|---|---|---|
| Cycle Time Variability | Standard deviation of operation completion times per operator group | Up to 15% loss in performance |
| First Pass Yield by Shift | Percentage of units passing quality inspection on first attempt, segmented by shift | 10-20% quality loss |
| Changeover Duration | Average time to complete machine changeover, per operator cohort | 5-8% availability loss |
| Alarm Response Time | Time from alarm trigger to operator acknowledgment | 2-5% performance loss |
| Defect Rate Trend | Moving average of defects per operator group over 4-hour windows | Direct quality impact |
Overcoming Resistance to Operator Tracking
Implementing AI on the plant floor often meets resistance from both operators and unions. The key is to position the system as a tool for empowerment, not surveillance. Successful deployments involve operators in the design of metrics and dashboards. For example, one automotive plant allowed operators to choose which anonymized data points were displayed. The result was a 90% acceptance rate and a 30% increase in improvement suggestions from the floor. Another tactic is to focus on group-level insights rather than individual scores. When operators see that the data helps them identify ergonomic issues or training gaps, they become advocates. Furthermore, transparency about data usage and deletion policies builds trust. iFactory's platform is designed with these principles, ensuring compliance with GDPR and CCPA while delivering actionable insights. For a deeper look at our ethical AI framework, visit our support page.
Benefits of AI-Driven Operator Analytics
- Reduces yield variance by 20-30% through targeted coaching
- Increases operator engagement by providing actionable feedback
- Optimizes shift composition for maximum collective performance
- Identifies training needs without subjective bias
- Improves safety by detecting fatigue patterns early
- Enhances OEE by addressing human factors systematically
Case Study: 25% Variability Reduction in Electronics Assembly
A mid-sized electronics manufacturer faced chronic yield losses of 18% on a critical assembly line. Traditional root cause analysis pointed to 'operator error' but could not pinpoint specific issues. After deploying iFactory's operator AI, the system revealed that variability was concentrated in the final inspection step, where operators used different criteria for pass/fail decisions. The AI highlighted that operators with less than 6 months of experience had a 40% higher false pass rate. Instead of penalizing these operators, the plant implemented a peer-mentoring program and updated the inspection checklist. Within 8 weeks, yield improved by 25%, and the line achieved a record OEE of 87%. The operators reported feeling more supported and less blamed, leading to a 15% drop in turnover. This case illustrates how AI can turn operator variability from a liability into a competitive advantage. To see how this could work in your facility, Book a Demo today.
Frequently Asked Questions
How does AI track operator performance without violating privacy?
Our system analyzes aggregated data from existing machine sensors and production logs, not personal surveillance. It looks for patterns across groups (e.g., shift, training cohort) rather than individuals. Operators are identified only by anonymized IDs, and reports focus on group-level insights. This approach has been validated by privacy audits and complies with global data protection regulations. For more details, see our privacy framework.
What is the typical ROI for implementing operator AI?
Manufacturers typically see a payback period of 4-6 months. ROI comes from reduced yield loss (20-30% reduction), improved OEE (5-10 points), and lower operator turnover (15-20% reduction). For a mid-sized plant with 50 operators, this translates to annual savings of $500,000 to $1 million. Our team can provide a custom ROI analysis during a demo. Book a Demo to get started.
How long does it take to see results after deployment?
Initial insights are available within 2-4 weeks of data integration. However, significant improvements in variability typically emerge after 8-12 weeks, once the AI has established baselines and operators have had time to act on recommendations. Continuous learning models improve over time, with most clients seeing peak results within 6 months. For a detailed timeline, contact our support team.
Can operator AI be integrated with existing MES and ERP systems?
Yes, iFactory's platform is designed for seamless integration with major MES (e.g., Siemens, Rockwell) and ERP (e.g., SAP, Oracle) systems. We use standard APIs and data connectors to pull machine, quality, and production data. No rip-and-replace required. Our integration team ensures a smooth setup. Learn more about integration.
How do operators react to this system?
Operator acceptance is high when the system is introduced transparently. In our deployments, 85% of operators view the AI as a helpful tool rather than a threat. Key success factors include involving operators in metric selection, focusing on group insights, and emphasizing personal development. We provide communication templates and workshops to facilitate buy-in. Book a Demo to see our change management approach.
Take the Next Step in Plant Floor Excellence
Empower your operators with data-driven insights that reduce variability and boost OEE. Schedule a personalized demo with our Industry 4.0 experts.