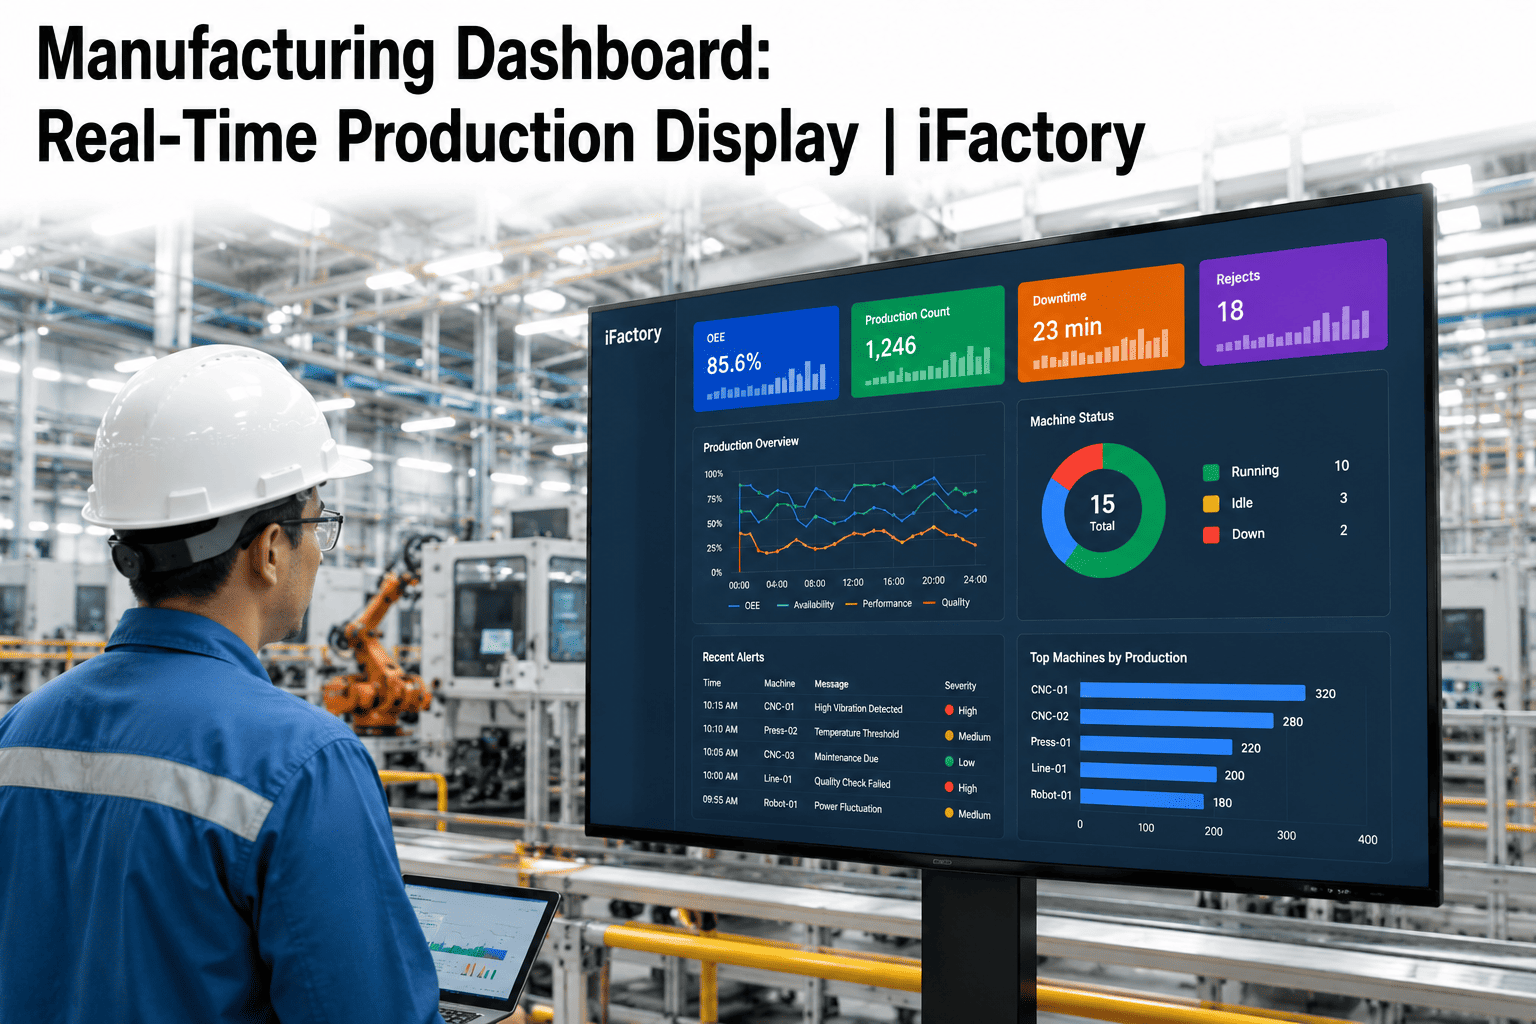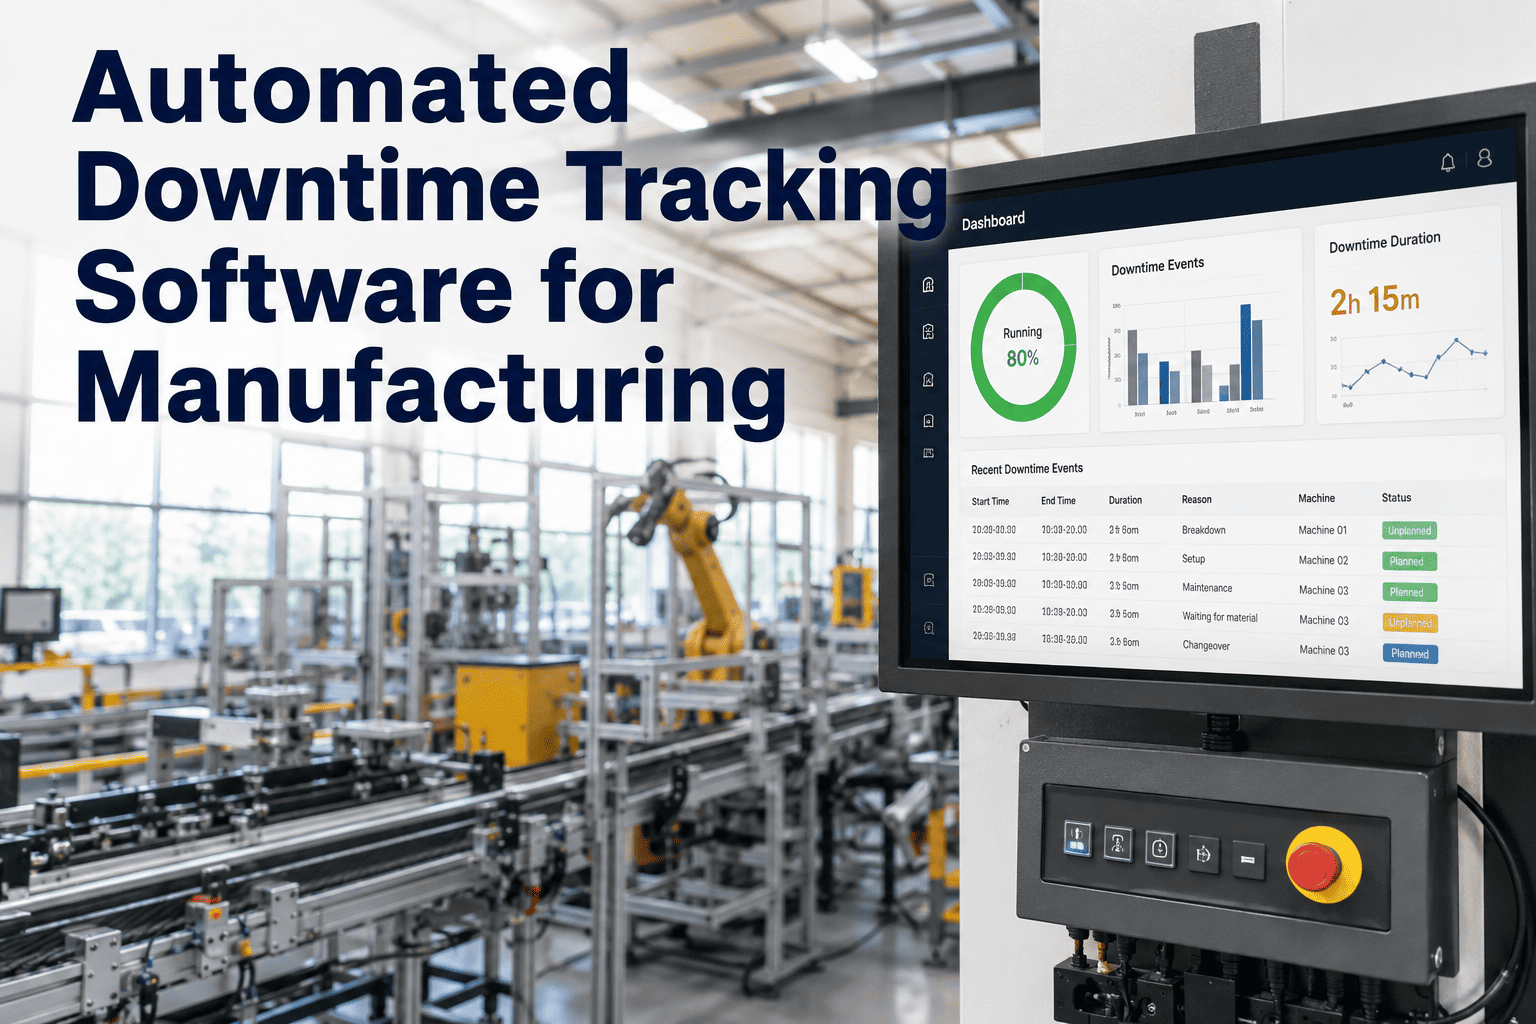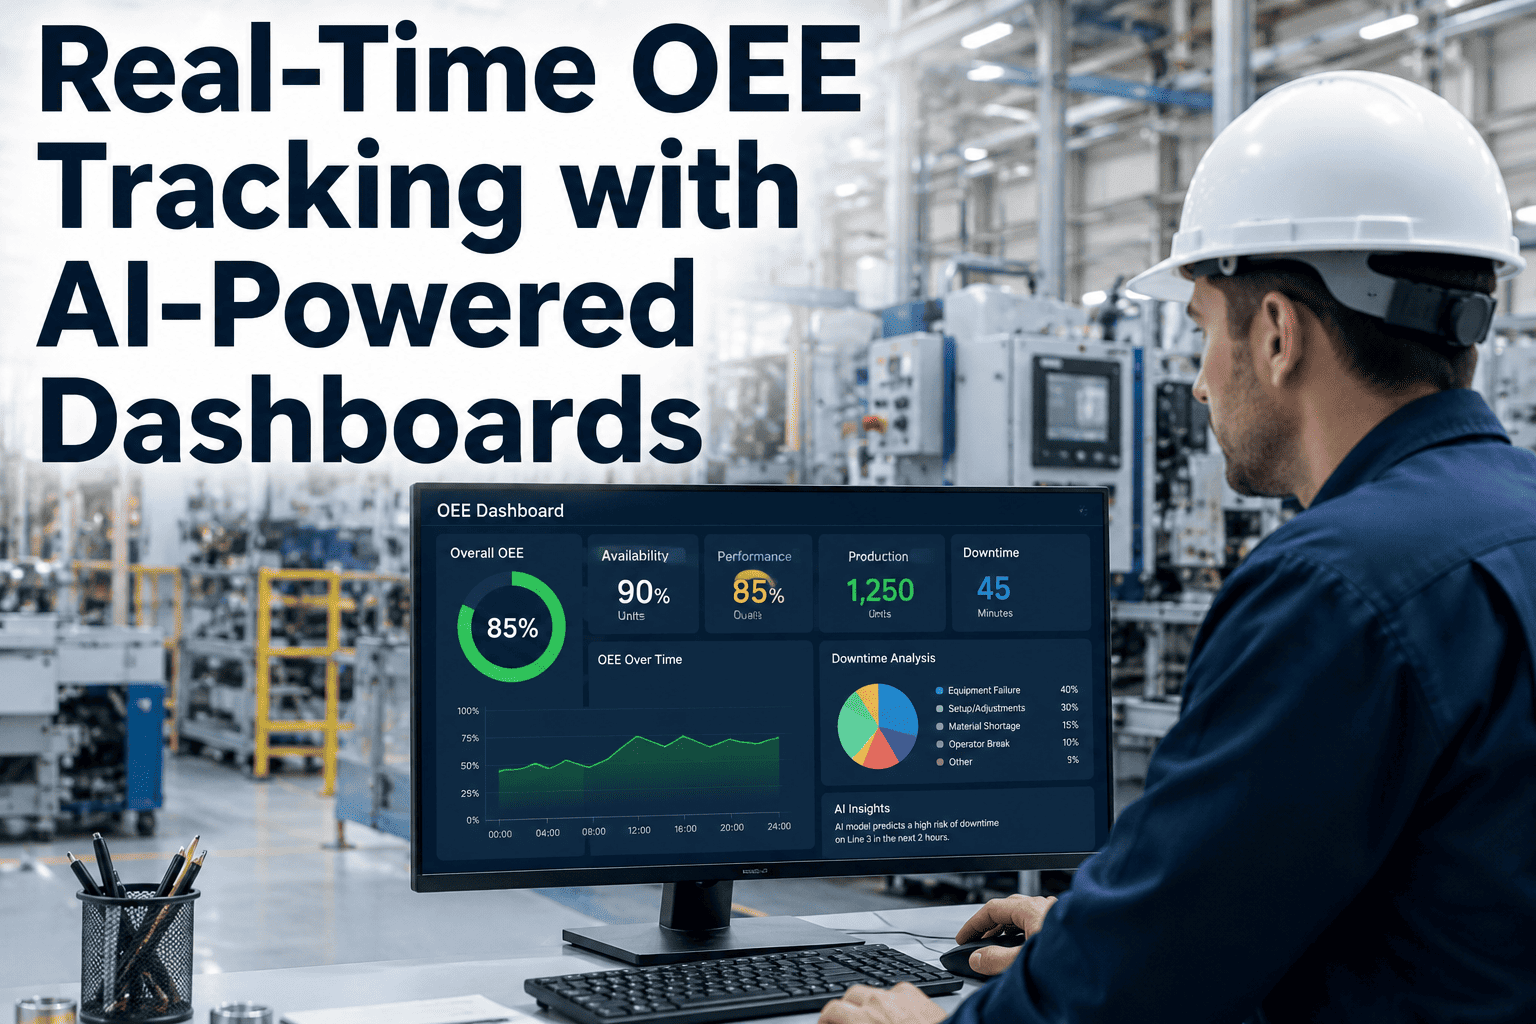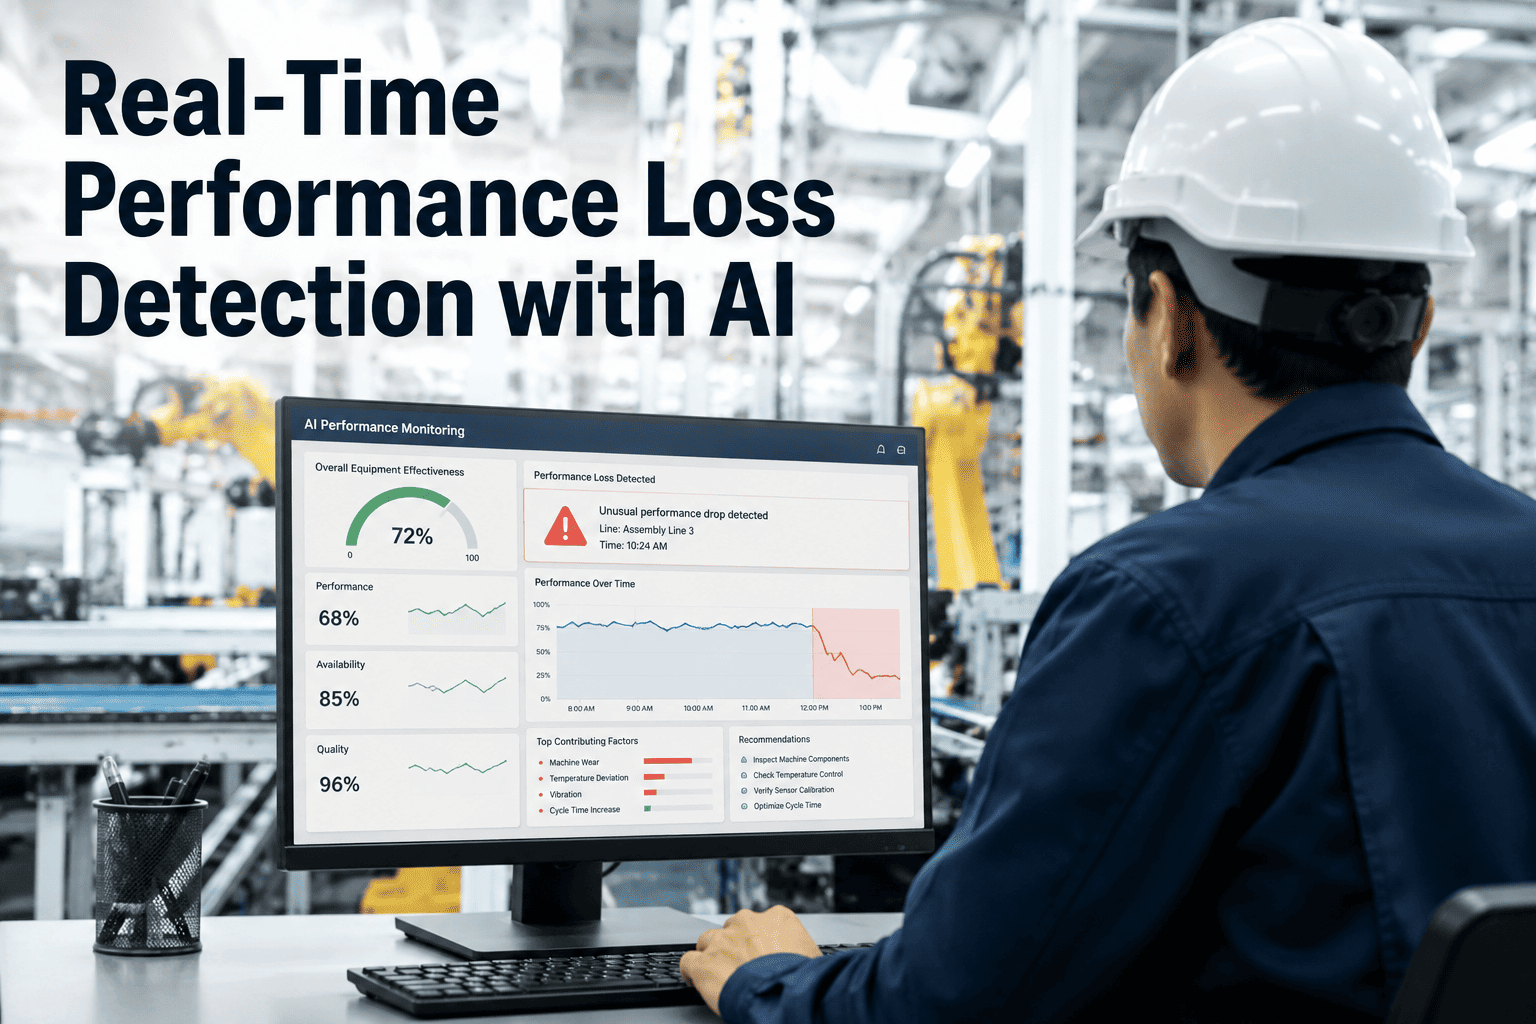
In the high-stakes environment of modern manufacturing, performance losses remain one of the most elusive and costly adversaries. Traditional OEE reporting often reveals these inefficiencies only after the fact, typically on Monday mornings when the damage is already done. By then, production volumes have slipped, and root causes are buried in shift logs. iFactory’s AI-driven platform transforms this paradigm by detecting speed losses, minor stops, and micro-stops in real time, empowering operators and plant managers to intervene immediately. This shift from retrospective analysis to proactive intervention is not merely incremental—it represents a fundamental re-engineering of how factories sustain peak performance. Book a Demo to see how real-time detection can protect your throughput.
Stop Performance Leaks Before They Compound
AI detects speed loss and minor stops in seconds, not days. Operators act in the moment, protecting OEE.
The Hidden Cost of Performance Loss
Performance loss, often categorized as speed loss or minor stops, is the most underreported component of OEE. While availability and quality are tracked with relative rigor, performance metrics suffer from a fundamental data gap: they require second-by-second observation of machine cycles. In a typical factory, a machine might experience dozens of micro-stops per shift, each lasting 30 seconds to 2 minutes. Individually, these events seem insignificant. Collectively, they can erode effective capacity by 15-20%. Without AI, these events are aggregated into a generic 'idle' code or lost entirely in manual logs. The result is a distorted view of true production capability and missed opportunities for targeted improvement.
Consider a high-speed packaging line: a sensor glitch causes the machine to pause for 45 seconds every 20 cycles. Over an 8-hour shift, this adds up to over 2 hours of lost runtime. The operator may not even notice because the line restarts automatically. The OEE report on Monday shows a 12% performance loss, but without granular data, the root cause remains a mystery. iFactory’s AI continuously analyzes cycle times, comparing actual performance against ideal rates. The moment a deviation crosses a threshold, an alert is triggered. This is not just data—it is actionable intelligence that closes the loop between detection and correction.
Three Pillars of Real-Time Performance Detection
Speed Loss Detection
AI compares actual cycle time against ideal cycle time continuously. Any slowdown beyond a configurable threshold triggers an immediate alert. Operators see the exact machine and cycle where speed dropped, enabling rapid diagnosis of mechanical wear, material inconsistencies, or operator technique issues.
Minor Stop & Micro-Stop Tracking
Events lasting 10 seconds to 2 minutes are automatically classified and aggregated. The AI distinguishes between planned pauses (e.g., material loading) and unplanned stops. Trend analysis reveals recurring patterns, such as a specific sensor failing every 3 hours, enabling predictive maintenance before the stop becomes a major breakdown.
Operator Empowerment
Real-time dashboards on the shop floor display current performance metrics. Operators receive push notifications on handheld devices or HMI screens. They can acknowledge the alert, log a root cause, or escalate. This closes the feedback loop in minutes, not days, and builds a culture of continuous improvement.
From Data to Action: The Real-Time Workflow
Continuous Cycle Monitoring
Edge sensors and PLC data streams feed into the AI engine every 100ms. The system learns the normal cycle signature for each machine, accounting for product changeovers and planned maintenance windows.
Anomaly Detection
When a cycle deviates from the learned pattern by more than a configurable threshold (e.g., 10% slower), an anomaly is flagged. The AI classifies the type of loss: speed loss, micro-stop, or minor stop.
Instant Alert & Visualization
The alert appears on the operator’s dashboard and mobile device. A detailed view shows the affected machine, the duration of the deviation, and a link to the historical context. Operators can see if this is a recurring issue.
Root Cause Logging & Escalation
Operators select from a predefined list of root causes or enter a custom note. If the loss exceeds a severity threshold, the system automatically notifies the shift supervisor or maintenance team via email or SMS.
Trend Analysis & Continuous Improvement
All events are stored in a searchable database. AI identifies patterns across shifts, weeks, and product runs. Reports highlight the top 5 machines by performance loss, enabling targeted Kaizen events.
Technical Architecture: How AI Detects Performance Loss
The iFactory platform uses a hybrid approach combining edge computing and cloud analytics. At the edge, a lightweight inference engine runs on a Raspberry Pi or industrial gateway, processing raw PLC data in real time. This ensures sub-second latency even in environments with intermittent network connectivity. The edge model is trained on historical cycle data using unsupervised learning to establish a baseline of 'normal' operation. Once deployed, the model continuously updates its baseline to adapt to gradual changes such as machine wear or seasonal variations.
The cloud component aggregates edge data from multiple lines and plants. It performs deeper analysis, including cross-machine pattern recognition and long-term trend forecasting. For example, if Machine A on Line 3 consistently shows a 5% speed loss during the third shift, the cloud AI correlates this with operator schedules, material batch numbers, and ambient temperature data. This holistic view enables root cause analysis that would be impossible with siloed data. The system also generates automated OEE reports that include not only the final OEE percentage but also a breakdown of performance loss by category, machine, and time interval.
Performance Loss Categories: A Technical Breakdown
| Category | Duration | Typical Causes | Impact on OEE | AI Detection Method |
|---|---|---|---|---|
| Micro-Stop | 10-60 seconds | Sensor glitch, jam clearance, momentary power dip | 2-5% loss | Cycle time > 3x standard deviation |
| Minor Stop | 1-5 minutes | Material misalignment, quick adjustment, operator absence | 5-10% loss | Machine idle state > 60s but < 5min |
| Speed Loss | Continuous | Machine wear, suboptimal settings, material variation | 5-15% loss | Actual cycle time vs ideal ratio < 0.9 |
| Major Stop | > 5 minutes | Breakdown, planned maintenance, changeover | 15-50% loss | Machine idle > 5min (classified separately) |
Turn Hidden Losses Into Visible Gains
Stop waiting for Monday reports. iFactory gives you real-time visibility into every micro-stop and speed loss.
Empower your team to act while the line is still running.
Real-World Impact: Case Study from an Automotive Tier 1 Supplier
A leading automotive supplier with 12 assembly lines deployed iFactory’s real-time performance detection across their powertrain manufacturing facility. Prior to implementation, their OEE reports were generated weekly, with performance loss data aggregated at the line level. The plant manager estimated that minor stops accounted for 8% of total lost time, but had no way to verify or address them systematically. After deploying iFactory, the system detected an average of 47 micro-stops per shift per line—events that were previously invisible. The most common root cause was a recurring sensor misalignment on a robotic arm that caused a 20-second pause every 30 cycles.
Within the first month, the plant reduced total performance loss by 18% by addressing just the top three root causes. Operators received real-time alerts and were able to adjust the sensor alignment without waiting for a maintenance work order. The plant manager reported that the system paid for itself in less than 90 days through recovered capacity alone. This case underscores the profound impact of making performance loss visible at the moment it occurs, rather than as a historical artifact.
Key Benefits for Operations Managers
Immediate Visibility
See every performance loss as it happens. No more waiting for end-of-shift reports. Real-time dashboards and alerts put the data in your hands instantly.
Root Cause Identification
AI correlates performance losses with machine, shift, material, and operator data. Identify the true root cause of recurring issues and eliminate them at the source.
Improved OEE
By reducing speed loss and minor stops, you can improve OEE by 3-5% within the first quarter. This translates directly to increased throughput and reduced unit cost.
Operator Engagement
Empower operators with real-time feedback and actionable alerts. They become active participants in performance improvement, rather than passive data collectors.
Integration with Existing Systems
iFactory is designed to complement, not replace, your existing infrastructure. It connects to PLCs, SCADA systems, and MES platforms via standard protocols such as OPC UA, Modbus, and MQTT. The edge device can be installed in under 2 hours with no production downtime. Data is stored in a time-series database optimized for high-frequency manufacturing data, ensuring that even with thousands of data points per second, queries remain fast and responsive.
The platform also integrates with popular CMMS systems (such as SAP, Maximo, and Fiix) to automatically create work orders when a performance loss pattern indicates a need for maintenance. This closed-loop integration ensures that insights from AI are translated into actions without manual intervention. For enterprises with multiple plants, the cloud dashboard provides a unified view of performance across all sites, enabling benchmarking and best practice sharing.
Implementation Roadmap: From Pilot to Plant-Wide Rollout
- 1Pilot Phase (2 weeks): Deploy edge devices on 2-3 critical machines. Configure thresholds and train operators. Validate detection accuracy against manual logs.
- 2Expansion Phase (4 weeks): Roll out to remaining machines on the line. Integrate with existing dashboards and CMMS. Conduct training sessions for all operators and supervisors.
- 3Optimization Phase (Ongoing): Use AI-generated trend reports to identify top loss drivers. Implement Kaizen events focused on the most impactful root causes. Monitor OEE improvement and adjust thresholds as needed.
- 4Scale Phase (Quarterly): Replicate the successful model to other lines and plants. Establish a center of excellence for real-time performance management.
The Future of Performance Management: Predictive and Prescriptive
While real-time detection is a game-changer, the next frontier is predictive and prescriptive analytics. iFactory is already developing machine learning models that can predict a performance loss event 5-10 minutes before it occurs, based on subtle changes in vibration, temperature, and cycle time trends. This would allow operators to intervene even before the loss materializes, effectively preventing it. Prescriptive analytics will recommend the optimal corrective action—such as adjusting a parameter or scheduling a quick maintenance check—based on historical success patterns.
These advanced capabilities will be built on the same real-time data foundation, ensuring that as the technology evolves, your investment remains future-proof. Early adopters of real-time detection will have a significant competitive advantage, as they will have the data infrastructure and change management experience needed to leverage these advanced features. The journey from reactive to predictive performance management starts with making the invisible visible, and iFactory is the catalyst.
Frequently Asked Questions
How does AI distinguish between a minor stop and a planned pause?
The AI uses a combination of machine learning models and rule-based logic. It learns the normal cycle pattern for each machine, including planned pauses for material loading, changeovers, and quality checks. When a pause occurs, the system compares its duration and context to the learned baseline. If the pause is longer than the typical planned pause for that machine and product, it is flagged as a minor stop. Additionally, the system can be configured with explicit rules, such as ignoring pauses during a scheduled maintenance window. The classification is continuously refined based on operator feedback, ensuring accuracy improves over time. For more details on how to configure these parameters, visit our support page.
What is the minimum data requirement for the AI to start detecting performance losses?
The AI requires at least 48 hours of historical cycle time data to establish a baseline for each machine. This data should be collected under normal operating conditions, including typical product changeovers and planned maintenance. The system can begin detecting anomalies immediately after the baseline is established, but accuracy improves as more data is collected over time. For machines with high variability (e.g., due to frequent product changes), the AI uses adaptive learning to update the baseline dynamically. If you have limited historical data, the system can still operate using default thresholds that you can adjust manually. To discuss your specific data environment, we recommend booking a demo.
Can iFactory detect performance losses on older machines without PLCs?
Yes. For machines that lack digital interfaces, iFactory offers a retrofit kit that includes non-invasive sensors (vibration, current, and optical) that can be attached to the machine without modifying its electrical system. These sensors transmit data wirelessly to the edge device, which processes it using the same AI algorithms. This allows even legacy equipment to benefit from real-time performance detection. The retrofit kit is IP65 rated and designed for harsh factory environments. Installation typically takes less than one hour per machine. For more information on compatibility, please visit our support page.
How does the system handle false positives in performance loss detection?
False positives are minimized through a multi-layered approach. First, the AI uses a statistical model that only triggers alerts when a deviation exceeds a configurable confidence threshold (default 95%). Second, the system learns from operator feedback: if an operator dismisses an alert as a false positive, the AI adjusts its model to avoid similar detections in the future. Third, the platform includes a review dashboard where supervisors can analyze all alerts and mark them as valid or invalid. This feedback loop continuously improves accuracy. In practice, after an initial tuning period of about two weeks, false positive rates are typically below 2%. For advanced users, custom rules can be created to suppress alerts under specific conditions. Detailed guidance is available on our support page.
What is the typical ROI timeline for implementing real-time performance loss detection?
Based on deployments across automotive, electronics, and consumer goods industries, the typical ROI is achieved within 3 to 6 months. The primary drivers are increased throughput (3-5% OEE improvement), reduced waste from speed losses, and lower maintenance costs due to early detection of recurring issues. In one case study, a plant recovered 18% of performance loss within the first month, resulting in a payback period of less than 90 days. The exact ROI depends on the current level of performance visibility and the speed of operator adoption. iFactory provides a detailed ROI calculator during the onboarding process. To get a personalized estimate for your facility, book a demo today.
Ready to Eliminate Performance Blind Spots?
Join industry leaders who have transformed their OEE with real-time AI detection.
Your operators are waiting for the tools to act. The technology is ready.