A 4-second micro-stop feels insignificant. When it occurs 100 times per shift, it consumes 67 minutes of invisible production time that never appears in any manual downtime log. Micro-stops are the single largest category of hidden OEE loss in manufacturing, typically consuming 8 to 15% of total production capacity in plants without automated detection. The problem is not that operators ignore them. The problem is that a 4-second interruption resolves before anyone can log it, so the cumulative loss becomes invisible. iFactory's AI captures every micro-stop at cycle-level resolution, classifies each event by root cause, and quantifies the total hidden capacity loss in dollars per shift. Plants deploying iFactory's micro-stop detection recover an average of 12% OEE within 6 months without adding equipment. Book a free micro-stop assessment for your plant.
iFactory detects every micro-stop (2 seconds to 2 minutes) at cycle-level resolution using AI-powered sensor monitoring. Each event is classified by root cause, equipment, and product context. The platform quantifies cumulative hidden capacity loss in dollars and generates prioritised corrective actions. Average result: 12% OEE recovery in 6 months, $1.4M annual value from recovered capacity.
Why Manual Tracking Misses 90% of Micro-Stops
Manual downtime logging captures events that operators notice and remember at the end of a shift. Micro-stops last 2 to 120 seconds and occur 50 to 200 times per shift. By the time an operator reaches a clipboard or tablet, the line is running again. The event is forgotten. iFactory solves this by monitoring every machine cycle automatically and detecting any interruption regardless of duration.
How iFactory Detects, Classifies, and Eliminates Micro-Stops
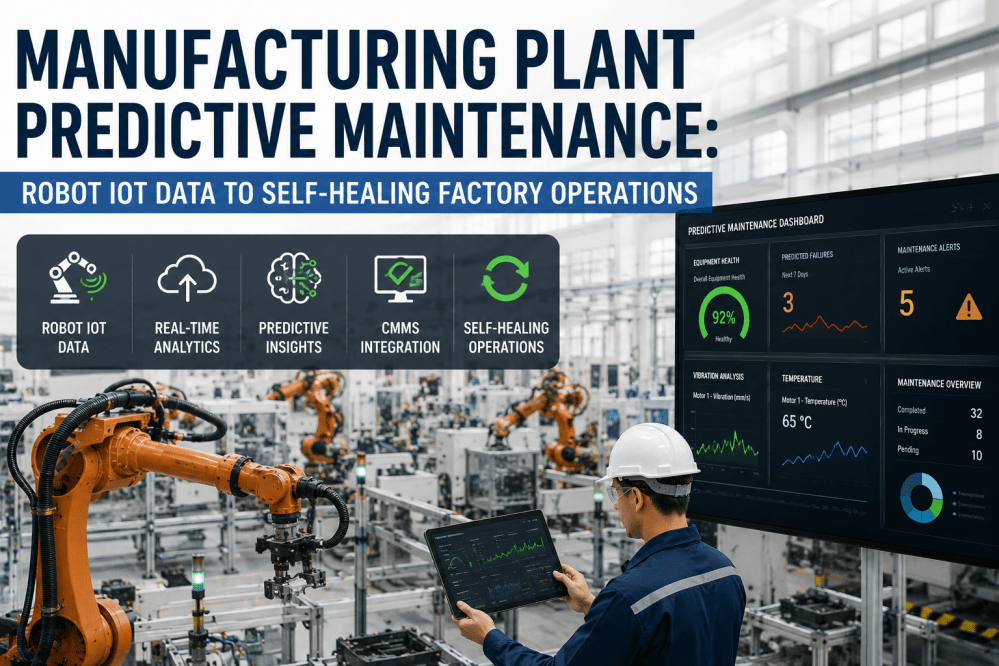
iFactory monitors every machine cycle through PLC signals, current sensors, and vibration data to detect any interruption at cycle-level resolution. The platform does not rely on operator input for detection. Once detected, AI classifies each event by type, correlates it with equipment, product, and environmental context, and generates prioritised corrective actions.
iFactory's pre-deployment assessment installs temporary sensors on your highest-volume lines and reveals the true micro-stop frequency, cumulative loss, and top root causes within 5 business days.
iFactory vs Competitor Platforms for Micro-Stop Detection
Most OEE platforms track downtime events that operators report or that exceed a minimum duration threshold (typically 2 to 5 minutes). Micro-stops by definition fall below that threshold. iFactory captures every interruption at cycle level regardless of duration. Book a demo to compare.
| Capability | iFactory | Evocon | Mingo Smart Factory | QAD Redzone | TRACTIAN | Plex Mfg Cloud |
|---|---|---|---|---|---|---|
| Sub-2-second micro-stop capture | Cycle-level AI detection | Threshold-based (configurable) | PLC signal dependent | Operator-reported only | Vibration-based | Min 5-minute threshold |
| AI root cause classification | Per event, per context | Manual operator tagging | Category-based | Manual entry | Asset-level only | Not available |
| Pattern clustering analysis | Machine + product + shift | Basic Pareto | Basic reporting | Not available | Not available | Basic reporting |
| Dollar-value quantification per stop | Real-time cost tracking | Not available | Not available | Not available | Not available | Not available |
| On-premise data processing | Zero cloud transmission | Cloud required | Cloud required | Cloud required | Cloud required | Cloud required |
| Automated corrective work orders | SAP / Maximo / native | Not available | API available | Task management | CMMS integration | Workflow required |
Based on publicly available product documentation as of Q1 2025. Verify capabilities directly with each vendor.
Regional Compliance and Data Security
| Region | Key Regulations | How iFactory Complies |
|---|---|---|
| United States | OSHA 29 CFR 1910, FDA 21 CFR Part 11, NIST Cybersecurity Framework, SOC 2 | On-premise NVIDIA edge. Audit-ready production logs. FDA-compliant electronic records. Zero external data transmission. |
| UAE | ADNOC HSE, UAE IA Standards, ICV Requirements, CICPA | Zero cloud transmission. ICV-eligible deployment. Arabic-language dashboards. Local support in Abu Dhabi and Dubai. |
| United Kingdom | UK GDPR, HSE PUWER, BRC Global Standards, Cyber Essentials Plus | All data on-site. BRC audit-ready records. PUWER documentation generated automatically. |
| Canada | PIPEDA, CSA Z432, Provincial OHS Acts, CFIA | On-premise data residency. Bilingual support. CFIA-compliant quality records. |
| Europe (EU) | EU GDPR, NIS2 Directive, EU Machinery Regulation 2023/1230, ISO 9001 | No external data transmission. NIS2-compliant. ISO 9001 documentation supported natively. |
Results from Plants Running iFactory Micro-Stop Detection
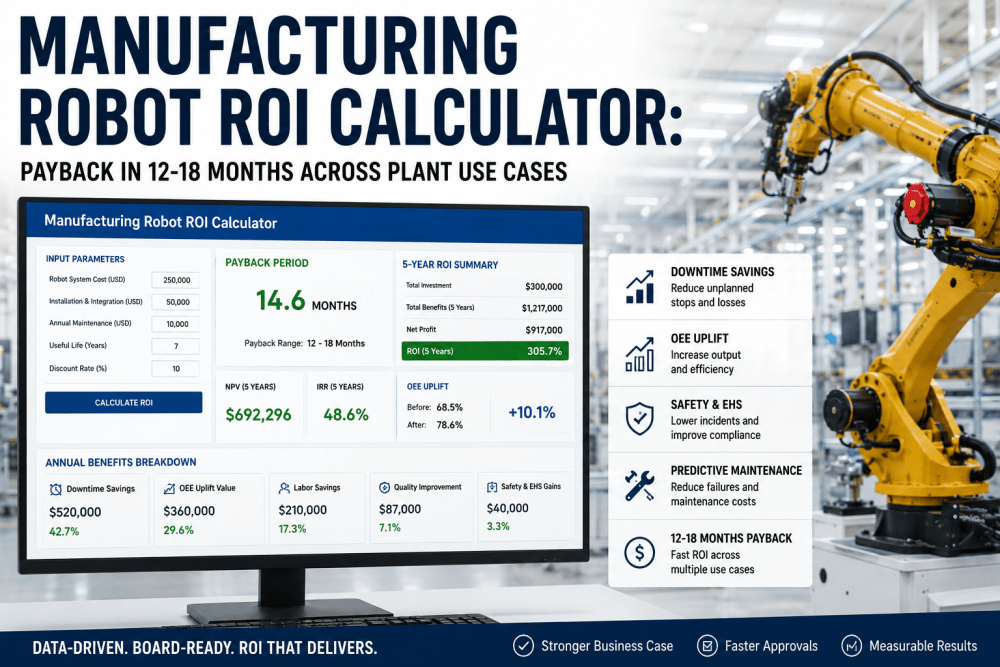
iFactory reveals the 12% of production capacity lost to micro-stops, quantifies it in dollars, and generates prioritised corrective actions that recover throughput without capital expenditure.
Frequently Asked Questions
Continue Reading
iFactory captures every micro-stop at cycle-level resolution, classifies by root cause, quantifies in dollars, and generates automated corrective actions. On-premise. Secure. No operator input needed.