Getting predictive maintenance working at one plant is the easy part. Wireless sensors go on three or four critical assets, the model learns their behavior, a save happens within a few months, and everyone in the room agrees the pilot worked. Then leadership asks for the same result at the other nine plants, and that's where most programs quietly stall. The technology isn't what breaks at scale — it's the assumption that copying one site's setup onto the next nine will work the same way. See how a repeatable rollout framework avoids that stall when you book a demo with our team.
Your Pilot Plant Proved Predictive Maintenance Works. Plant Two Through Twenty Is Where Most Programs Die.
A single-site pilot is a contained problem: one machine, one data stream, one champion who knows the equipment. Scaling across a network means standardizing that success without reinventing it at every site. Here's the framework that actually holds up past site three.
The Gap Isn't Technology — It's Standardization
A pilot succeeds because one engineer knows one asset intimately. Scaling to a network means connecting maintenance records, operating histories, and failure modes across different machine types, different plants, and different teams who've never worked together before.
- One champion drives every decision
- 3-5 critical assets, easy to monitor closely
- Success is visible and easy to attribute
- Dozens of teams need consistent playbooks
- Thousands of assets across varied machine types
- Shared dashboards replace tribal knowledge
Don't Scope This as a Two-Year Transformation
Programs framed as multi-year enterprise projects lose momentum before results ever land. A repeatable, short-cycle rollout framework holds attention and budget together.
Five Stages That Take a Program From One Site to a Network
The sequence below is deliberately short-cycle rather than a sprawling multi-year rollout, because programs scoped as long transformations tend to lose organizational momentum long before results appear.
Prove It at One Site
Instrument 3-5 critical bottleneck assets and demonstrate a clear, measurable reduction in downtime before touching a second plant.
Extract the Blueprint, Not the Copy-Paste
Document what made the pilot work — the process, not just the specific sensors or assets — so it adapts to a different plant's equipment mix.
Run Short Sprints, Not Long Programs
Six-week rollout cycles per site keep teams engaged and let each new site's learnings improve the next one immediately.
Centralize the Dashboard
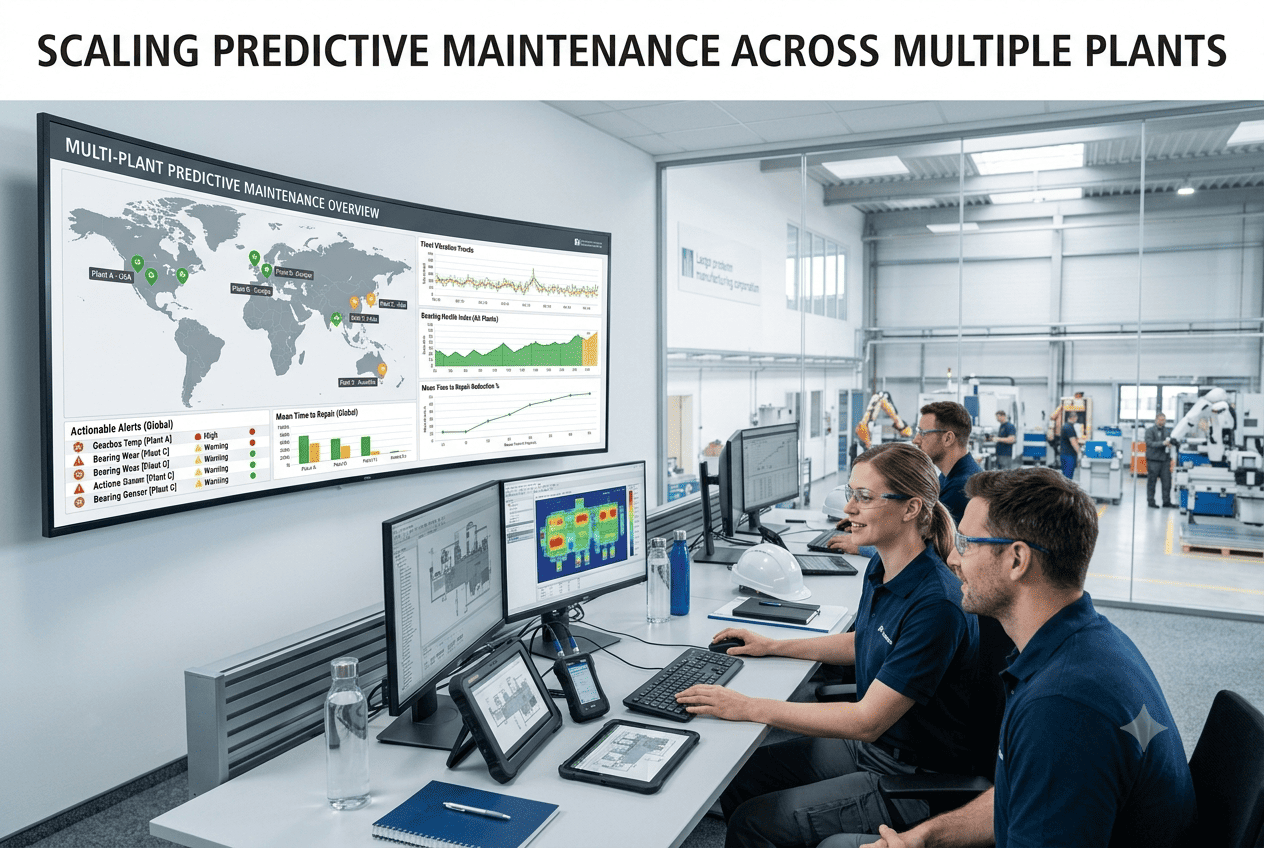
A shared view of PdM performance across every facility keeps stakeholders aligned and turns strategic decisions into data-driven ones.
Build a Center of Excellence
A small central team supports every site's rollout so no plant manager has to solve the same integration problem alone.
Four Failure Points Plant Managers Hit Repeatedly
Trying to Solve Integration All at Once
Connecting every machine type and legacy system across every plant simultaneously is where most rollouts stall, well before the algorithms are even ready.
Copying Site One's Asset List Exactly
Each plant's bottleneck assets differ. Forcing the same equipment list onto a plant with a different constraint wastes the early win that builds momentum.
No Shared Visibility Across Sites
Without a common dashboard, every facility re-litigates the same value argument to its own leadership instead of pointing to network-wide proof.
Dirty Data Entering the Model
Data quality issues affect a majority of implementations. Uncalibrated sensors and inconsistent historical records undermine predictions before they start.
What Multi-Site Predictive Maintenance Actually Returns
These figures come from programs that scaled with a repeatable framework rather than a bespoke build at every site. Manufacturers running dozens of sites report that standardizing reliability across thousands of assets, not adding more sensors, is what unlocks the bigger returns.
Your Next Nine Plants Don't Need Nine Separate Pilots
iFactory helps you turn a single-site win into a repeatable, network-wide rollout with shared dashboards and a support model that scales with you.
What Rolling Out Predictive Maintenance Actually Costs and Takes
Plant managers building the budget case for a network rollout need realistic ranges, not a single vendor number, since cost and timeline scale directly with how many sites and assets are involved.
| Deployment Scale | Typical Investment | Time to Initial Results |
|---|---|---|
| Single site, few critical assets | $50,000-$200,000 | 3-6 months |
| Multi-line, multi-asset facility | $200,000-$1,000,000 | 6-12 months |
| Full enterprise, multi-plant network | $1,000,000+ | 12-18 months to full ROI |
Software licensing typically runs $50,000 to $500,000 depending on scope, with sensors adding $200 to $2,000 per asset. The line item plant managers most often underbudget is change management: leading organizations invest $2,000 to $5,000 per person in training and dedicate 10-15% of total implementation cost to ongoing communication and adoption support, since a rollout that technically works but nobody uses delivers none of the projected return.
Questions Plant Managers Ask Before Scaling a PdM Program
Turn One Plant's Win Into a Network-Wide Standard
iFactory builds the shared dashboards, standardized playbooks, and support model that let predictive maintenance scale past your pilot site without stalling. Book a demo and map your rollout.