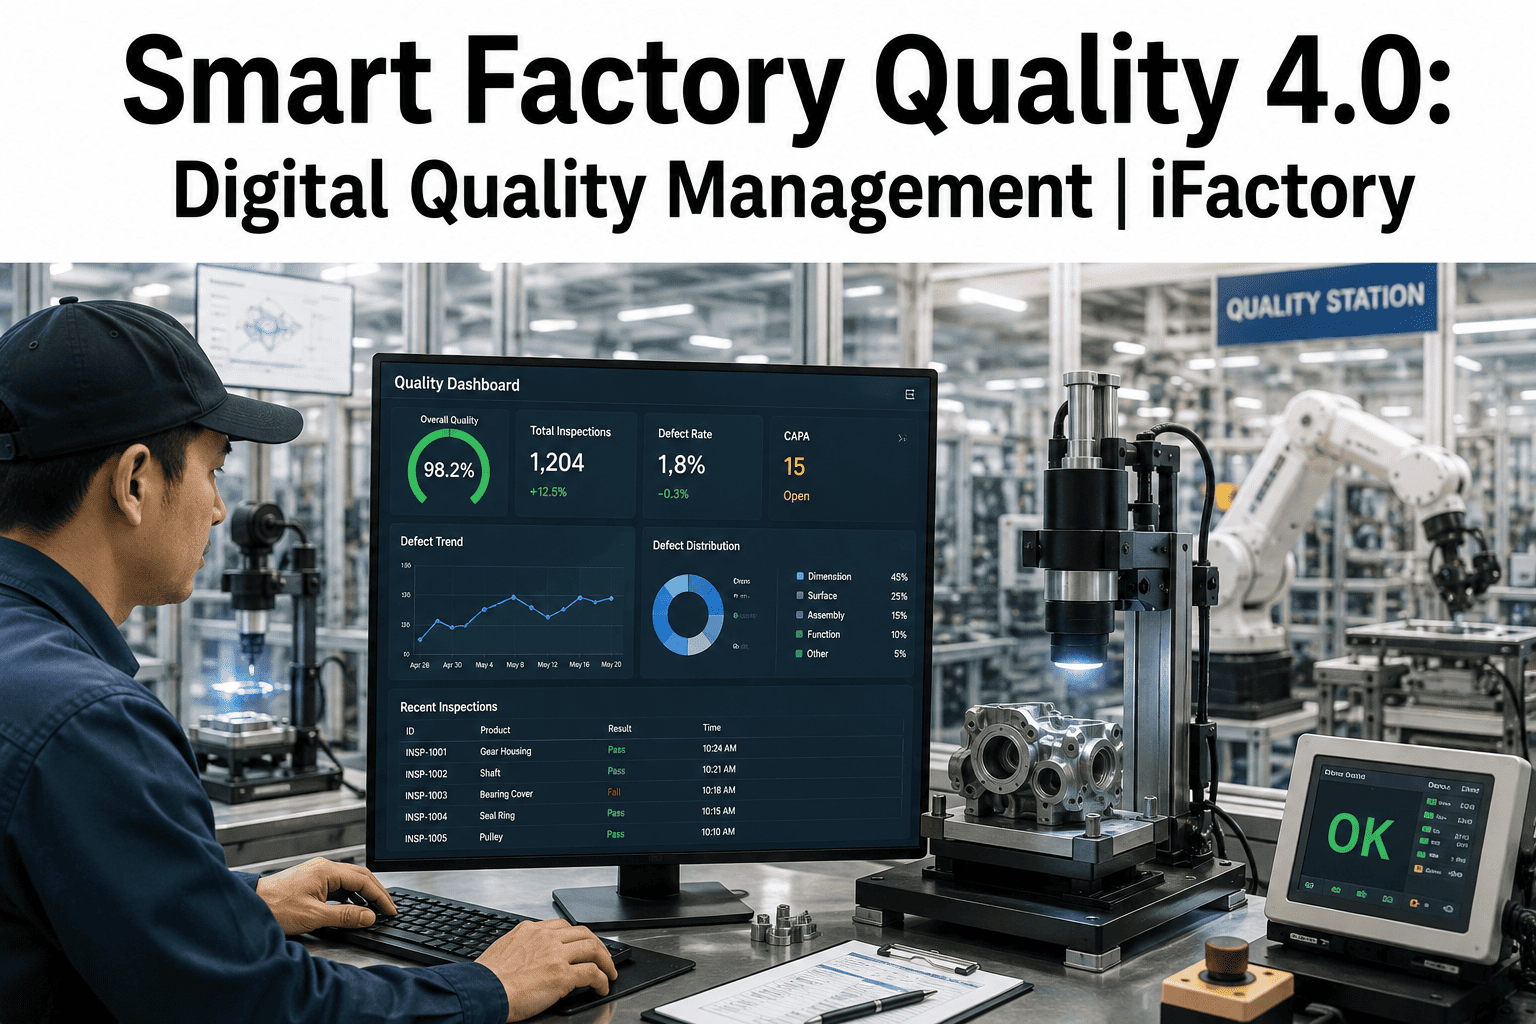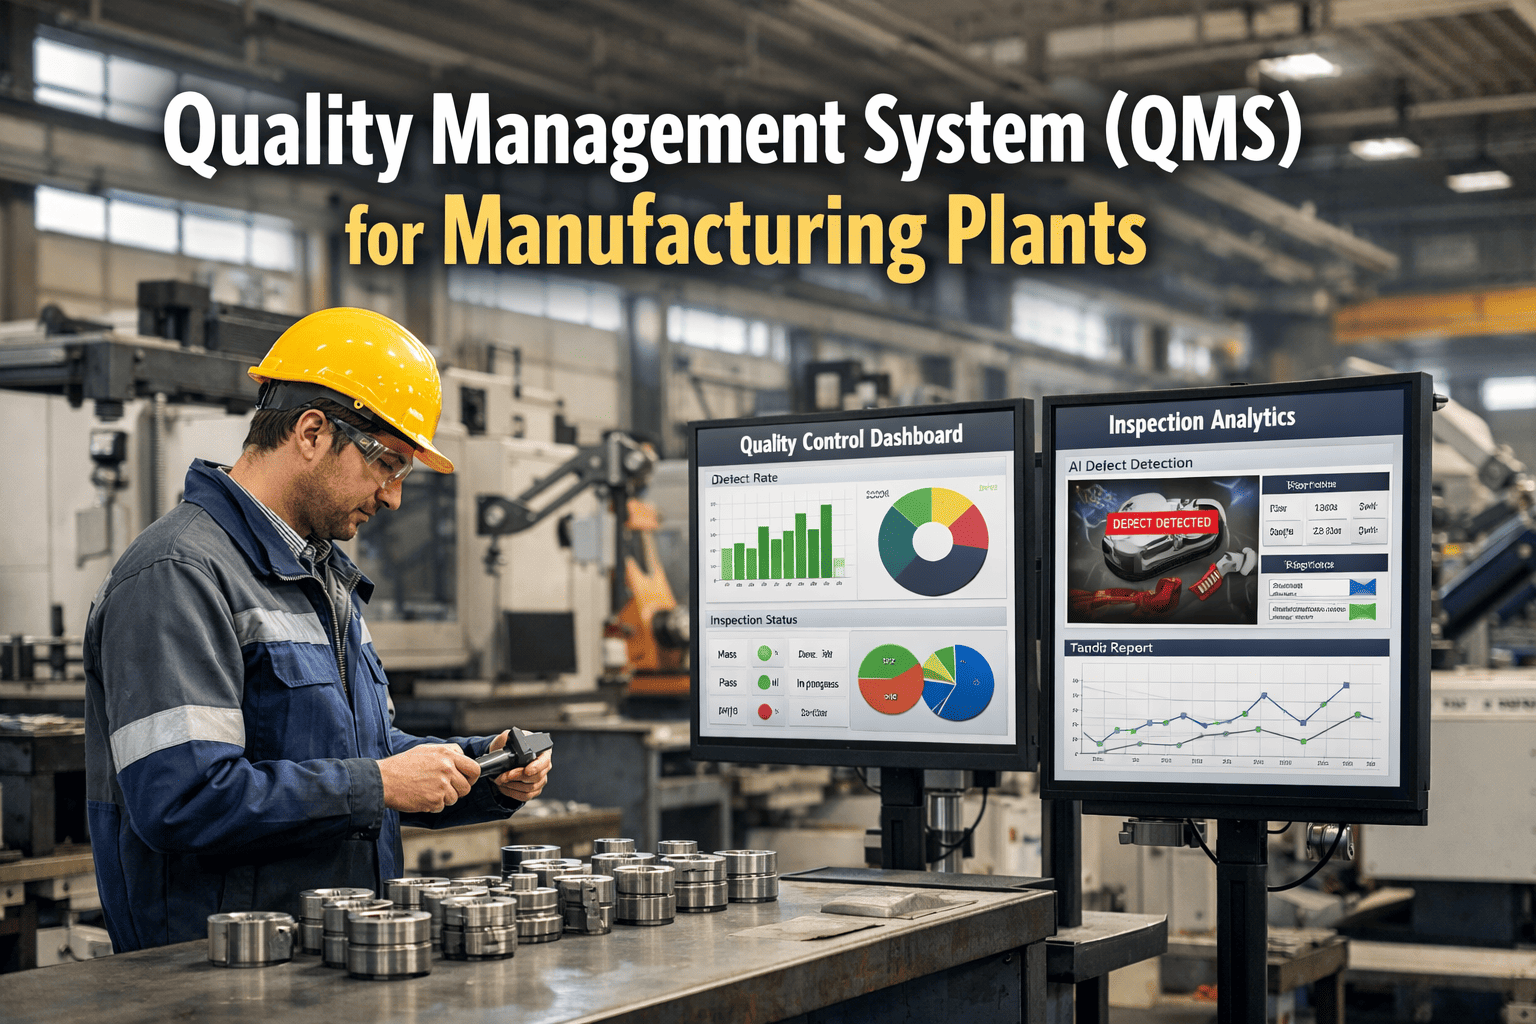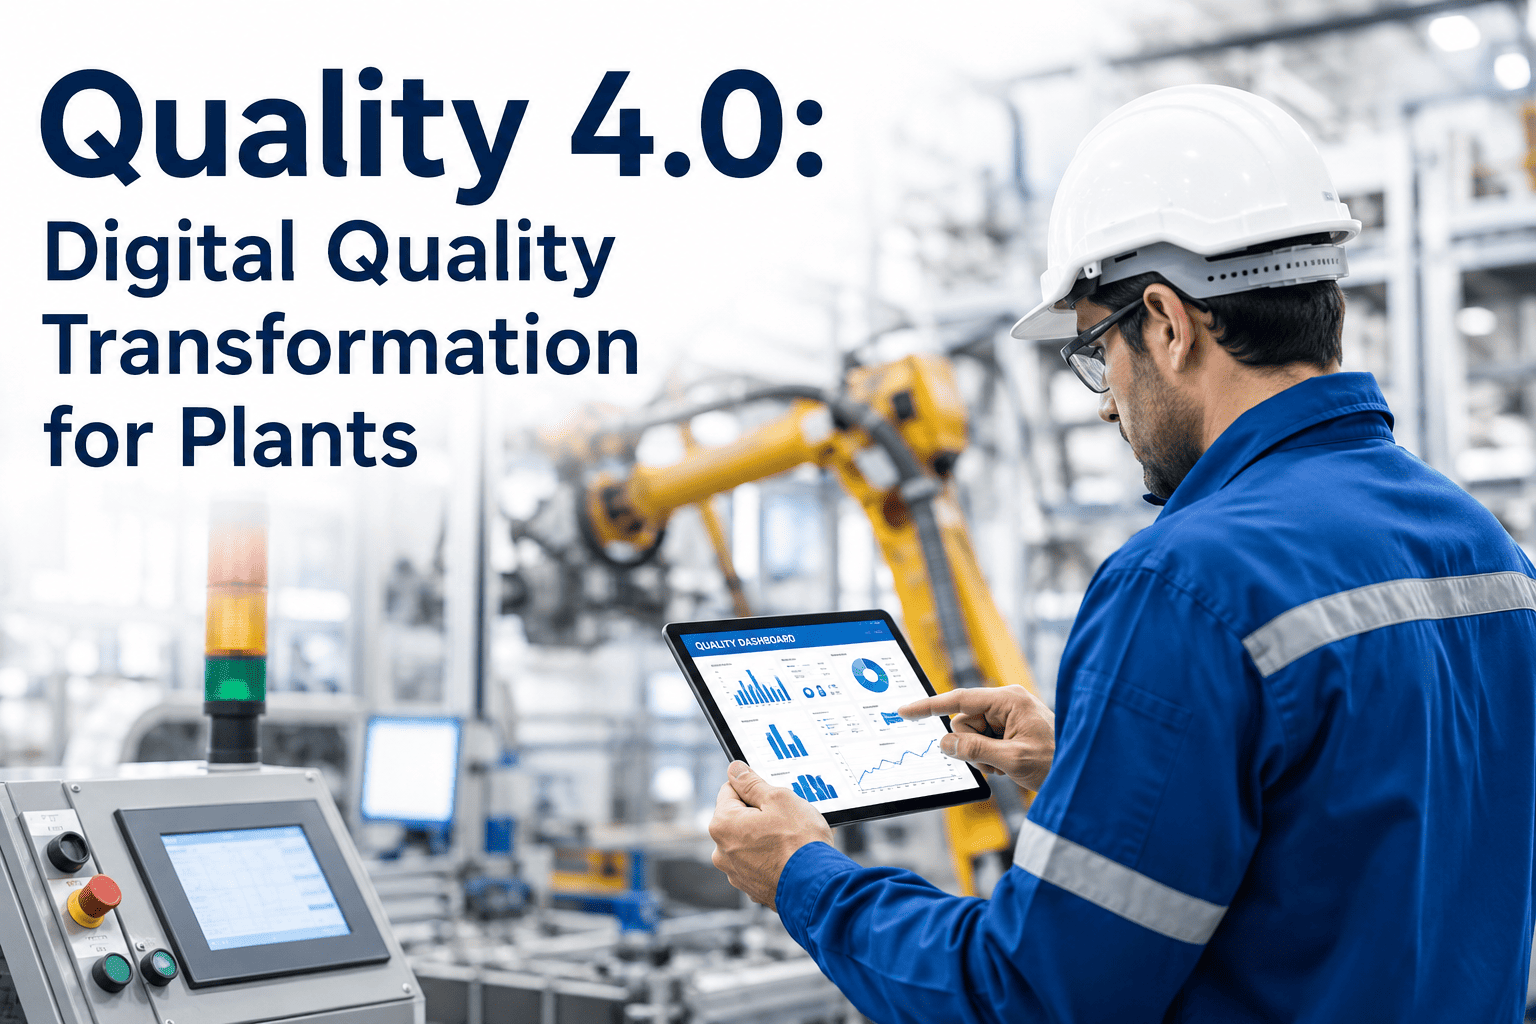
Most plants still run quality the same way they did fifteen years ago: paper checksheets, spreadsheet-based SPC charts, and a quality director who finds out about a defect trend three weeks after it started costing money. Quality 4.0 is the shift away from that reactive model, replacing static inspection logs with connected sensors, AI-driven analytics, and a digital quality management system that flags deviations while they are still small enough to fix on the line. For a quality director juggling audits, supplier issues, and customer complaints at the same time, that shift changes which fires actually need putting out. See how the reference architecture behind this fits your current QMS on a short walkthrough call.
Move Your QMS From Reactive to Predictive
iFactory connects your existing quality data sources into one AI-driven layer that flags defect trends, supplier risk, and compliance gaps before they show up in an audit finding.
Why Traditional Quality Management Falls Behind
A paper-based or spreadsheet-driven QMS can only tell a quality director what already happened. By the time a defect pattern surfaces in a monthly report, the parts have shipped, the supplier batch is gone, and the root cause has to be reconstructed from memory instead of data.
The Quality 4.0 Reference Architecture
Quality 4.0 is not one tool, it is four layers working together. Data comes in from the floor, analytics turn it into a signal, applications turn the signal into a work item, and governance keeps every step traceable for an audit.
Five Pillars of a Working Quality 4.0 Program
Plants that get real value from Quality 4.0 tend to build on the same five pillars, in roughly this order, rather than trying to digitize everything on day one.
See Which Pillar Your Plant Is Missing
Most quality directors already have two or three of these pillars in place. Our team can map your current QMS against the full model on a short call.
Traditional QMS vs Digital Quality 4.0
The functions of a QMS do not change with Quality 4.0, but how fast each function responds changes completely. This is the practical difference quality directors notice first.
| Function | Traditional QMS | Quality 4.0 Digital QMS |
|---|---|---|
| Defect Detection | Found during end-of-line or customer audit | Flagged in real time as the pattern forms |
| Root Cause Analysis | Manual investigation, days to weeks | AI-suggested cause from correlated process data |
| Supplier Risk | Reviewed quarterly from scorecard reports | Continuously scored from incoming inspection data |
| Audit Preparation | Weeks of document gathering | Traceable records exported on demand |
A 90-Day Path to a Working Quality 4.0 Program
Plants that succeed with Quality 4.0 do not try to digitize the entire QMS at once. They pick one product line, prove the model works, then expand.
What Quality Directors See on Their KPIs
The business case for Quality 4.0 shows up directly in the metrics a quality director already reports on every month.
Frequently Asked Questions
Does Quality 4.0 replace our existing QMS software?
No, it sits alongside it. Your existing QMS continues to manage document control, CAPA records, and audit trails exactly as it does today. The AI layer connects to that system and to your inspection, vision, and SPC data sources, turning raw floor data into early-warning alerts and pre-populated CAPA drafts that your team reviews and approves. Most plants connect their existing QMS within a few weeks, and the support team can walk through your specific setup.
How long does it take to see the first useful alerts?
Most pilot lines see their first meaningful early-warning alerts within four to six weeks of connecting live data feeds. The model needs an initial baseline period to learn what normal variation looks like for your specific product and process before it starts flagging real deviations with confidence. Plants that start with one focused pilot line typically move faster than those trying to connect every line simultaneously, since the baseline period is shorter and easier to validate.
What data do we need before starting a Quality 4.0 rollout?
Most plants already have enough data to start: SPC readings, inspection results, defect codes, and supplier certificates are usually sufficient for an initial pilot. Vision inspection and additional in-line sensors can be layered in later where coverage gaps exist. The first step is an audit of what data already exists across your current systems, which is typically a short exercise rather than a lengthy discovery project, and can be scoped on a short call.
Is this only useful for large enterprise plants?
Quality 4.0 scales down as well as up. A single-line pilot at a mid-sized plant can validate the approach with a fraction of the data volume a large enterprise site would generate, and the underlying model still works the same way. Smaller plants often see the pilot-to-value timeline move faster precisely because there are fewer product variants and defect codes to baseline against, not more.
How does this help specifically with ISO or customer audits?
Every alert, CAPA action, and supplier decision made through the platform is timestamped and logged automatically, which means audit preparation becomes a data export rather than a multi-week document hunt across email threads and shared drives. Auditors reviewing traceability and corrective action history typically move faster through a digital trail than a reconstructed paper one, which shortens the audit itself in addition to the prep time beforehand.
Give Your Quality Team Weeks Back Instead of Losing Them to Audits
iFactory's Quality 4.0 layer connects your existing data sources into one AI-driven model built for quality directors who need answers before the next audit, not during it.