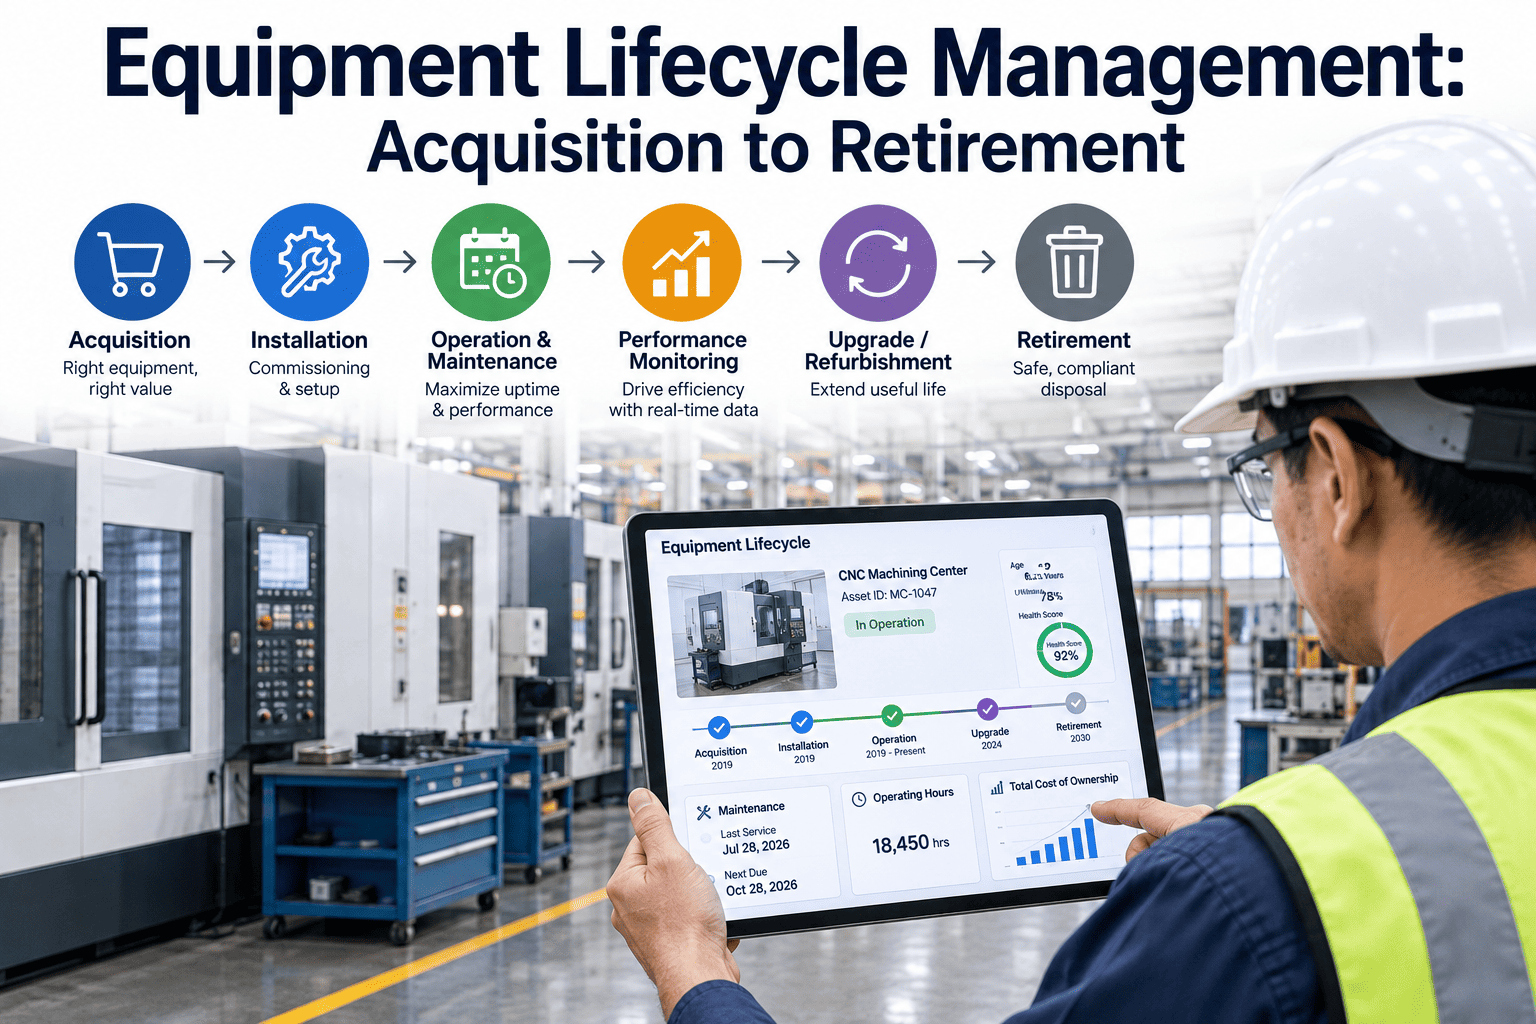
"Is this pump going to fail?" is the wrong question for a maintenance manager trying to schedule next month's work orders. The right question is "how many days do I have left before I need to act?" — and that is exactly what Remaining Useful Life prediction answers. Instead of a binary healthy-or-failing alert, RUL models produce a countdown, built from run-to-failure curves trained on how similar assets have actually degraded over time. That countdown is what lets a maintenance manager plan parts procurement, labor scheduling, and planned downtime windows around a real date instead of a guess, turning next month's maintenance calendar into something built on evidence rather than a fixed interval carried over from last year's plan. Book a demo to see RUL estimates for your own critical assets.
How RUL Prediction Actually Works
RUL models are built on run-to-failure data: historical examples of an asset (or a fleet of similar assets) operating from healthy condition through to eventual failure, with sensor readings logged throughout. The model learns the degradation curve shape — how vibration, temperature, or current draw typically trend in the weeks before a specific failure mode — and compares your asset's current trajectory against that learned curve to estimate where it sits on the same path. The output is not a single date but a probability-weighted window, which narrows automatically as more recent sensor readings confirm or adjust the asset's position on the curve.
Traditional Maintenance Planning vs. RUL-Based Planning
| Planning Approach | Basis for Scheduling | Typical Result |
|---|---|---|
| Reactive maintenance | Failure has already occurred | Unplanned downtime, emergency parts sourcing, overtime labor |
| Calendar-based preventive maintenance | Fixed time or usage interval | Over-maintenance on healthy assets, under-protection on fast-degrading ones |
| Condition-based maintenance | Current sensor readings vs. fixed thresholds | Better than calendar-based, but no forward-looking timeline |
| RUL-based predictive maintenance | Modeled degradation curve and estimated failure window | Repairs scheduled inside a known window, parts and labor pre-staged |
The shift from condition-based to RUL-based maintenance is subtle but important: condition-based systems tell you an asset has crossed into an unhealthy state, while RUL systems tell you approximately how much runway remains before that unhealthy state becomes a failure. That difference is what turns a maintenance calendar from reactive to genuinely proactive, and it is the reason maintenance managers who have used both approaches describe RUL-based planning as the first system that lets them negotiate downtime windows with production on their own schedule rather than production's emergency timeline.
What Drives RUL Model Accuracy
Not all RUL estimates are equally trustworthy. Maintenance managers evaluating a platform should understand what actually determines how tight and reliable the predicted failure window will be for their specific assets, since these same factors also explain why two assets of very different types can produce very different quality predictions from the same underlying platform.
Building an RUL-Driven Maintenance Calendar
Rank Assets by RUL and Criticality
Sort the fleet by shortest RUL estimate first, then weight by production criticality so a moderately urgent bottleneck asset outranks a low-impact spare with a similar countdown.
Pre-Stage Parts Against the Window
Order long-lead-time parts as soon as an asset enters the degrading tier, rather than waiting for a maintenance work order to trigger procurement after the fact.
Slot Repairs Into Existing Planned Downtime
Match RUL windows against already-scheduled maintenance shutdowns wherever the timing allows, avoiding an additional unplanned stoppage entirely.
Re-Score Weekly as New Sensor Data Arrives
Treat the RUL estimate as a living number that narrows and updates as new degradation data comes in, not a one-time projection set at initial detection.
A Worked Example: Bearing Degradation on a Production Fan
Consider a induced-draft fan bearing on a continuous production line. Historical run-to-failure data across a fleet of 40 similar bearings shows a consistent pattern: vibration RMS begins climbing steadily roughly 45 days before failure, accelerates sharply in the final 10 days, and the bearing temperature only crosses a traditional alarm threshold in the last 3–4 days. A threshold-based system would have given the maintenance team a few days of warning. The RUL model, trained on the full fleet's degradation curves, identifies the early vibration trend at day 45 and produces an initial estimate of "35–50 days remaining," updating weekly as new data narrows that window.
By the time the bearing reaches the 15-day mark, the model's confidence window has narrowed to roughly 12–18 days, giving the maintenance team a precise enough target to order the replacement bearing, schedule the technician, and slot the repair into an already-planned changeover window three weeks out — avoiding both an unplanned stoppage and the cost of replacing the bearing prematurely.
What Data a Maintenance Team Needs Before Starting
Maintenance managers considering an RUL pilot often ask what needs to be in place before the first model can be trained. The honest answer is less than most expect, but the following four inputs meaningfully shorten the path to a trustworthy first prediction.
Frequently Asked Questions
How accurate are RUL predictions in practice?
Accuracy is typically expressed as a confidence window rather than a single date — for example, an estimate might read "30–45 days" rather than a precise day count. As an asset moves further into its degradation curve and more recent sensor data accumulates, that window narrows considerably, often to within a few days by the time an asset reaches the critical tier. Accuracy also depends heavily on fleet size and failure mode consistency, which is why early pilot assets should be chosen with both criteria in mind. Book a demo to see real confidence intervals for your equipment types.
What happens if an asset fails outside its predicted RUL window?
Every failure that falls outside a predicted window is fed back into the model as a labeled training example, which is one of the main mechanisms by which RUL accuracy improves over time for that specific asset class. Early in a deployment, wider confidence windows and occasional misses are expected; the goal of the first 6–12 months is building a fleet-specific degradation library, not achieving perfect accuracy on day one.
Can RUL prediction work on a single unique asset with no fleet history?
Yes, though the confidence window will be wider than for an asset with a large fleet of comparable peers. Single-asset RUL models typically rely more heavily on physics-informed degradation curves calibrated to that asset's specific design parameters, combined with its own sensor history, rather than purely data-driven fleet comparisons. Accuracy still improves meaningfully over the first several detected degradation events as the model builds its own asset-specific history.
How does RUL prediction change spare parts inventory strategy?
RUL estimates let maintenance managers shift from carrying large safety stock across every critical spare to a just-in-time procurement model for parts with predictable lead times, freeing up working capital while still avoiding stockouts. For parts with long or unreliable lead times, the RUL window becomes the trigger point for placing an order rather than a fixed reorder quantity threshold. Talk to our engineers about integrating RUL triggers with your existing parts inventory system.
Which failure modes are best suited to RUL prediction?
Gradual, wear-based failure modes — bearing degradation, seal wear, belt stretch, filter loading — are the strongest fit, since they produce a measurable, trackable sensor trend over time. Sudden, catastrophic failure modes with no measurable precursor, such as a snapped shaft from an external shock event, are poor candidates for RUL modeling and are better addressed through anomaly detection or design-level risk mitigation instead.