A water manager reviewing last month's utility invoice already knows the frustrating part: the number moved, and there is no clean story for why. Electricity has meters at every panel and gas has meters at every burner, but water usually has one meter at the property line and maybe a handful of submeters scattered across the plant, which means a slow leak in a buried line, a cleaning cycle running longer than it needs to, or a cooling tower losing more to drift than it should can all hide inside one aggregate number for months. Water is treated as the third utility, behind electricity and gas in attention even though it often carries real cost through consumption, discharge fees, and treatment chemicals combined. iFactory tracks water flow at the process level, flags anomalies that look like leaks or waste, and shows exactly where consumption is diverging from what production actually requires, and you can book a demo to see it mapped against your own plant's water balance.
Water Is the Utility Cost That Hides in Plain Sight Behind a Single Aggregate Meter
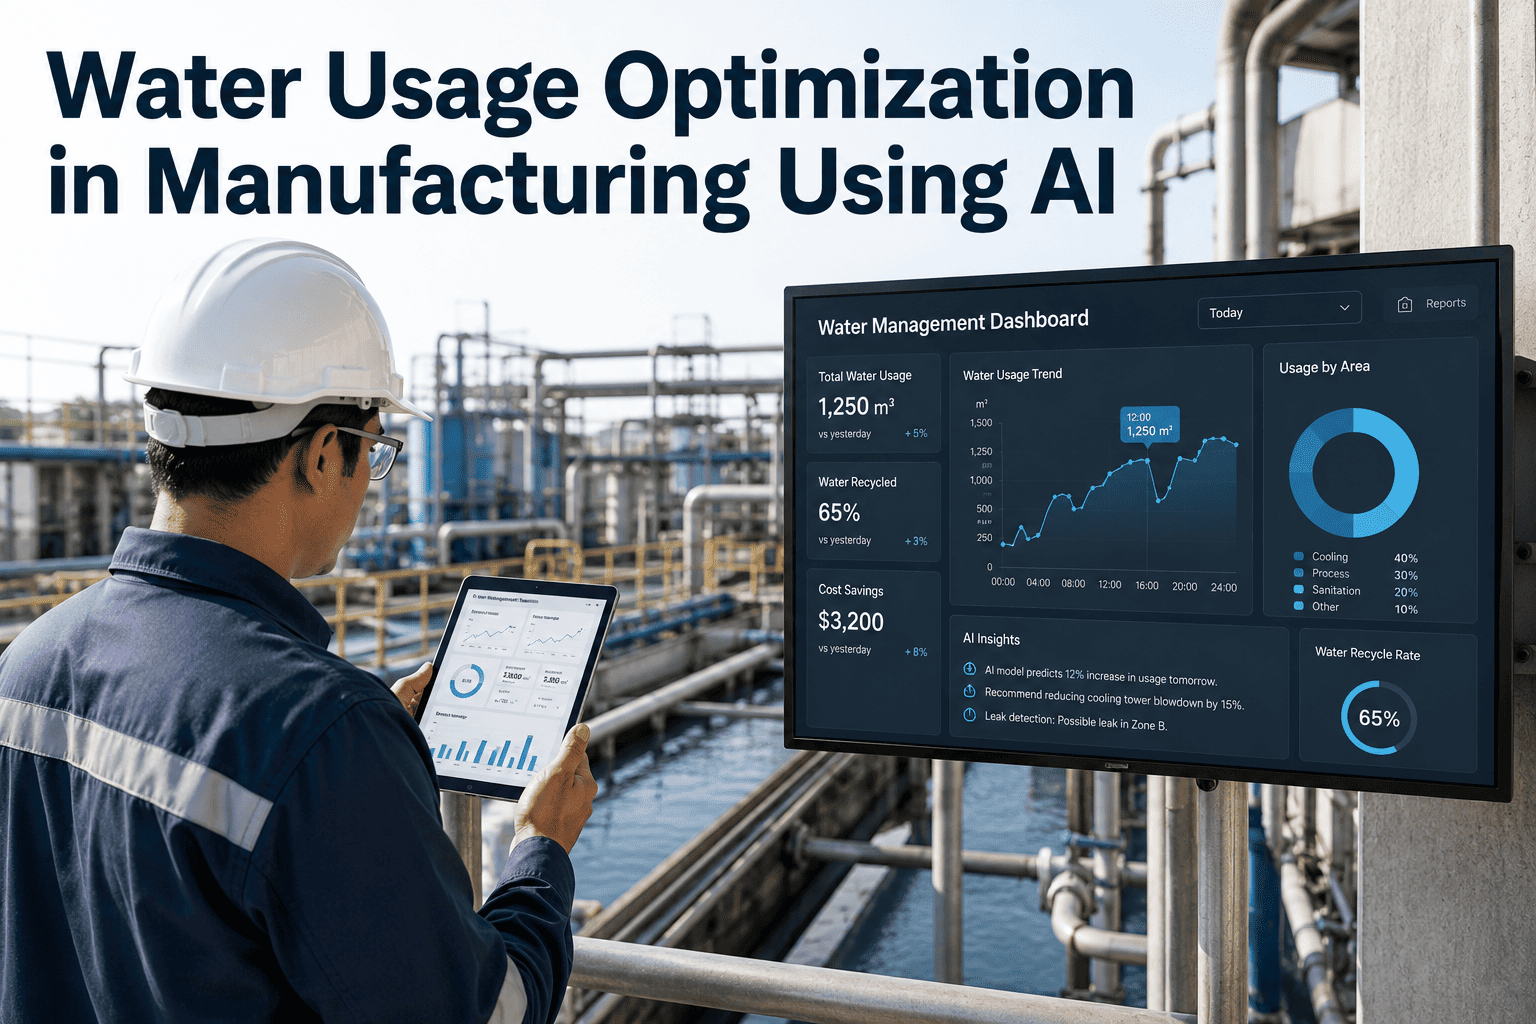
iFactory monitors water flow at the process and zone level, detects leak and waste signatures early, and optimizes cleaning cycles and cooling tower operation against actual production need instead of a fixed operating assumption.
A Typical Manufacturing Site Draws Water Across Five Distinct Consumption Categories
Without process-level submetering, all of these categories collapse into a single number on the utility bill, which makes it nearly impossible to tell whether a rising water cost is a process problem, a leak, or simply higher production volume.
Process Water
Water consumed directly in the manufacturing process, scaling with production volume.
Cooling Tower Makeup
Water lost to evaporation, drift, and blowdown in cooling tower operation.
Cleaning & Sanitation
Wash-down and CIP cycles that often run on a fixed schedule regardless of actual soil load.
Boiler Feed & Steam
Makeup water for steam systems, sensitive to condensate return efficiency.
Domestic & Facility Use
Restrooms, break areas, and general facility use, typically the smallest but most stable category.
A Leak Rarely Announces Itself, It Shows Up as a Pattern That Breaks From Normal Usage
Most plant leaks are not dramatic ruptures, they are slow losses through aging gaskets, cracked fittings, or valves that no longer seat fully closed, and the signature they leave in flow data is distinct from normal process variation once you know what to look for.
Non-Zero Night Flow
Flow that never drops to baseline during periods when the associated process is fully shut down usually indicates a leak somewhere in that zone's piping.
Gradual Baseline Creep
A slowly rising minimum flow over weeks, even as production volume stays flat, points to a developing leak rather than a process change.
Flow-Production Decoupling
Water consumption rising while production output stays flat or falls is one of the clearest signals that something outside the process is consuming water.
A Leak That Runs for Three Months Before Discovery Has Already Cost More Than the Fix
iFactory flags the flow signature of a developing leak within days, not the next time someone happens to notice the water bill.
Cleaning and Sanitation Cycles Are One of the Easiest Places to Recover Water Without Any Capital Investment
| Cleaning Program Factor | Fixed Schedule Approach | Demand-Based Approach |
|---|---|---|
| Cycle trigger | Fixed time interval regardless of actual soil load | Triggered by actual production changeover or contamination signal |
| Rinse duration | Fixed duration set conservatively to guarantee cleanliness | Adjusted based on real-time conductivity or turbidity feedback |
| CIP water reuse | Final rinse water typically discharged without reuse evaluation | Reuse opportunities flagged based on water quality at each stage |
| Verification | Assumed clean based on completed cycle time | Verified against actual water quality data collected during the cycle |
Cooling Towers Are Often the Single Largest Non-Process Water Consumer on Site
A cooling tower loses water to three mechanisms: evaporation, which is necessary and scales with heat rejection load, drift, which is largely avoidable water loss through the tower's exhaust, and blowdown, which removes concentrated minerals but is frequently set higher than necessary as a conservative default. Because blowdown rate is usually controlled by a fixed conductivity setpoint rather than an optimized one, many towers discharge more water than their actual water chemistry requires, and the gap between a conservative blowdown setpoint and an optimized one can represent a meaningful share of total site water use on facilities with large cooling loads. Tracking actual cycles of concentration against the water chemistry limits your treatment program allows makes it possible to safely tighten that setpoint and reduce blowdown volume without increasing scaling or corrosion risk.
Combined with drift monitoring and heat load-based makeup water prediction, cooling tower optimization is frequently one of the fastest areas to show a measurable reduction in overall site water draw once it receives dedicated attention.
What Water Managers Report After Adding Process-Level Water Monitoring
Water Costs Less Per Unit Than Energy, Which Is Exactly Why It Gets Overlooked
On a per-unit basis, water is dramatically cheaper than electricity or natural gas, and that simple fact quietly shapes how much organizational attention it receives. Energy efficiency projects get capital budgets, dedicated staff, and executive visibility because the dollar figures involved are large enough to justify the attention. Water usually does not clear that bar on its own, even though the combined cost of consumption, treatment chemicals, and discharge or sewer fees can add up to a meaningful line item once all three are counted together rather than viewed separately. This is compounded by the fact that most facilities have far less metering granularity for water than they do for electricity, which means the data needed to even build the business case for a water program is often missing in the first place.
The result is a utility that quietly accumulates waste for years because no single number is ever large enough on its own to trigger a dedicated investigation, even though the combined annual cost across consumption, treatment, and discharge frequently rivals other utility line items that receive far more scrutiny.
Combining Consumption, Treatment, and Discharge Costs Tells the Real Water Story
A water optimization business case is usually stronger than it first appears once all three cost components are combined into one picture instead of being reviewed separately by different teams. Reducing intake volume lowers the direct consumption charge, but it also reduces the volume of chemicals needed for treatment and often reduces discharge or sewer fees calculated on the same volume basis, which means a percentage reduction in raw water draw typically produces a larger percentage reduction in total water-related cost. Sustainability teams tracking water intensity targets tied to production volume also benefit directly, since the same underlying data that supports the cost case supports stewardship reporting without needing a separate data collection effort.
Questions Water Managers Ask About AI-Based Water Optimization
Stop Letting Water Hide Behind a Single Meter at the Property Line
iFactory breaks your water usage down by process, catches leaks early, and optimizes cleaning and cooling water against actual demand.