Cement manufacturing is one of the most energy-intensive industrial processes on earth — and the rotary kiln sitting at the center of every integrated cement plant represents both the highest operating cost and the greatest single opportunity for AI-driven performance improvement. With global cement production exceeding 4.1 billion tonnes annually and energy costs typically accounting for 30 to 40 percent of total production costs, the gap between average kiln performance and optimized kiln performance translates directly into millions of dollars per year in fuel savings, clinker quality improvements, and avoided downtime at every production scale from 1,500 TPD to 12,000 TPD operations. U.S. cement producers — operating in a market where natural gas and coal-derived fuel costs fluctuate significantly and where ASTM clinker quality standards leave little tolerance for process deviation — compete on the thinnest margins between break-even and profitability. Overall Equipment Effectiveness for U.S. cement kilns averages between 72 and 79 percent. World-class performance is 88 percent or better. At a 5,000 TPD kiln running at $110 per tonne clinker production cost, each percentage point of OEE represents approximately $2.1 million in annual production value. iFactory's AI-powered cement plant analytics platform delivers rotary kiln optimization, clinker quality prediction, raw mill and finish grinding efficiency, and integrated predictive maintenance — purpose-built for the process complexity and regulatory environment of U.S. cement manufacturing. Facilities deploying iFactory's cement analytics platform achieve 8 to 14 percentage point OEE improvements within 12 months, reduce specific heat consumption by 6 to 11 percent and build the operational data infrastructure required for long-term cost competitiveness and environmental compliance.
Why Cement Plants Need AI Analytics — Not Just Process Automation
Traditional process control in cement manufacturing — PID loops, manual kiln operator adjustments, periodic lab sampling for clinker quality — was designed for a world where data was scarce and processing was slow. The modern cement plant generates thousands of sensor data points per minute across the pyroprocessing line, raw material handling, and grinding circuits, and the human operator capacity to process and act on that data in real time is structurally limited. AI analytics changes the fundamental operating model: instead of operators reacting to process deviations after they have already affected product quality or fuel consumption, the analytics engine detects the leading indicators of deviation and surfaces actionable recommendations before the impact occurs.
The value case for cement plant analytics is anchored in three structural realities of cement manufacturing economics. First, rotary kiln fuel efficiency is non-linear — small process parameter deviations compound into large fuel consumption increases, and the relationship between kiln feed composition, flame geometry, and specific heat consumption cannot be managed effectively with manual monitoring at production speeds. Second, clinker quality variation has a multiplier effect on downstream costs: a 1 percent decline in C3S content forces either increased clinker factor in cement grinding (raising production costs) or a quality specification miss that creates customer and regulatory liability. Third, equipment failures in pyroprocessing — kiln tire cracking, preheater cyclone blockages, cooler grate failures — are among the most expensive unplanned events in manufacturing, with single failure events routinely exceeding $500,000 in repair costs plus lost production value. Book a Demo to see how iFactory's cement analytics platform addresses each of these value drivers at your facility's specific production scale.
Cement Plant OEE Benchmark: Analytics Performance by Production Unit
OEE performance, the dominant loss category, and the highest-value analytics improvement strategy differ significantly across the production units of an integrated cement plant. The table below maps current U.S. industry OEE ranges, world-class targets, the dominant loss mechanism at each unit, and the iFactory analytics focus that drives the highest-value improvement. Book a Demo to see your plant's production units benchmarked against this data.
| Production Unit | U.S. Industry Range | World-Class Target | Dominant Loss Mechanism | iFactory Analytics Focus | 12-Month OEE Gain |
|---|---|---|---|---|---|
| Rotary Kiln | 72–81% | 89%+ | Availability — refractory failures, tire/shell deformation, preheater blockages | Thermal profile analytics, refractory wear prediction, shell scanner integration, preheater blockage early warning | +7–11 pts |
| Raw Mill (VRM / Ball Mill) | 68–77% | 85%+ | Performance — feed variability and grinding media wear causing throughput reduction | Feed composition analytics, vibration-based grinding efficiency monitoring, roller wear tracking | +8–12 pts |
| Preheater / Calciner | 74–83% | 90%+ | Quality + Availability — incomplete calcination from fuel variation and cyclone fouling | Calcination degree prediction, cyclone pressure differential monitoring, fuel quality correlation analytics | +6–10 pts |
| Clinker Cooler | 70–79% | 87%+ | Performance — red river events, grate failures, inefficient secondary air temperature | Grate condition monitoring, secondary/tertiary air temperature optimization, red river early detection | +8–12 pts |
| Finish Grinding Mill | 65–75% | 84%+ | All three — separator efficiency, grinding media wear, product Blaine variation | Separator optimization analytics, grinding media charge tracking, Blaine prediction from mill internals data | +9–14 pts |
| Packing & Dispatch | 69–78% | 86%+ | Availability — packer machine downtime, truck loading delays, dust collector failures | Packer downtime analytics, truck turnaround tracking, dust collector predictive maintenance | +7–10 pts |
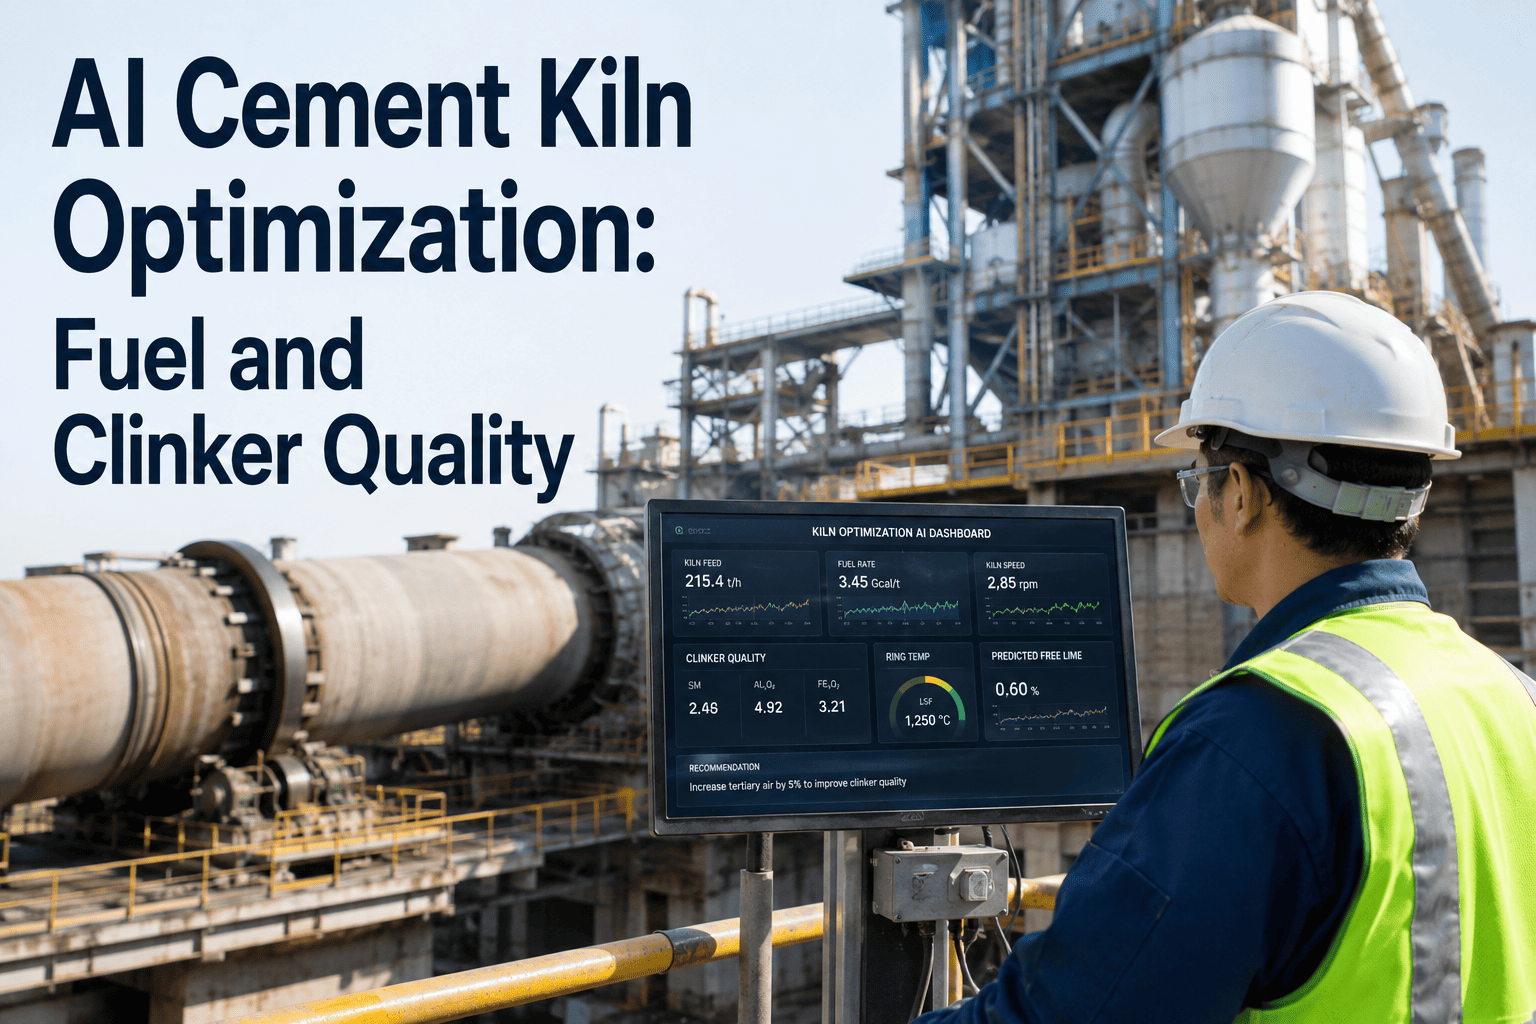
AI Kiln Optimization: How iFactory Transforms Rotary Kiln Performance
The rotary kiln is the most complex and highest-cost process unit in cement manufacturing — and it is the unit where AI analytics delivers the largest concentration of production value. Kiln optimization is not a single problem; it is a set of interdependent challenges spanning fuel efficiency, clinker quality, equipment integrity, and environmental compliance that interact in ways that are beyond the capacity of manual process control to manage simultaneously. iFactory's AI kiln optimization module addresses each dimension with purpose-built analytics that operate on the full sensor data stream from the pyroprocessing line.
Cement Grinding Optimization: Raw Mill to Finish Mill Analytics
Grinding circuits — raw mill, coal mill, and finish grinding — account for 35 to 45 percent of total cement plant electrical energy consumption and represent the second-largest analytics opportunity after pyroprocessing. iFactory's grinding optimization analytics operate across all grinding circuit types — ball mills, vertical roller mills, and roller presses — delivering throughput improvement, specific energy reduction, and product quality consistency that compound the value of kiln optimization at the plant level.
iFactory vs. Generic Analytics Platforms: What Cement Plants Actually Get
The decision between a cement-purpose-built analytics platform and a generic industrial IoT product determines whether plant engineers receive actionable process intelligence or a data visualization layer that requires as much interpretation as the raw historian data. The comparison below maps the functional differences that determine real-world analytics value in cement operations.
- OEE models not calibrated to cement process — kiln campaigns, refractory change-outs classified incorrectly as unplanned downtime
- No clinker quality prediction — quality management remains dependent on 30–60 minute lab sample lag
- No refractory life model — kiln shell scanner data displayed but not integrated with failure risk prediction
- Emissions data collected but not correlated with process parameters — compliance analytics require separate system
- Grinding circuit analytics require custom model development — 6 to 12 month deployment before value delivery begins
- No cement-specific predictive maintenance models — vibration alerts generic, not calibrated to kiln tire, roller press, or separator failure modes
- Deployment team without cement process domain knowledge — model calibration accuracy limited by consultant understanding of process physics
- OEE model pre-configured for cement production — kiln campaigns, planned maintenance, and refractory events classified correctly from day one
- Real-time clinker quality prediction — C3S, free lime, and phase composition estimated 30–60 minutes ahead of lab confirmation
- Refractory remaining life model integrated with shell scanner and thermal data — planned intervention before failure
- EPA NESHAP and Title V compliance analytics built in — CEMS data correlated with process parameters for emissions optimization
- Pre-built grinding circuit models for ball mill, VRM, and roller press — operational analytics at deployment, not after custom development
- Cement-specific predictive maintenance models — kiln tire wear, roller press bearing, preheater fan failure modes pre-calibrated
- Cement process engineers on deployment team — model accuracy reflects domain knowledge of pyroprocessing physics from day one
The iFactory Cement Deployment Process: Live Analytics in 4 to 6 Weeks
Cement plant analytics deployments that require 12 to 18 months before delivering operational value do not address the current-quarter efficiency challenges that justify the investment decision. iFactory's cement deployment methodology is engineered for the 4 to 6 week timeline that matches the operational decision cadence of U.S. cement plant management, using a structured four-phase process that connects to existing DCS, historian, and SCADA infrastructure without disrupting production operations.
Expert Perspective: What Cement Operations Leaders Say About AI Analytics
The kiln is the heart of every cement plant — and for most of my career, optimizing it meant relying on the experience of your most senior kiln operators, who had 20 or 30 years of pattern recognition built up from watching flame shape and reading shell scanner prints. That knowledge is irreplaceable, but it is not scalable and it is not continuous. What iFactory's analytics platform brought to our operation was a way to make that expert pattern recognition systematic and available on every shift, not just when the senior operator was standing at the control station. The clinker quality prediction model was the highest-value outcome in the first six months — we went from managing clinker quality reactively through lab results to managing it proactively through real-time process data. The specific heat consumption reduction took longer to fully realize, but the combination of thermal profile optimization and preheater efficiency improvements delivered 8 percent SHC reduction over 12 months, which at our fuel cost structure was worth more than the entire platform investment in year one. The predictive maintenance value was harder to quantify in advance, but we had one preheater fan bearing failure prediction that gave us 11 days of warning before the bearing reached failure threshold — that planned intervention versus an unplanned failure is the kind of ROI that pays for multiple years of analytics subscription. For cement plant managers evaluating analytics investments: the technology is mature enough that the risk is not in the platform — the risk is in deploying a generic system that requires your team to do the cement process engineering work that a purpose-built platform should already have done."
Conclusion
The competitive gap between AI-driven and conventionally operated cement plants is widening at a rate that makes analytics adoption a strategic necessity rather than an efficiency nicety. U.S. cement producers facing sustained fuel cost pressure, tightening EPA emission limits, aging kiln assets, and customer demand for consistent product quality cannot sustain the OEE and energy performance gaps that characterize facilities operating without real-time process analytics. The 72 to 79 percent OEE average across U.S. cement kilns represents a recoverable production value that, at current market pricing and fuel costs, dwarfs the investment required to deploy purpose-built AI analytics.
iFactory's cement plant analytics platform — with AI kiln optimization, real-time clinker quality prediction, grinding circuit efficiency analytics, cement-specific predictive maintenance models, and EPA NESHAP compliance integration — delivers that recovery within the 4 to 6 week deployment timeline that matches operational decision cycles. The 8 to 14 percentage point OEE improvements and 6 to 11 percent specific heat consumption reductions documented at comparable facilities are the outcomes of treating analytics not as a reporting layer but as the operational decision infrastructure that drives improvement actions at the kiln, mill, and maintenance team level every day. Book a Demo to see iFactory's cement analytics platform configured for your specific kiln type, production units, and highest-value improvement opportunities.
Frequently Asked Questions
iFactory's clinker quality prediction model uses raw meal chemistry inputs from the raw mill circuit, kiln thermal profile data (temperatures, gas analysis, shell scanner), and historical correlations between process parameters and lab-confirmed clinker phase composition to estimate C3S, free lime, and C3A content in real time. The model improves its accuracy continuously as new lab data is ingested. A real-time XRF analyzer can be integrated when available, but is not required for the prediction model to deliver actionable quality management value.
Yes — iFactory connects to all major cement plant DCS and historian platforms including FL Smidth ECS/ProcessExpert, ABB System 800xA, Siemens CEMAT, and Rockwell FactoryTalk historians via OPC-UA, OPC-DA, and direct historian API connections. The data connection process does not require DCS configuration changes or production interruption. iFactory also integrates with cement plant LIMS systems for lab data ingestion and CEMS data feeds for emissions analytics.
Comparable U.S. cement facilities achieve 6 to 11 percent specific heat consumption reduction within 12 months of iFactory deployment, depending on the starting SHC baseline, kiln type (wet, dry, precalciner), fuel mix, and the degree of management engagement with analytics-driven process adjustments. The reduction comes from a combination of burner optimization, secondary air temperature improvement, preheater efficiency gains, and feed chemistry stabilization — with the first 4 to 6 percent typically achievable within the first 6 months of deployment. Book a Demo for a facility-specific estimate.
iFactory's emissions compliance module integrates CEMS data streams (NOx, SO2, CO, particulate, HCl, THC) with kiln process parameters to generate continuous compliance monitoring dashboards and automated periodic compliance reports formatted for EPA Electronic Reporting Tool submission. The platform correlates emissions performance with kiln operating conditions to help operators maintain production rate and clinker quality while staying within permit limits — turning compliance monitoring from a reactive documentation burden into a proactive emissions optimization tool.
iFactory's cement analytics platform is designed to deliver positive ROI at production scales from 1,500 TPD single-kiln operations to 12,000+ TPD multi-kiln integrated complexes. Deployment costs for a single-kiln cement plant with raw mill and finish grinding start at $22,000 with annual licensing that scales with production units rather than enterprise minimums. The OEE and SHC improvement value case is proportional to production scale — and the percentage ROI on analytics investment is often higher at mid-size operations where the starting performance baseline is lower and quick-win improvement opportunities are more concentrated.