Falling sulfur conversion in a Claus sulfur recovery unit (SRU) does not announce itself cleanly — it shows up as creeping SO2 violations, unexplained drops in outlet purity, or a tail gas treating unit working overtime to compensate for upstream losses that should not be there. For U.S. refinery and gas processing engineers managing MACT and NSR compliance, every percentage point of conversion loss represents both a regulatory exposure and a direct revenue hit on recovered elemental sulfur. This page walks through the core diagnostic framework — air ratio control, reaction furnace temperature, converter bed condition, and tail gas treating unit performance — so reliability and process engineers can identify root causes faster and stop chasing symptoms with reactive maintenance cycles. Book a Demo to see how iFactory's AI-driven analytics platform monitors SRU process parameters in real time and flags conversion degradation days before it triggers an emissions exceedance.
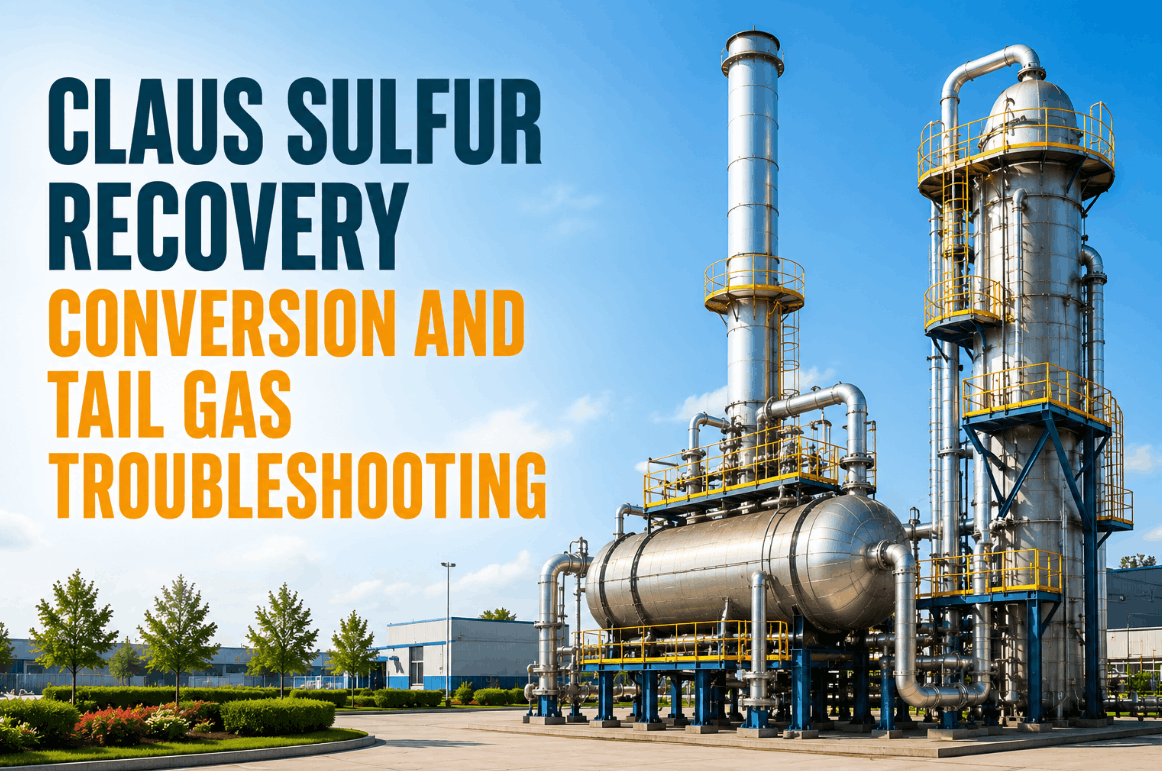
How the Claus Process Works — and Where Conversion Breaks Down
The modified Claus process converts H2S into elemental sulfur through a combination of thermal and catalytic stages. In the thermal reaction furnace, roughly one-third of the incoming H2S is combusted with controlled air to produce SO2 at temperatures above 1,800°F (980°C). The resulting H2S and SO2 then react in both the thermal section and downstream catalytic converter beds to produce elemental sulfur and water vapor. The process gas is cooled between stages to condense and drain liquid sulfur before passing to the next converter bed.
A well-operated 3-bed Claus plant achieves 96–98% overall sulfur conversion. The gap between that theoretical ceiling and what most plants actually run — and the additional gap that makes tail gas treating units necessary — comes from four compounding failure mechanisms that are largely invisible to threshold-based alarm systems.
Root Cause Diagnostics: The Four Primary SRU Conversion Failure Modes
When sulfur conversion drops, the instinct is often to look at the converter catalyst first. In practice, the most common root causes sit upstream — in the air ratio control loop or the reaction furnace — and manifest in the catalyst beds only as secondary effects. Diagnose in this sequence before committing to a catalyst changeout.
The Claus reaction requires exactly 2 moles of H2S per mole of SO2 at each converter bed. Any deviation — caused by feed composition shifts, air control valve drift, or analyzer miscalibration — pushes the equilibrium away from maximum sulfur yield. Excess SO2 (ratio below 2.0) escapes to the tail gas unit and degrades amine absorber performance. Excess H2S (ratio above 2.0) leaves unreacted sulfur vapor in the process gas.
Furnace temperature must stay above 1,800°F (980°C) to ensure complete ammonia destruction from sour water stripper gas, and to prevent COS and CS2 carry-through to the catalyst beds. If temperature runs low — due to lean feed, poor burner atomization, or excessive dilution air — COS and CS2 hydrolysis becomes incomplete in the first converter bed, reducing total recovery. Conversely, excessive temperature accelerates refractory and waste heat boiler tube degradation.
Alumina catalyst in Claus converter beds degrades through sulfation, carbon deposition from soot carry-over, and liquid sulfur flooding if bed temperature drops below the sulfur dew point. Sulfation converts active catalyst surface to aluminum sulfate, permanently reducing surface area and Claus reaction rate. Soot from poor burner combustion or sub-stoichiometric furnace operation coats the catalyst pores, creating elevated pressure drop and reducing acid gas load capacity without producing a clear thermal signal.
The TGTU's hydrogenation reactor converts residual SO2, elemental sulfur, and COS back to H2S, which is then absorbed by the downstream amine system. SO2 breakthrough from the hydrogenation catalyst — caused by insufficient reducing gas supply, catalyst aging, or elevated quench water temperature — degrades amine absorber capacity and increases SO2 to the incinerator stack. Quench water pH below 6.0 is the earliest reliable indicator of SO2 breakthrough from the hydrogenation bed.
Conversion by Configuration: What Your SRU Setup Can Realistically Achieve
Recovery targets vary significantly by the number of catalytic stages and whether a tail gas treating unit is installed. The table below gives operating engineers a realistic benchmark for each configuration — and flags where iFactory's predictive monitoring adds the most value in closing the gap between nameplate capability and actual performance.
| SRU Configuration | Typical Sulfur Recovery | Key Limiting Factor | Where iFactory Monitors |
|---|---|---|---|
| 2-Bed Claus (No TGTU) | 90–95% | Thermodynamic equilibrium limit; COS/CS2 not fully hydrolyzed | Air ratio controller, second bed outlet H2S:SO2, incinerator stack SO2 |
| 3-Bed Claus (No TGTU) | 95–97% | Feed H2S concentration below 40% drops efficiency; ammonia fouling risk | Furnace temperature, first-bed COS/CS2 breakthrough, pressure drop trending |
| 4-Bed Claus (No TGTU) | 96–98% | Thermodynamic ceiling reached; further gains require TGTU | Multi-bed temperature profiles, sulfur condenser outlet temps, catalyst aging rate |
| 3-Bed Claus + TGTU (Hydrogenation/Amine) | 99.0–99.9% | Reducing gas supply, quench water pH, amine absorber capacity | Hydrogenation catalyst temp, quench pH, amine lean loading, CEMS correlation |
| Sub-Dew Point (CBA Process) | Up to 99% | Regeneration cycle timing, bed switching coordination | Bed cycle timers, temperature differentials, sulfur loading per cycle |
Tail Gas Treating Unit Troubleshooting: The TGTU Diagnostic Sequence
When stack SO2 rises and the Claus section looks stable, the TGTU is the next place to look. The hydrogenation reactor, quench tower, and amine absorber each introduce distinct failure modes that require a systematic diagnostic sequence rather than a single variable investigation.
How AI-Driven Monitoring Changes SRU Troubleshooting for U.S. Refineries
The SRU produces more high-frequency process data than nearly any other unit in a refinery — air flow, feed composition, furnace temperature, bed temperatures across three or four stages, condenser outlet conditions, quench pH, amine loading, and CEMS output — yet most reliability teams are reviewing this data reactively, after a deviation has already grown large enough to trigger a threshold alarm. iFactory's predictive analytics platform changes this by training asset-specific ML models on your plant's historical SRU process data, failure records, and CMMS work orders, then detecting compound degradation signatures across multiple parameters simultaneously — weeks before they develop into forced outages or compliance events.
iFactory connects directly to OSIsoft PI Historian, AspenTech IP21, SAP PM, and IBM Maximo — ingesting years of SRU process trends, confirmed failure events, and maintenance records without manual reformatting. The ML models learn your unit's specific air ratio behavior, seasonal feed composition patterns, and catalyst aging trajectories, producing failure probability scores that are specific to your plant — not generic industry averages applied from a vendor database. Book a Demo to see how iFactory deploys AI-driven SRU monitoring across your refinery data workflows within 5 weeks.
Expert Review: What the Data Actually Shows in Low-Conversion Events
SRU Compliance and Reporting: What U.S. Operators Need to Know
U.S. refineries operating SRUs above 20 long tons per day of sulfur capacity are subject to Subpart UUU of 40 CFR Part 63 (MACT standards for petroleum refineries), which set specific SO2 concentration limits at the incinerator stack and require continuous CEMS operation. Facilities in non-attainment areas or operating under NSR permits face additional SO2 pound-per-hour emission caps that make recovery efficiency degradation a direct permit compliance issue — not just an operational efficiency concern.
Conclusion: Conversion Loss Is a Data Problem Before It Becomes a Compliance Problem
Claus SRU conversion degradation follows a predictable pattern — air ratio drift leads, catalyst bed performance drops second, tail gas treating unit efficiency falls third, and the stack SO2 CEMS finally triggers last. By the time the CEMS fires, the process has been losing recovery efficiency for days or weeks. The failure signatures were in the data the entire time, just across too many parameters and time scales for a threshold-based alarm system to connect.
iFactory's AI-driven analytics platform ingests your full SRU historian data — air flow, furnace temperature, bed temperature profiles, condenser conditions, analyzer outputs, quench pH, amine loading, and CEMS data — and trains asset-specific ML models that detect compound degradation signatures before they cascade into permit exceedances or unplanned shutdowns. Book a Demo to see how iFactory deploys across your SRU and refinery reliability stack in five weeks, with ROI evidence beginning in week three.