CDU Desalter Performance Troubleshooting Brine and Emulsion
By Henry Green on June 13, 2026
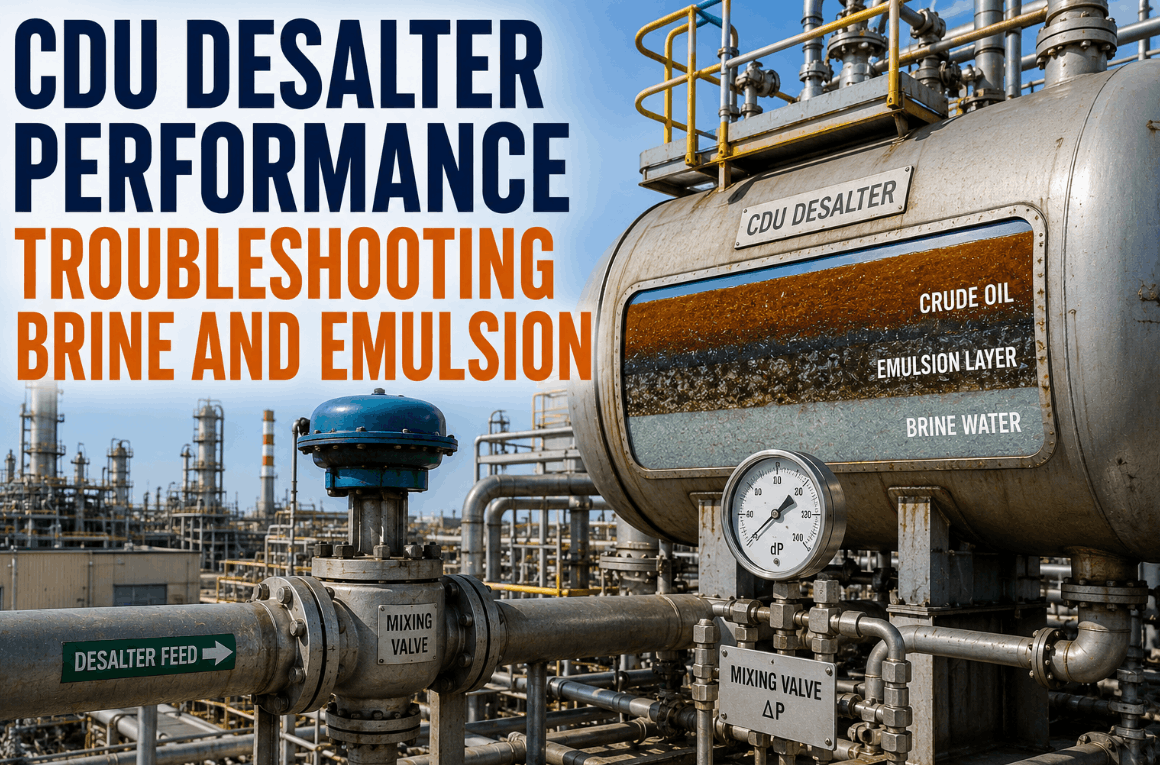
In a crude distillation unit, the desalter is the first and most consequential quality gate in the entire refinery process train — and it is the one that fails most quietly. When desalter performance degrades, the consequences don't announce themselves immediately. Salt and sediment slip through into the preheat exchangers and begin accumulating on tube surfaces. Chloride levels at the CDU overhead start climbing, and the corrosion inhibitor program starts working harder than it should. Sodium compounds reach the hydrotreater or FCC unit and begin poisoning catalysts at concentrations that, by the time they appear in activity tests, represent weeks of cumulative exposure. The connection between a poorly controlled desalter emulsion layer and a $2 million catalyst reload is rarely made in real time — because the data that would connect them lives in three separate systems and is reviewed on three separate schedules. iFactory AI integrates desalter process data — mixing valve differential pressure, emulsion layer position, demulsifier dose, brine quality, and wash water rates — into a single real-time monitoring environment that connects desalter performance to downstream unit health, continuously and automatically. To see how iFactory's CDU analytics closes the desalter visibility gap, Book a Demo with our refinery process team today.
CDU Desalter Analytics · Emulsion Control · Preheat Protection · Catalyst Risk
Real-Time Desalter Performance Monitoring Across Every Shift, Every Crude Blend.
iFactory AI monitors your mixing valve dP, emulsion band growth, demulsifier effectiveness, and brine quality in real time — surfacing desalter upsets before they become preheat fouling events or downstream catalyst incidents.
85–90%Typical salt removal efficiency in a single-stage desalter — rising to 98% with two-stage operation and optimized dP
<1 PTBSalt target for FCC and hydrotreater feed — requiring two-stage desalting and continuous emulsion monitoring
0.5–1.0 barOptimal mixing valve dP range — the single most influential control variable in desalter salt removal efficiency
3–5×Preheat train fouling rate increase when desalter BS&W exceeds 0.5 vol% in desalted crude
How Desalter Failure Propagates Through the CDU Process Train
The Hidden Cost Chain From Emulsion Layer to Downstream Unit Damage
Most refinery operations teams monitor desalter performance through two lagging indicators: the salt content of the desalted crude and the overhead chloride level at the atmospheric tower. Both are important, but neither is sufficient to catch the range of failure modes that a poorly performing desalter creates — because emulsion growth, wash water quality deterioration, and mixing valve dP drift all cause downstream damage before they appear in these headline KPIs. The table below maps the primary failure modes, their root causes, and the downstream consequences that make desalter optimization a refinery-wide economic issue, not a crude unit operations issue.
Failure Mode
Root Cause
Downstream Consequence
Annualized Cost Exposure
Emulsion Layer (Rag Layer) Growth
Asphaltene/solids stabilization, crude incompatibility, clay contamination in wash water
Electrical grid shorting, reduced residence time, brine oil carryover
$400K – $1.2M
Mixing Valve dP Too High
Valve position creep, crude viscosity increase, operator override during upset
Tight emulsion formation, elevated BS&W in desalted crude, preheat fouling
$250K – $800K
Mixing Valve dP Too Low
Under-mixing of wash water and crude, insufficient salt extraction
Poor salt removal, elevated chlorides at CDU overhead, corrosion
$180K – $600K
Demulsifier Under-Dosing
Crude blend change without chemical requalification, injection pump failure
Stable emulsion band, reduced salt removal, brine effluent quality degradation
$300K – $900K
Brine Oil Carryover
High interface level, rag layer displacement, solids accumulation at water outlet
The Five Diagnostic Variables That Determine Desalter Performance
What to Monitor, What Each Variable Tells You, and Where iFactory AI Adds Visibility
01
Mixing Valve Differential Pressure (dP)
The mixing valve dP is the primary control variable for the degree of oil-water contact in the desalter — and it is the variable most frequently operated outside its optimal window without the operations team realizing it. An optimal dP of 0.5 to 1.0 bar creates sufficient droplet dispersion for effective salt extraction while avoiding the over-shearing that generates a stable, tight emulsion resistant to electrostatic separation. iFactory monitors valve dP continuously, correlating it with real-time emulsion band position and brine quality — alerting operators when the dP is trending outside the optimal window for the current crude blend before a quality impact develops. Book a Demo to see the dP monitoring workflow.
02
Emulsion Band (Rag Layer) Position and Thickness
The emulsion band is the stabilized oil-water interface layer that forms in every electrostatic desalter — and its thickness and position are the most direct indicators of the desalter's ability to separate phases cleanly. An emulsion band that is growing signals either crude incompatibility, asphaltene precipitation, solids accumulation, or inadequate demulsifier chemistry for the current blend. iFactory tracks band position from interface level transmitters, trending band thickness against crude blend changes, demulsifier dose adjustments, and wash water quality metrics to distinguish between the four root cause categories — a critical differentiation because the correct corrective action differs for each.
03
Demulsifier Dose Rate and Effectiveness
Demulsifier chemistry is the front-line chemical intervention that destabilizes water-in-oil emulsions before electrostatic separation — and it is also the variable most frequently adjusted reactively rather than proactively. Crude blend changes, seasonal temperature swings, and slop reprocessing operations all alter the emulsification tendency of the feed without triggering an automatic chemical requalification. iFactory correlates demulsifier injection rate against emulsion band response and desalted crude BS&W to quantify chemical effectiveness per barrel — flagging cases where increasing dose is not producing the expected band response, which indicates a chemistry mismatch rather than a dose insufficiency.
04
Wash Water Rate, Quality, and pH
Wash water dilutes the salt concentration in the aqueous phase and provides the medium for salt extraction — but its quality is equally important as its volume. Overhead sour water recycled to the desalter wash water system can carry clay fines that actively stabilize the emulsion. Low pH wash water accelerates corrosion of internal grid components. iFactory monitors wash water injection rate against interface level response and correlates wash water pH and source against emulsion band growth events — identifying wash water quality issues that are invisible when only monitoring the desalted crude salt number. Book a Demo to review the wash water quality tracking module.
05
Electrostatic Grid Voltage and Current
The electrostatic grid applies a high-voltage field that promotes water droplet coalescence and sedimentation — and its operating condition is a sensitive indicator of the emulsion quality between the electrodes. A rising grid current at constant voltage indicates increasing conductivity in the oil phase — either from water entrainment, elevated BS&W, or electrolyte contamination. Grid trips are lagging failure events: iFactory monitors current trend, voltage stability, and the rate of change of these parameters to identify deteriorating emulsion quality in the vessel before the protective relay trips the grid and forces a manual recovery sequence.
iFactory AI Desalter Monitoring: From Isolated Data to Integrated CDU Intelligence
Connecting the Desalter to the Preheat Train, Overhead System, and Downstream Units
The fundamental limitation of conventional desalter monitoring is that process data, chemical injection records, crude assay information, and downstream quality measurements live in separate systems — reviewed by separate teams on separate schedules. iFactory's CDU analytics platform integrates all of these data streams into a single continuous monitoring environment, enabling the correlations that manual review cannot produce consistently. Book a Demo to walk through the integration architecture with our refinery process team.
iFactory CDU Desalter — Integrated Monitoring Framework
Crude Blend Change Detection
Crude assay data ingested from LIMS. API gravity, viscosity, salt content, and asphaltene index changes trigger automatic adjustment of emulsion risk model and demulsifier dose advisory.
Desalter Process Monitoring
Mixing valve dP, emulsion band level, grid voltage/current, brine flow, and temperature tracked at 1-minute resolution. Deviations from setpoint windows generate real-time operator alerts.
Preheat Fouling Correlation
Desalted crude BS&W and salt values correlated against preheat exchanger duty trends. Rising fouling resistance detected within hours of a desalter upset — not weeks later during a performance review.
Overhead Chloride Tracking
CDU overhead chloride trends linked back to desalter salt removal performance and caustic injection records — identifying whether chloride exceedances are desalter-driven or caustic program-driven, with the correct corrective action for each scenario.
Catalyst Risk Flagging
Sustained desalted crude salt events automatically flagged to downstream unit operators when cumulative sodium exposure approaches catalyst protection thresholds — enabling proactive feed rate adjustments before activity decline becomes measurable.
Diagnosing Emulsion Stability: Four Root Cause Categories and How to Separate Them
Why the Correct Diagnosis Determines the Correct Corrective Action
The most common error in desalter troubleshooting is treating all emulsion band growth events as a demulsifier dose problem — and increasing injection rate as the default response. In a significant proportion of emulsion upset events, increasing demulsifier does not resolve the emulsion because the stabilizing mechanism is not surfactant-driven. Understanding the four root cause categories is the prerequisite to selecting the correct intervention.
Category 1
Asphaltene-Stabilized Emulsions
Caused by crude incompatibility when blending paraffinic and naphthenic crudes, or by asphaltene precipitation driven by temperature drops. Characteristic signature: black or dark brown rag layer, emulsion resistant to increased demulsifier dose, growing band despite stable dP. Correct intervention: crude stabilizer agent dosed independently of emulsion breaker, or modification of blend ratio to reduce incompatibility potential.
Category 2
Solids-Stabilized Emulsions
Fine solids — clay particles, iron sulfide, mill scale, or sand — adsorb at the oil-water interface and physically armor the droplets against coalescence. Often introduced through wash water quality degradation (recycle water carrying clay fines) or crude production upsets delivering high-solids crude. Requires solids wetting agent chemistry, not additional emulsion breaker, and wash water source investigation.
Category 3
Over-Shearing from Excessive Mixing Valve dP
Mixing valve dP above 1.5 bar generates droplet sizes too fine for electrostatic coalescence, producing a mechanically stabilized emulsion regardless of chemical treatment. Common after valve position drift, throughput increase, or viscosity reduction from light crude switching. Reducing the dP to the 0.5–1.0 bar window is the primary intervention — chemical increases will not resolve this category.
Category 4
Demulsifier Chemistry Mismatch
True demulsifier under-performance occurs when the crude blend has changed sufficiently that the qualified chemistry is no longer effective for the dominant emulsifying agents present — typically after a major crude slate change or the introduction of opportunity crudes. Signature: stable emulsion band with dose increases producing no response. Requires portable electric desalter (PED) testing and chemical requalification, not dose escalation.
"We had been running overhead chlorides at 45–60 ppm for two quarters and treating it entirely as a caustic injection problem. When iFactory connected our desalter dP trending with the crude blend data, the first finding was that our mix valve position had drifted to produce a dP of 1.8 bar every time we switched to a heavier opportunity crude — well above the optimal range for that crude's viscosity. The result was a tight, mechanically stabilized emulsion that no amount of demulsifier could resolve, and the salt was passing straight through to the overhead. We corrected the valve response curve for that crude in our control system during one weekend shift. Overhead chlorides dropped from 58 ppm to 19 ppm in four days. The caustic consumption savings alone paid for the platform subscription in six weeks."
Process Engineer — Crude Distillation UnitMid-Continent Refinery, U.S.A.
Conclusion: The Desalter Is a Refinery-Wide Risk Asset, Not a Crude Unit Utility
The desalter's position at the front end of the refinery process train means that its performance — or its failure — propagates through every unit downstream. Preheat train fouling, CDU overhead corrosion, and FCC catalyst deactivation are not isolated maintenance events. In the majority of cases, they are delayed consequences of desalter upsets that were neither detected in real time nor connected to the downstream damage they caused. The operational intelligence to manage the desalter at the level of resolution its criticality demands has always been available in the data — it simply was not being collected, integrated, and analyzed at the speed and granularity that AI-powered monitoring enables.
iFactory AI's CDU desalter analytics platform provides continuous, automated monitoring of all five diagnostic performance variables — mixing valve dP, emulsion band position, demulsifier effectiveness, wash water quality, and grid health — correlated against preheat performance, overhead chemistry, and downstream catalyst protection thresholds in a single integrated environment. The result is a desalter operation that runs at its performance entitlement, maintains preheat train cleanliness, protects downstream catalysts, and generates the documented performance record that modern refinery reliability and environmental compliance programs require.
CDU DESALTER PERFORMANCE
Get a Desalter Performance Assessment for Your CDU
Our refinery process team will review your current desalter monitoring configuration, identify the data integration gaps between your desalter and downstream units, and deliver a structured analysis showing where real-time analytics can recover performance and protect catalyst investment.
What is the optimal mixing valve dP range and why does it matter so much?
The optimal dP window is 0.5–1.0 bar — sufficient to disperse wash water into the crude for salt extraction, but low enough to avoid over-shearing that creates an emulsion too fine for the electrostatic field to coalesce. It is the single most influential control variable in desalter salt removal efficiency.
How does iFactory detect emulsion band growth before it trips the electrostatic grid?
iFactory tracks interface level transmitter readings continuously, trending band thickness against crude blend changes and demulsifier dose — issuing an alert when growth rate exceeds a configurable threshold, typically 4–6 hours before the band would reach grid elevation.
Can iFactory distinguish between a demulsifier chemistry mismatch and a simple under-dosing situation?
Yes — by correlating emulsion band response to incremental dose adjustments over time, iFactory identifies cases where dose increases produce no band reduction, flagging a chemistry mismatch that requires requalification rather than continued escalation.
How does poor desalter performance lead to catalyst poisoning in downstream FCC or hydrotreater units?
When desalted crude salt exceeds 1 PTB consistently, sodium compounds accumulate in FCC catalyst and hydrotreater beds — deactivating active sites over weeks of exposure, with the economic impact appearing as declining conversion efficiency and premature catalyst reload requirements.
What data sources does iFactory require to deploy CDU desalter analytics?
iFactory connects to the CDU's Level 2 historian (DCS tag data), LIMS for crude assay and desalted crude quality, and chemical injection system records — integration typically completed within one to two weeks without process disruption.