A stuck control valve rarely announces itself directly — instead, the loop it belongs to starts oscillating, the process variable drifts slightly out of its usual band, or a transmitter quietly reports a reading that has crept a fraction of a percent off true without anyone noticing until a batch or a safety trip forces the question. Field instruments are simultaneously the most numerous assets in a process plant and among the least visible in a typical reliability program, because a single failing transmitter or a valve with developing stiction rarely shuts a unit down by itself — it just makes the control loop it sits in slightly worse, day after day, until the cumulative effect becomes a quality deviation, an efficiency loss, or in the worst case a safety event. This article covers what actually drives instrument unreliability across control valves and transmitters, and how a structured instrument reliability program catches it before it costs you.
Why Instrument Problems Rarely Look Like Instrument Problems
A control valve with developing stiction does not fail — it just responds late and inconsistently, which shows up as loop oscillation that operators often tune around rather than trace back to the valve itself. A transmitter drifting slowly out of calibration does not stop reporting a value — it reports a wrong one, confidently, until a periodic calibration check or a process upset exposes the gap. This is precisely what makes instrument reliability different from mechanical equipment reliability: the failure mode is degraded performance disguised as a control or process problem, not an obvious stoppage, which means it can run undetected for months while quietly costing efficiency, product quality, and in safety-critical loops, protection margin. The four signals below are the ones a reliability program should actively watch for, precisely because they rarely get traced back to their root instrument cause without someone specifically looking.
Loop Oscillation
A control loop that cycles rather than settles is a classic signature of valve stiction, but is frequently misdiagnosed as a tuning problem and adjusted around rather than traced to the valve.
Slow Process Drift
A process variable that drifts gradually away from setpoint over weeks, with no obvious operational cause, often traces back to a transmitter that has quietly drifted out of calibrated range.
Increased Manual Intervention
Operators making more frequent manual adjustments to hold a loop steady is often a sign the automatic control element — valve or transmitter — is no longer performing to its original specification.
Calibration Records Going Stale
Instruments whose calibration interval has quietly extended past schedule, often because a paper-based tracking system missed the due date, are running on unverified assumptions about their own accuracy.
Stiction, Hysteresis, and What Valve Signature Data Actually Shows
Control valve stiction is one of the most common and most underdiagnosed causes of poor loop performance in a process plant. Stiction causes the measurable process variable to remain unchanged while the controller output continues increasing in an attempt to move it, and when the valve finally does respond, it often jumps well past where a healthy valve would have settled — a pattern that shows up clearly in valve signature data but is easy to miss without dedicated diagnostics. On HART-enabled digital positioners, a valve signature plotting stem force against travel position reveals stiction, hysteresis, and dead band directly, turning what used to be a subjective judgment call into a measurable, trackable value over time.
Baseline Signature Capture
A valve signature is captured at commissioning or after overhaul, establishing the healthy stem-force-versus-travel curve every future test will be compared against.
HART Step Testing
A HART communicator simulates travel position in defined steps, confirming the valve reaches each commanded position accurately and consistently across the full stroke.
Seat Leakage & Packing Checks
Downstream leakage is measured against established acceptance classes, and packing condition is inspected on the schedule that governs seal integrity and fugitive emissions risk.
Trend Comparison & Work Order
Current signature data is compared against baseline and the last test cycle, generating a maintenance work order automatically when stiction or hysteresis exceeds the acceptable range.
Why Every Instrument Drifts, and Why HART Alone Doesn't Fix It
Every transmitter drifts over time, regardless of how sophisticated its internal electronics are — exposure to temperature, humidity, vibration, and general field environmental conditions gradually shifts sensor performance away from its original calibrated state. A common misconception is that re-ranging a smart transmitter with a HART communicator counts as calibration; it does not. Genuine calibration requires a precision reference standard traceable to national measurement standards, applied on a schedule short enough to catch drift before it moves the instrument out of tolerance, but long enough to avoid the unnecessary labor cost of constant recalibration on instruments that are still performing well. Getting that interval right for each instrument, rather than applying one blanket schedule across every device regardless of its actual drift history, is where most of the practical value in a calibration program actually lives.
Reference-Based Calibration
A traceable precision calibrator applies a known physical input and compares it against the transmitter's reported output, catching drift a HART communicator alone cannot detect.
Interval Optimization
Calibration frequency is set per instrument based on historical drift rate and criticality, rather than a single blanket schedule that over-tests stable instruments and under-tests volatile ones.
HART & Fieldbus Diagnostics
Digital protocols carry predictive maintenance data beyond the basic process variable — device health, configuration status, and diagnostic flags a legacy 4-20mA loop cannot report.
End-to-End Loop Verification
Loop checks confirm the signal path from sensor through wiring to the control system display matches, catching cable resistance changes and ground loop issues independent of the transmitter itself.
What 4-20mA, HART, and Fieldbus Actually Tell You
The signal protocol an instrument communicates over directly determines how much diagnostic visibility a reliability program can extract from it without additional dedicated testing equipment. Plants running a mix of legacy and modern instrumentation need to know exactly what each protocol can and cannot report before assuming a problem would show up automatically.
| Signal Type | Process Variable Bandwidth | Diagnostic Capability |
|---|---|---|
| 4-20mA (legacy analog) | One process variable per loop | None — a stuck transmitter cannot report its own failure |
| HART (digital overlay) | Primary variable plus limited secondary data | Basic diagnostics, valve signature, configuration status |
| Foundation Fieldbus / PROFIBUS PA | Multiple variables per segment | Full predictive data — stiction, sensor drift, actuator health |
Where Instrument Reliability Becomes a Safety Requirement, Not Just an Efficiency One
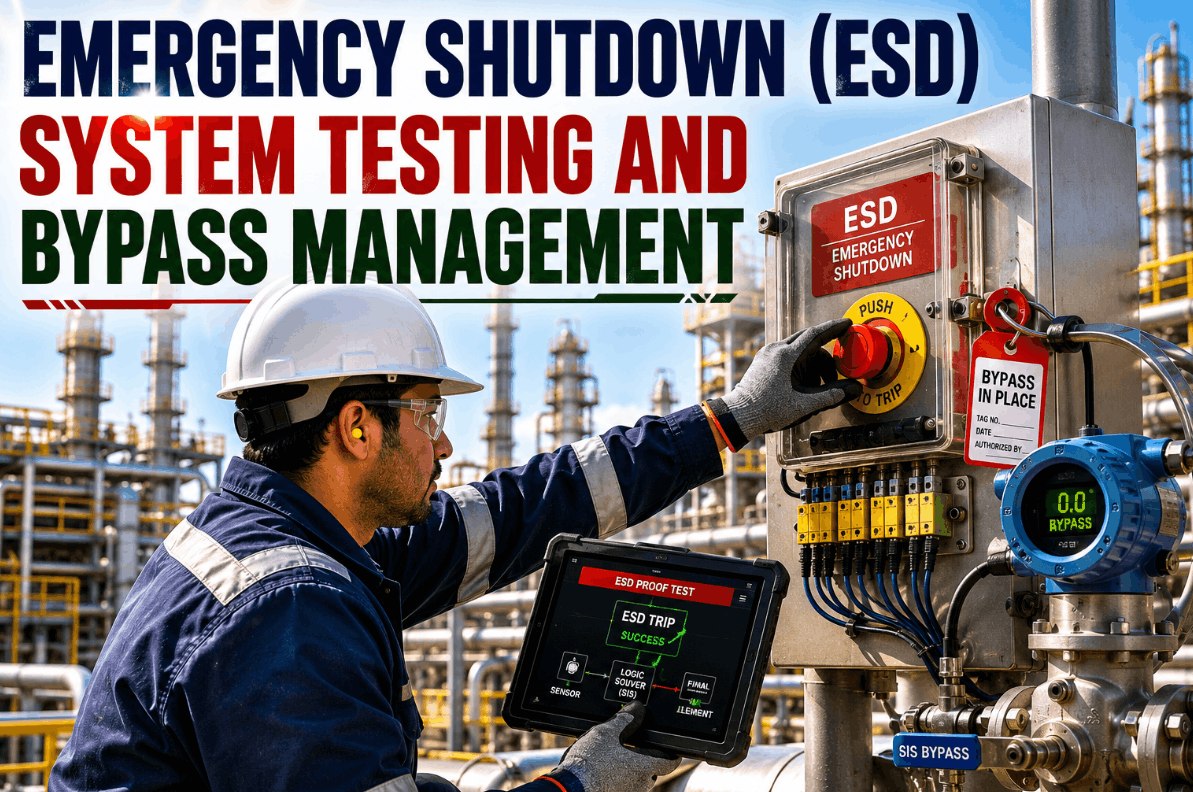
Instruments that form part of a Safety Instrumented System carry a different reliability burden entirely, because their entire purpose is to detect an unsafe condition and act correctly the one time it actually matters — a transmitter or final control element that has silently drifted out of calibration in a safety loop is not an efficiency problem, it is a protection layer that may not function when called upon. Proof testing exists specifically to catch failures that online diagnostics cannot see, and the interval at which it must be performed is tied directly to the Safety Integrity Level the loop is designed to achieve, not to a generic maintenance calendar.
Scheduled Proof Testing
Every SIS component is functionally tested at intervals derived from its Safety Integrity Level requirement, confirming it responds correctly to a simulated hazardous condition.
End-to-End Loop Validation
Full Safety Instrumented Function loops are tested from sensor input through logic solver to final control element response, rather than component-by-component in isolation.
Documented Traceability
Test results, dates, and outcomes are retained for a minimum documented history per applicable standard, since regulators and insurers expect a defensible test record on demand.
Bypass & Deviation Tracking
Any authorized bypass of a safety function is logged with a defined maximum out-of-service duration, escalating to management authorization if that window is exceeded.
How iFactory Brings Instrument Reliability Into One System
Most plants already perform calibration and valve testing — the gap is rarely in the testing itself, it is in the tracking, scheduling, and trend analysis that turns individual test results into a genuine reliability program. iFactory's approach consolidates instrument asset records, calibration schedules, valve signature history, and SIS proof test documentation into a single system connected directly to maintenance work orders.
Instrument Asset Inventory
Every control valve, transmitter, and safety instrument on-site is cataloged with its calibration history, criticality, and applicable test standard.
Interval-Based Scheduling
Calibration and valve testing intervals are set per instrument based on historical drift rate and criticality, replacing blanket schedules with data-driven timing.
HART & Fieldbus Data Integration
Diagnostic data from digital instruments feeds directly into the asset record, surfacing drift and stiction trends without requiring a separate manual review process.
Automated Alerts & Work Orders
A calibration due date, a stiction threshold, or a missed proof test window generates a work order automatically rather than depending on someone noticing a spreadsheet entry.
What This Looks Like in Practice
A process plant running a mix of legacy 4-20mA transmitters and newer HART-enabled control valves had relied on a paper-based calibration tracking system, with technicians manually flagging due dates on a shared spreadsheet that was only as current as the last person who remembered to update it. After consolidating instrument records into a single system, the reliability team discovered several transmitters whose calibration had quietly extended months past their scheduled interval, along with a control valve on a critical feed loop that had been showing a persistent oscillation pattern operators had been retuning around for nearly a year rather than tracing back to developing stiction in the valve itself.
Once valve signature diagnostics confirmed the stiction and the valve was rebuilt during a planned maintenance window, the loop settled immediately without any further tuning changes, and the plant recovered a measurable efficiency loss that had been quietly accepted as normal process variation for months. The reliability team's broader takeaway was less about the individual valve and more about how much drift had been hiding in plain sight simply because no single system was tracking calibration due dates and diagnostic trends together in one place.
We had been retuning that loop for the better part of a year, treating it as a controller tuning issue. Once we finally pulled the valve signature data, the stiction was obvious — it had just never been anyone's job to look at that specific chart.
Frequently Asked Questions
Stop Letting Instrument Drift Hide Behind a Tuning Problem
iFactory connects control valve signature diagnostics, transmitter calibration schedules, and SIS proof test documentation into one system — turning quiet instrument degradation into a maintenance work order before it becomes a process deviation or a safety gap.