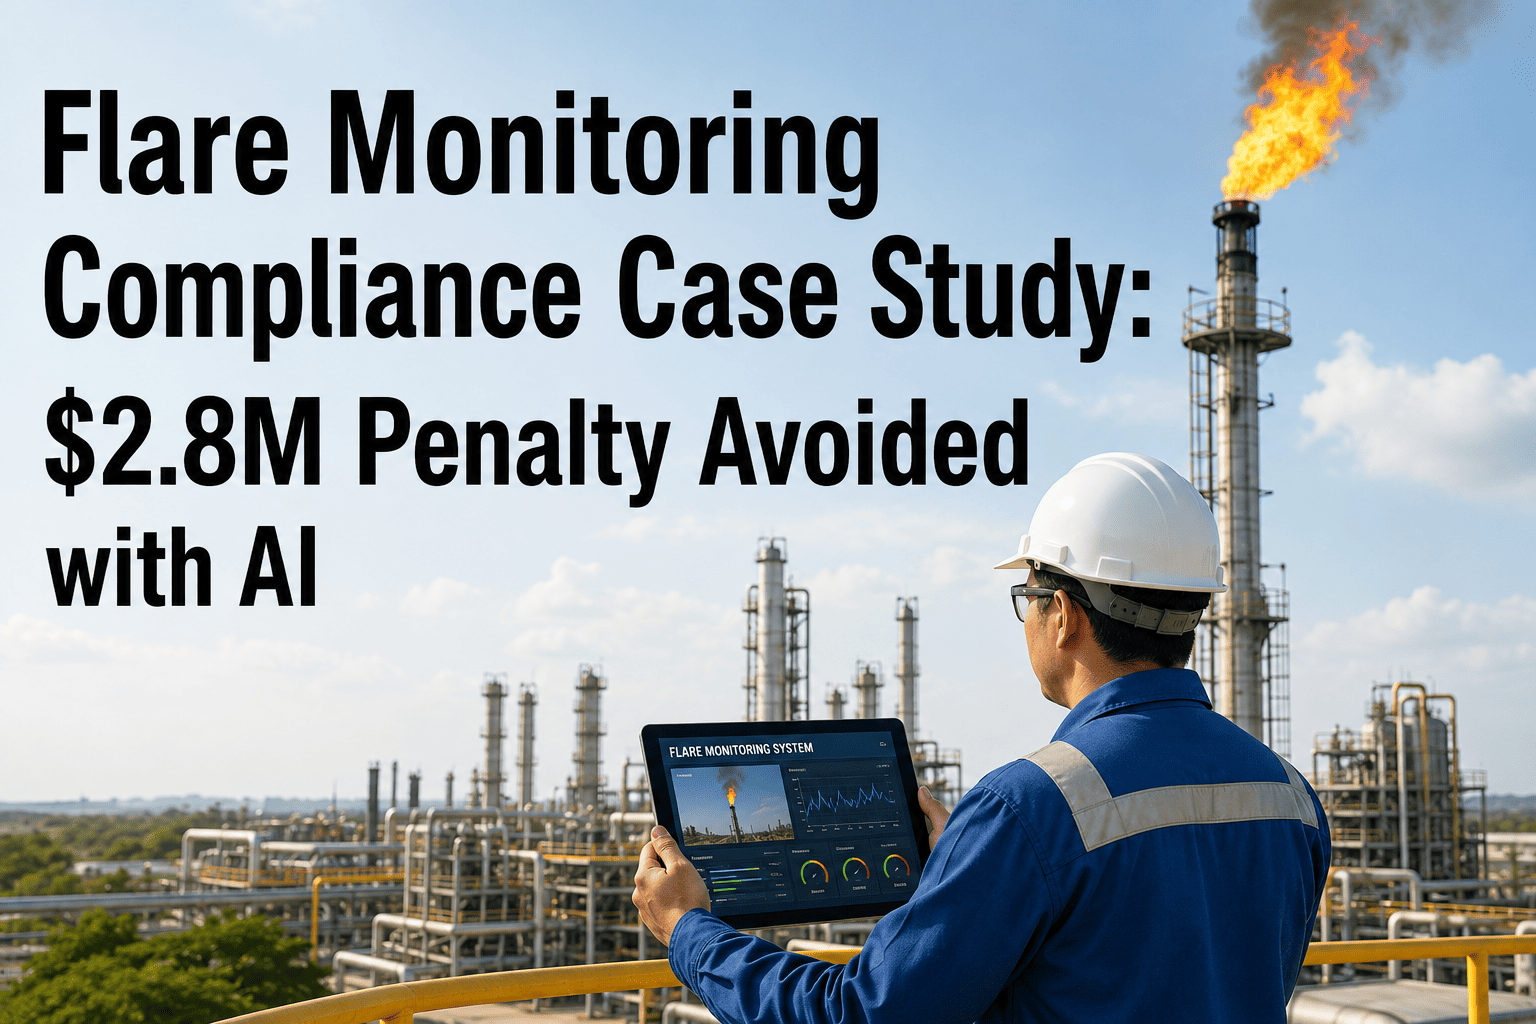
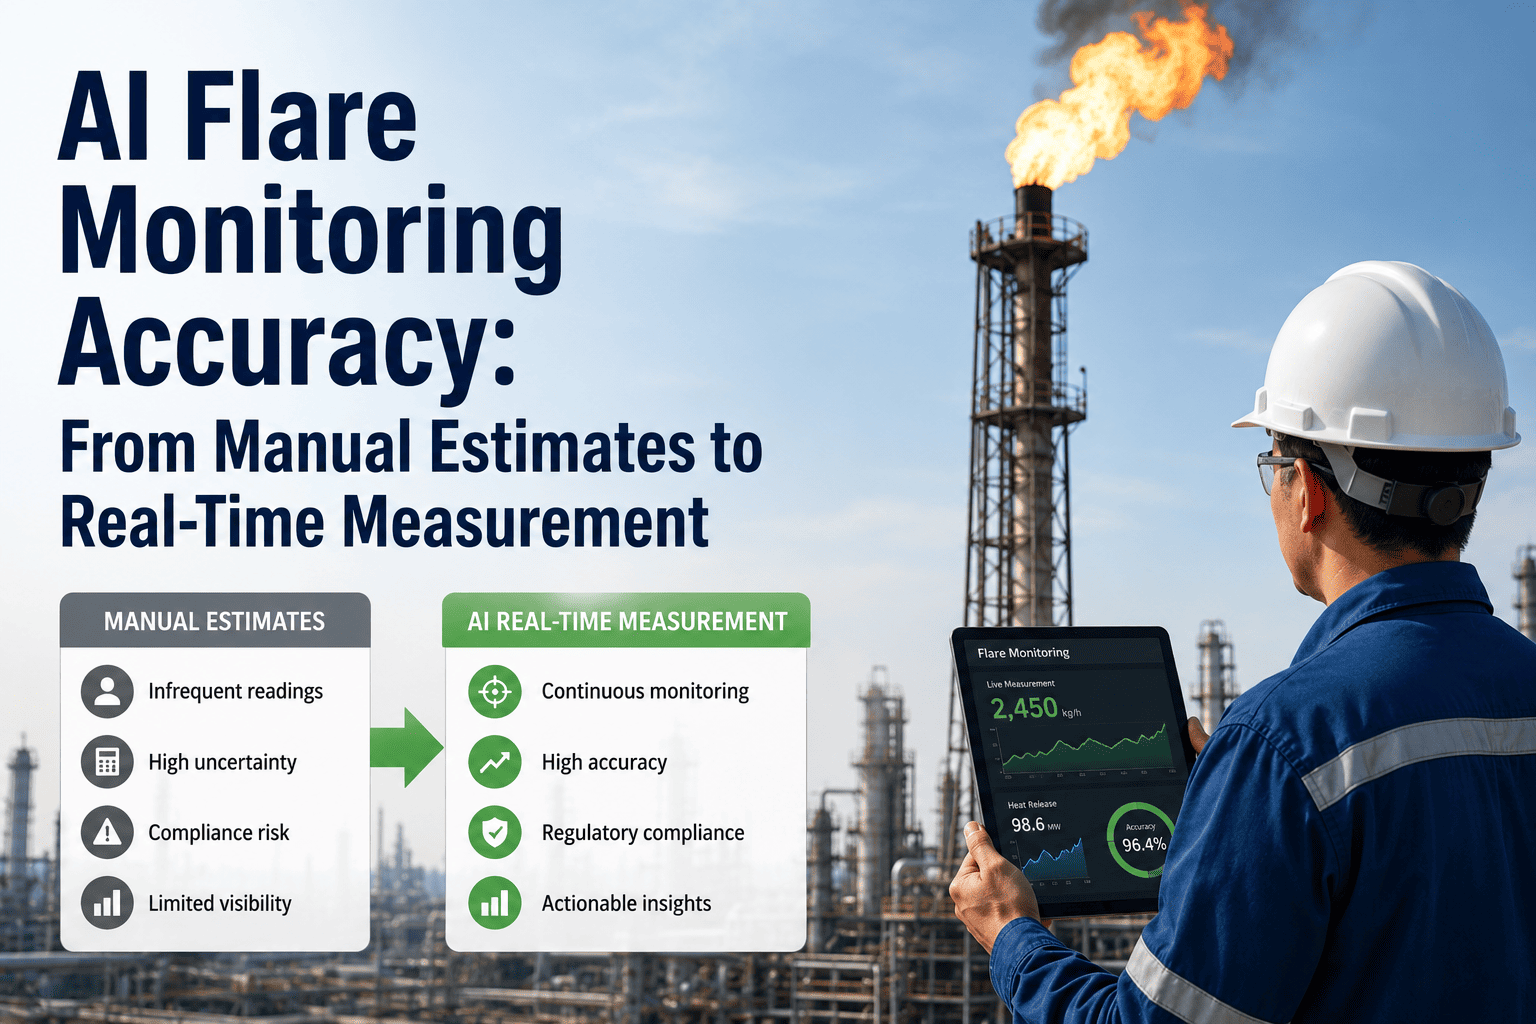
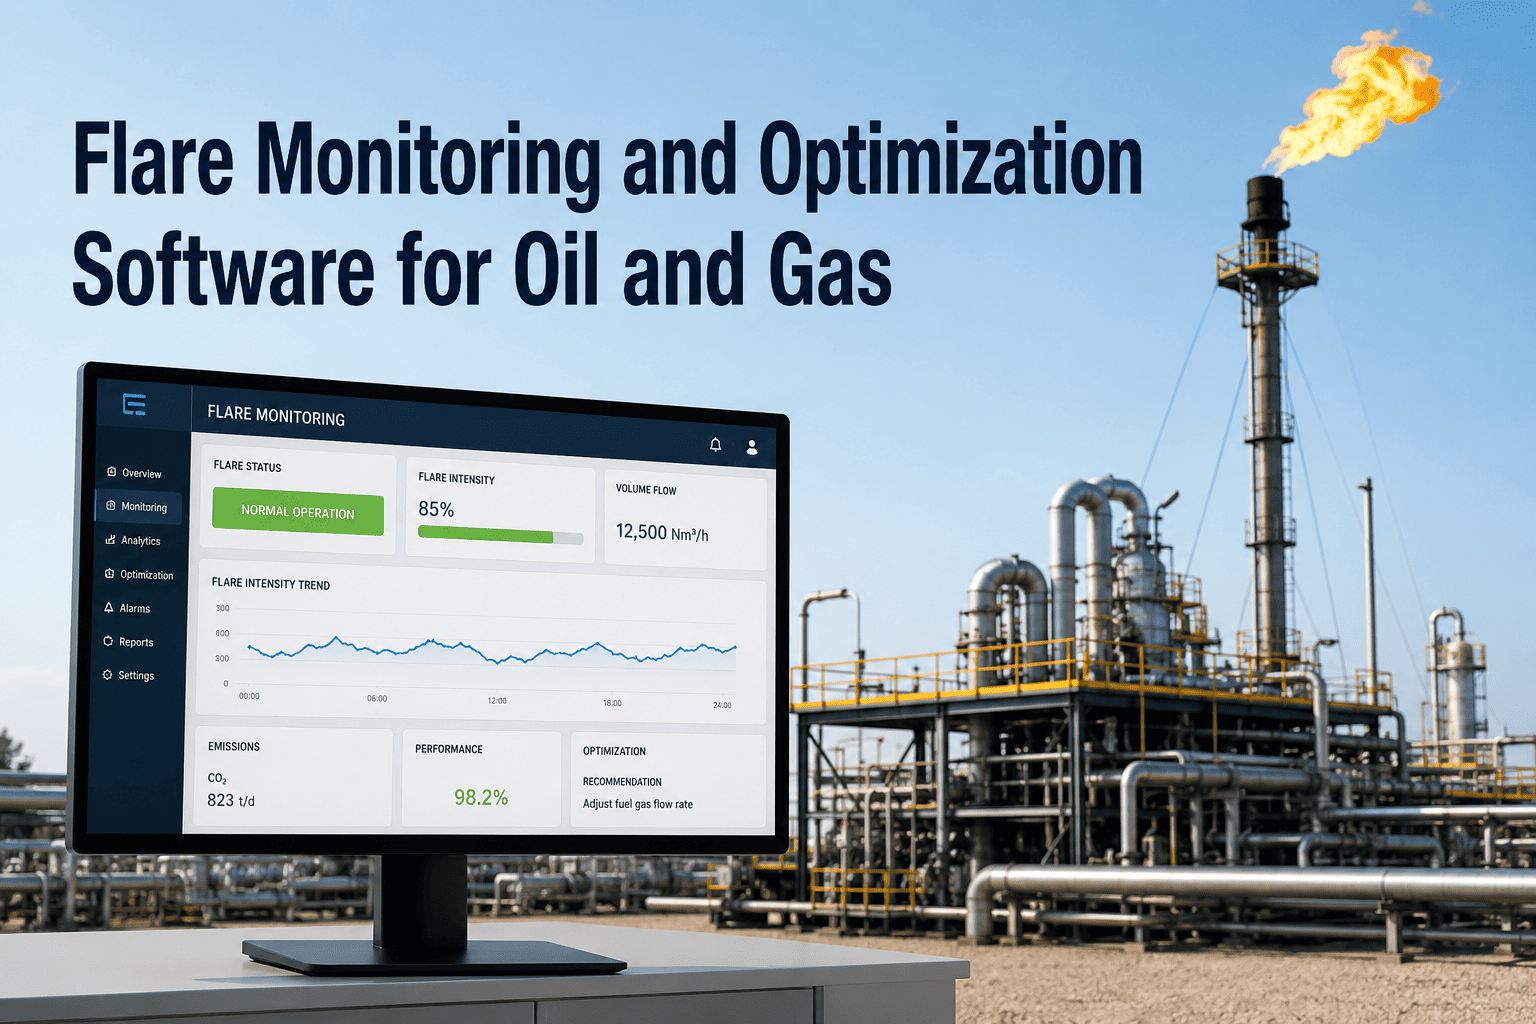
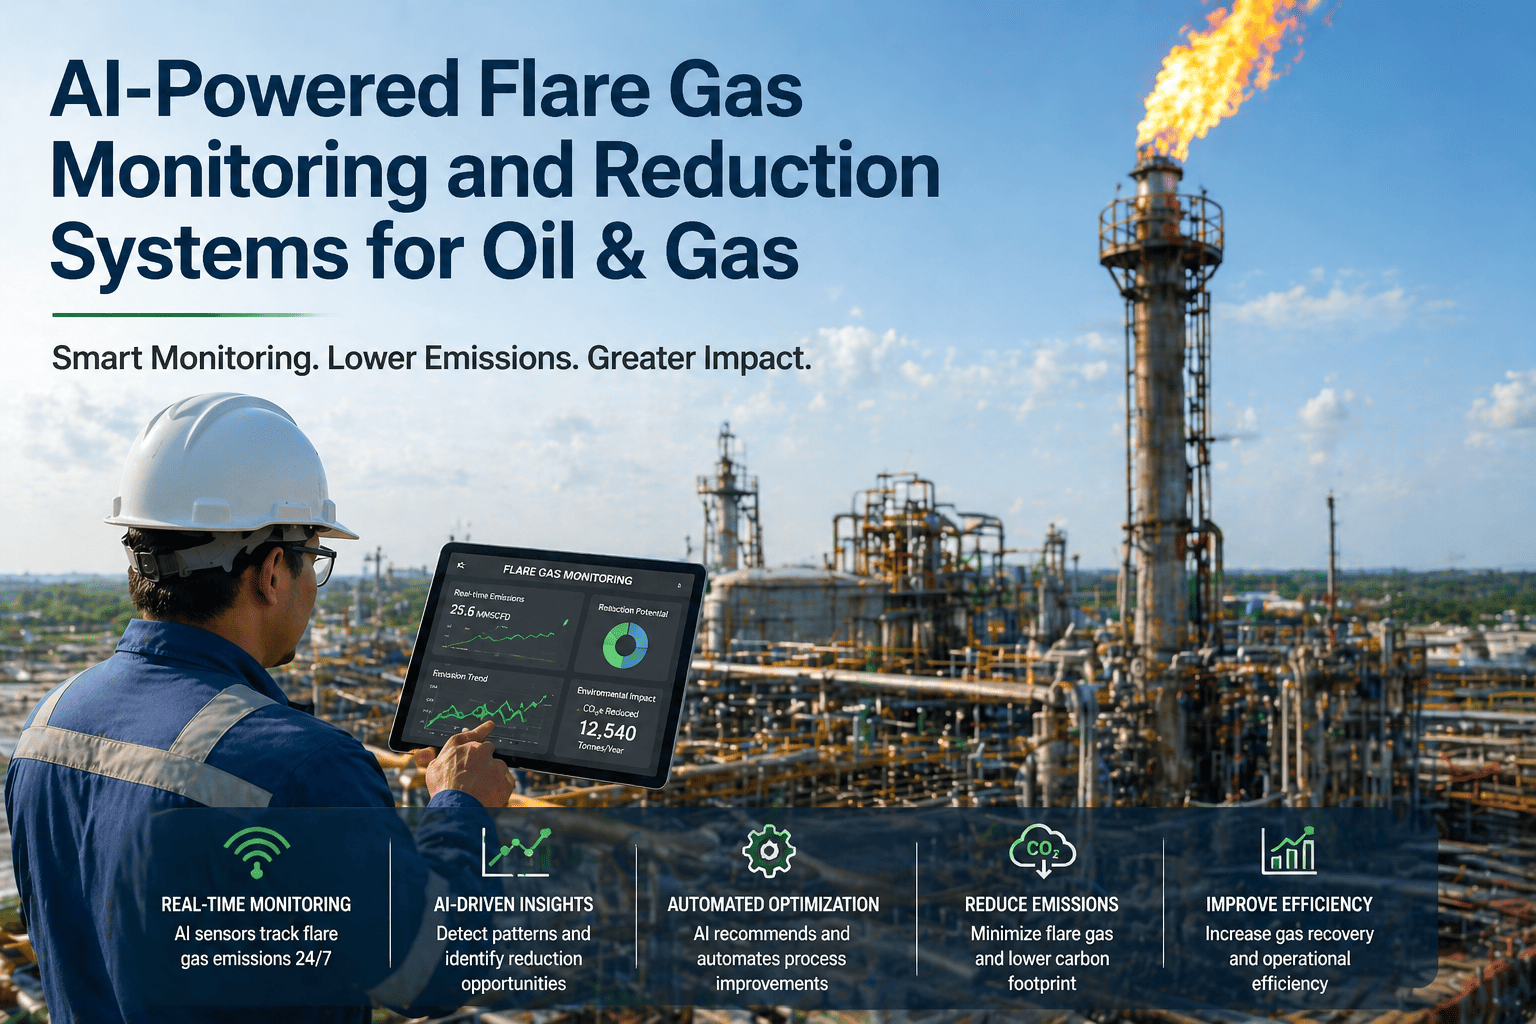
Flare systems are the last line of defense in any refinery, chemical plant, or upstream production facility, yet most operators still inspect their flare tip, pilot ignition, and knockout drum on a fixed calendar schedule rather than based on actual degradation data. A single undetected pilot flame failure during an emergency relief event can force unburned hydrocarbons straight into the atmosphere, triggering EPA violations, community complaints, and fines that start at six figures and climb fast. The gap between what flare systems demand and what most maintenance programs deliver is where predictive monitoring changes the outcome entirely. Book a demo to see how real-time flare system monitoring catches the failures that scheduled inspections miss.
Oil & Gas · Flare System Monitoring
Flare System Predictive Maintenance: Tip, Ignition, Knockout Drum & Gas Composition
How AI-driven monitoring of flare tip condition, pilot reliability, knockout drum levels, and gas composition prevents unplanned releases and keeps your facility compliant.
$117K
Average fine per flare compliance violation in the United States
23%
Of reported flare incidents traced to undetected pilot ignition failure
72 hrs
Median detection delay for knockout drum liquid carryover without continuous monitoring
Flare System Anatomy: Where Failures Actually Originate
Every flare system is a chain of interdependent components stretching from the process header to the flare tip. A failure at any single point can compromise the entire system's ability to safely dispose of relief gases. The visual below maps the critical monitoring points from bottom to top, showing exactly where predictive maintenance adds value at each stage.
01
Flare Tip & Steam Ring
Exposed to extreme thermal cycling and corrosive combustion gases. Erosion, warping, and carbon buildup degrade destruction efficiency over time.
High Risk
02
Pilot Ignition System
Flame arrestors clog, thermocouples degrade, and ignition electrodes foul. A pilot that appears healthy during a weekly check can fail silently within hours.
Critical Risk
03
Flare Gas Composition
Heating value fluctuations directly affect combustion quality. Low-BTU streams may not sustain stable combustion even with a healthy pilot and intact tip.
Medium Risk
04
Liquid Seal Drum
Seal water level must maintain a precise differential to prevent backflow of air into the flare header while allowing relief gas to pass through safely.
High Risk
05
Knockout Drum
Removes liquid from relief gas before it reaches the flare. High liquid levels or internal fouling allow carryover that can extinguish the flare flame or cause mechanical damage.
Critical Risk
06
Flare Header & Valves
Relief valves, control valves, and header piping must remain clear of blockages. Corrosion and polymer buildup restrict flow capacity when relief events demand maximum throughput.
Medium Risk
Failure Mode Risk Matrix: What Breaks and What It Costs
Not all flare system failures carry the same consequence. The matrix below ranks the most common failure modes by frequency and severity, helping maintenance teams prioritize monitoring investment where the risk exposure is greatest.
Failure Mode
Frequency
Severity
Detection Method
Pilot flame extinction
High
Critical
Continuous UV/IR flame scanner
Knockout drum liquid carryover
Medium
Critical
Level transmitter + differential pressure
Flare tip erosion or warping
Low
High
Thermal imaging + acoustic monitoring
Seal drum water level drift
High
High
Continuous level monitoring with alerts
Flame arrestor plugging
Medium
Medium
Differential pressure across arrestor
Low-BTU gas combustion failure
Medium
Medium
Online gas composition analyzer
Four Critical Monitoring Targets Explained
Predictive maintenance for flare systems is not a single technology. It requires four distinct monitoring capabilities working together, each addressing a different failure mode with different sensor types, data frequencies, and alert thresholds.
TIP
Flare Tip Condition Monitoring
Thermal cameras and acoustic sensors track tip temperature distribution and combustion noise patterns over time. Deviations from the baseline thermal profile indicate erosion, carbon buildup, or steam ring misalignment that degrades destruction efficiency. Without continuous monitoring, tip degradation is only discovered during a shutdown inspection, often after months of suboptimal combustion.
IGN
Pilot Ignition Reliability
UV and IR flame scanners provide continuous confirmation of pilot flame presence. The critical insight is not just whether the pilot is lit right now, but whether its signal strength and response time are trending toward failure. A pilot with degrading thermocouple response may pass a weekly visual check but fail to confirm ignition fast enough during an emergency relief event.
KOD
Knockout Drum Level & Fouling
Continuous level measurement with high and high-high alarm thresholds prevents liquid carryover into the flare header. Advanced monitoring adds differential pressure across the drum internals to detect fouling and reduced separation efficiency before it impacts performance. Manual level checks, even at frequent intervals, cannot catch rapid level surges caused by sudden process upsets.
GAS
Flare Gas Composition Analytics
Online analyzers measure heating value, hydrocarbon composition, and inert gas content in real time. When the heating value drops below the flammability threshold, the system alerts operators to supplement with assist gas before combustion quality degrades. This prevents the common scenario where a low-BTU relief stream produces visible smoke and incomplete combustion that triggers environmental complaints.
From Sensor Signal to Predictive Insight
Raw sensor data from flare systems is voluminous but meaningless without the analytical layers that turn it into actionable maintenance intelligence. The data flow below shows how signals from the field become predictions that drive maintenance decisions before failures occur.
Action
Work order generated, assist gas activated, inspection scheduled, compliance report filed
Prediction
Remaining useful life estimate for flare tip, pilot failure probability within next 7 days, knockout drum fouling trend
Analysis
Pattern recognition across thermal profiles, combustion noise baselines, level trend deviation, gas composition drift detection
Aggregation
Time-series normalization, sensor fusion from UV/IR/thermal/DP/level analyzers, data quality validation
Collection
Flame scanner signals, thermal camera feeds, level transmitters, DP cells, gas chromatograph data, weather station inputs
Regulatory Compliance: What Monitors Must Prove
Flare compliance is no longer about filling out a quarterly report from memory. EPA 40 CFR 60.18, state-level flare rules from TCEQ and others, and ESG reporting frameworks all require continuous, auditable evidence that flare systems operated within permitted parameters. The compliance map below shows what regulators actually ask for and which monitoring capabilities provide the evidence.
Destruction Efficiency
98% minimum
EPA 40 CFR 60.18
Continuous heating value monitoring + thermal tip profiling to prove combustion temperature exceeds requirements
Pilot Flame Status
Always verified
State permits, RMP
Continuous UV/IR scanner log with timestamped flame confirmation for every minute of operation
Smokeless Operation
Visible opacity limit
Local air quality rules
Steam-to-gas ratio optimization using real-time flow measurement and composition data to prevent smoking
Unburned Hydrocarbon Release
Zero tolerance
EPA, ESG frameworks
Integrated pilot + tip + gas monitoring that confirms complete combustion during every relief event
Documented Outcomes From Predictive Flare Monitoring
The financial case for predictive flare monitoring extends well beyond avoided fines. Reduced unplanned shutdowns, lower assist gas consumption, and deferred tip replacement all contribute to measurable ROI within the first year of deployment.
Zero
Flare-related compliance violations in 18 months after deploying continuous pilot monitoring at a Gulf Coast refinery
34%
Reduction in assist gas consumption achieved through optimized steam-to-gas ratio control driven by real-time composition data
$420K
Saved by deferring a scheduled flare tip replacement after predictive thermal monitoring proved the tip had 14 months of remaining life
6 hrs
Average advance warning for knockout drum level excursions, compared to zero warning with manual level checks every 4 hours
Your flare system is running right now, and you probably cannot prove it is running correctly. Weekly pilot checks and annual tip inspections were designed for an era before continuous monitoring existed. Regulators, communities, and your own insurance underwriters have moved past that standard. The question is whether your maintenance program has.
Expert Insight
I have investigated more than thirty flare incidents across refineries and gas plants, and the pattern is almost always the same. The pilot flame scanner showed a valid signal during the last scheduled check. Between that check and the relief event, something degraded silently. A thermocouple drifted, a flame arrestor partially plugged, or the gas composition shifted enough that the pilot could not sustain ignition when the main flow hit. In every single case, continuous monitoring would have caught the degradation trend hours or days before it became a failure. The technology is not experimental. What is irresponsible is relying on a weekly visual check for a system that can cause a six-figure environmental violation in thirty seconds of undetected pilot loss.
Karen Whitfield — Process Safety Consultant, 26 years in refinery flare system design, incident investigation, and EPA compliance auditing, former CCPS committee member
Scheduled Inspection vs. Predictive Monitoring
The comparison below exposes why calendar-based flare maintenance cannot match the reliability and compliance coverage that continuous predictive monitoring delivers.
| Monitoring Aspect |
Scheduled Inspection |
Predictive Monitoring |
Risk Reduction |
| Pilot flame verification |
Weekly visual check from grade level |
Continuous UV/IR scanner with trend analysis |
Detects degradation 48 to 72 hours before failure |
| Flare tip condition |
Annual shutdown inspection with borescope |
Continuous thermal imaging with baseline comparison |
Tracks erosion progression in real time between turnarounds |
| Knockout drum level |
Manual gauge reading every 4 to 8 hours |
Continuous level transmitter with high-high alarm |
Catches rapid level surges from process upsets instantly |
| Gas composition |
Periodic grab sample, lab analysis 24 hours later |
Online analyzer with real-time heating value output |
Enables immediate assist gas adjustment before smoking occurs |
| Compliance evidence |
Assembled from logs during audit preparation |
Continuous timestamped data stream with automated reporting |
Audit-ready at all times, no manual reconstruction needed |
Frequently Asked Questions
What sensors are required for basic flare system predictive monitoring?
The minimum viable sensor set includes a UV or IR flame scanner on each pilot, a continuous level transmitter on the knockout drum, a differential pressure transmitter across the liquid seal drum, and either a thermal camera or pyrometer aimed at the flare tip. For full predictive capability, add an online gas composition analyzer on the flare header and a differential pressure sensor across any flame arrestors. Most of these instruments are already installed on well-maintained flare systems. The gap is usually not in the sensors but in connecting their output to a system that analyzes trends and generates alerts.
Book a demo to see how existing field instruments feed a predictive monitoring platform.
How does predictive monitoring actually prevent a flare compliance violation?
Compliance violations typically occur in two scenarios: an unburned release caused by pilot failure, or visible smoking caused by insufficient combustion energy. Predictive monitoring addresses both by tracking the conditions that lead to these events before they happen. If pilot scanner signal strength is trending downward, the system generates a work order to inspect and clean the pilot before it fails completely. If gas heating value drops below the threshold needed for smokeless combustion, the system alerts operators to increase assist gas flow immediately. In both cases, the violation never occurs because the degraded condition was detected and corrected during the warning window.
Contact support to learn more about compliance alert configuration.
Can flare tip monitoring really defer a tip replacement safely?
Yes, when thermal monitoring establishes a clear degradation trend with a quantified remaining useful life estimate. Most refineries replace flare tips on a fixed cycle, typically every 5 to 7 years, regardless of actual condition. Predictive thermal profiling compares the current tip temperature distribution against the original design profile and against its own historical trend. If the erosion rate is slower than assumed, the replacement can be safely deferred without any reduction in destruction efficiency. Documented cases show deferrals of 12 to 18 months, saving hundreds of thousands in shutdown costs and replacement fabrication.
Book a demo to see thermal tip profiling in action.
Does predictive flare monitoring integrate with our existing DCS or SCADA system?
Yes. Predictive monitoring platforms consume data from your existing DCS or SCADA through standard industrial protocols and do not replace the control system's role. The DCS continues to handle real-time process control including assist gas valves, steam controls, and relief valve monitoring. The predictive platform sits alongside it, reading the same sensor signals, applying analytics and machine learning models, and feeding maintenance alerts and predictions back to operators through a separate interface or through integration points in the DCS. This means no control logic changes, no safety system modifications, and no disruption to existing operations during deployment.
Contact support to discuss integration with your control platform.
What is the typical payback period for flare predictive monitoring?
Most operators report full payback within 8 to 14 months, driven by a combination of avoided compliance fines, reduced assist gas consumption, and deferred tip replacements. The single largest ROI contributor varies by site. For facilities with recent compliance history, avoiding a single violation often pays for the entire monitoring system. For facilities with high assist gas costs, steam optimization alone can deliver six-figure annual savings. The fastest payback typically occurs at sites where all four monitoring targets, tip, ignition, knockout drum, and gas composition, are deployed simultaneously because the combined risk reduction and operational savings compound quickly.
Book a demo to model payback for your specific flare system configuration.
Your Flare System Is Running Right Now — Can You Prove It Is Running Correctly?
Continuous predictive monitoring for flare tip condition, pilot ignition reliability, knockout drum levels, and gas composition — with compliance evidence that is always audit-ready.