AI mooring system monitoring for FPSOs has moved from experimental to operational-critical in less than a decade. Floating Production Storage and Offloading vessels carry some of the most financially consequential mooring systems in the offshore industry — a single line failure on a deep-water FPSO in the Gulf of Mexico or off the coast of Brazil can trigger emergency disconnection, lost production measured in millions per day and regulatory shutdown exposure that stretches for months. Traditional inspection programs — ROV surveys on 12- or 24-month cycles, manual tension log reviews, and reactive fatigue-life calculations — were designed for an era when continuous monitoring was technically impossible. That era is over. This article explains how AI mooring system monitoring FPSO platforms work and what they track across chain, wire, and polyester line systems, how they integrate with FPSO digital operations, and why the ROI case is no longer a matter of debate among deepwater operators.
AI-Driven Analytics · FPSO Offshore Operations
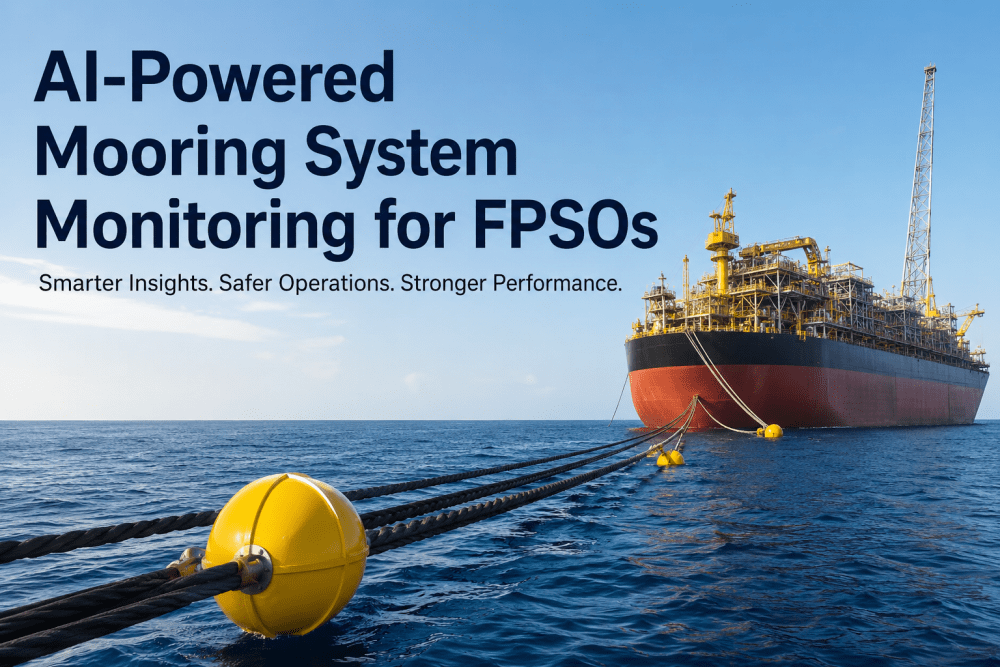
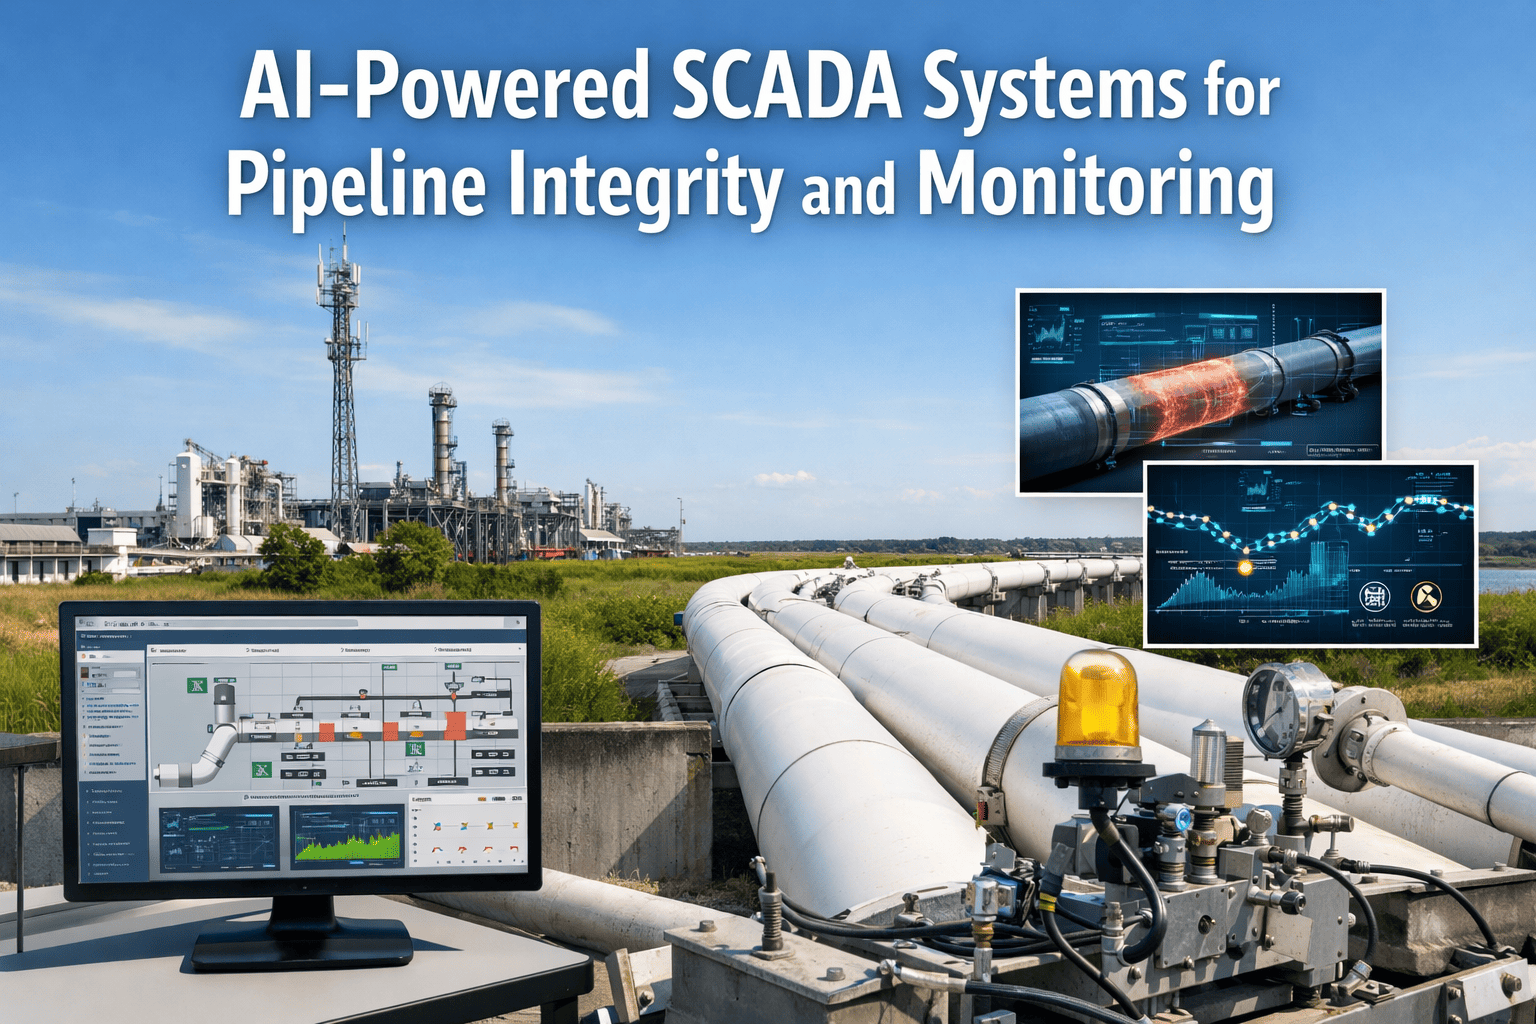
AI-Powered Mooring System Monitoring for FPSOs
Continuous tension monitoring, fatigue life prediction, and integrity analytics — unified in a single AI platform that tracks every mooring line's health and compliance status in real time.
Daily production loss risk from a single mooring failure event
70%
Of mooring failures are detectable weeks before failure via sensor data
4 Line Types
Chain · Wire · Polyester · Hybrid systems
Real-Time
Fatigue accumulation and tension anomaly alerting
Sources: ABS · DNV GL · BSEE · IMCA M 202 · U.S. Bureau of Safety and Environmental Enforcement · iFactory Deployment Data 2025
Why Mooring Failures Are Among the Most Costly Events in Offshore Oil & Gas
The offshore industry learned the cost of inadequate mooring monitoring the hard way. Between 2001 and 2020, the industry recorded more than 80 mooring line failures on production vessels globally — a rate that accelerated as aging FPSOs remained in service beyond their original design lives while operating in increasingly harsh metocean environments. The consequences of a mooring line failure are not linear. A single line failure redistributes load to adjacent lines, accelerating fatigue accumulation on the remaining system. A second line failure under redistributed load can trigger a cascading failure sequence that results in emergency disconnection, vessel drift, and, in the worst cases, loss of well control.
80+
Mooring line failures on production vessels 2001–2020
Industry data compiled by IMCA and DNV shows failure rates accelerating as the global FPSO fleet ages and metocean severity increases in deepwater frontiers.
IMCA M 202 / DNV GL
$2.5B
Estimated insured losses from mooring incidents over the same period
Lloyd's and offshore marine insurers have documented accelerating mooring-related claims, pushing hull and machinery premiums for aging FPSOs to record levels in multiple markets.
Lloyd's Market Association
40%
Of mooring failures initiated by corrosion or fatigue, both detectable by monitoring
ABS and Bureau Veritas failure mode analysis consistently shows corrosion-accelerated fatigue and inter-link wear as the primary mechanisms — both generate detectable signal before fracture.
ABS Offshore Guide
BSEE
Regulatory reporting requirements for U.S. OCS mooring incidents
The Bureau of Safety and Environmental Enforcement requires immediate notification for any mooring failure on U.S. Outer Continental Shelf facilities, with post-incident engineering review obligations.
30 CFR Part 250
What AI Monitoring Tracks — The 4 Mooring Line System Categories
FPSO mooring systems are not uniform. A typical deepwater taut-leg or semi-taut mooring system combines chain segments, wire rope sections, and polyester rope in configurations dictated by water depth, vessel class, and metocean design criteria. AI monitoring platforms must handle all line types and their distinct failure modes — a chain link worn by inter-link fretting behaves fundamentally differently from a polyester rope approaching fatigue life at its termination fitting. The following checklist maps what AI platforms monitor for each primary line category.
Asset Type 01
Studlink & Studless Chain
Corrosion rate monitoring via ultrasonic wall-thickness sensors
Inter-link wear and out-of-plane bending detection
Tension load history and peak-over-threshold event recording
Fatigue life accumulation against API RP 2SK T-N curves
ABS / DNV inspection interval compliance tracking
Asset Type 02
Steel Wire Rope
Magnetic flux leakage (MFL) broken wire strand detection
Dynamic tension measurement at fair-lead and anchor terminations
Bending stiffness change trending at termination sockets
Residual breaking load estimation via AI degradation model
Replacement scheduling with minimum safety factor maintenance
Asset Type 03
Polyester Rope (Taut-Leg)
Axial stiffness change monitoring for creep and damage detection
Termination fitting integrity — end termination hot-spot fatigue
Cyclic tension range analysis for fatigue accumulation
UV degradation risk flag for surface-exposed rope sections
DNV-OS-E301 design life compliance documentation
Asset Type 04
Hybrid Chain-Wire-Poly Systems
Cross-segment load redistribution modeling after line failure events
Connector and shackle integrity tracking — hot-spot stress monitoring
Vessel offset exceedance alert — position limit zone monitoring
Metocean event correlation — storm tension history recording
How AI Mooring Monitoring Actually Works — The Data-to-Decision Workflow
Effective AI mooring monitoring is not a dashboard bolted onto a sensor network. It is a structured data pipeline from physical signal acquisition through fatigue model computation to prioritized engineering action. Understanding each stage separates platforms that reduce failure rates from platforms that produce monitoring reports nobody reads.
01
Sensor Data Acquisition
Load pins at fair-leads and anchor terminations, accelerometers on chain stoppers, ultrasonic thickness sensors on chain, acoustic emission sensors on wire terminations, and vessel motion reference units (MRUs) feed continuous data streams into the monitoring platform. Subsea instrumentation uses acoustic modems or ROV-deployed fiber to transmit anchor pile and foundation load data. Sampling rates range from 1 Hz for slow tension trending to 100 Hz for dynamic storm event capture.
02
Fatigue Accumulation Modeling
AI models apply rainflow cycle counting to tension time histories and map cycle ranges against the appropriate T-N fatigue curves (API RP 2SK, DNV-OS-E301, or class society specific curves). Cumulative damage ratios (CDR) are computed for each line and updated continuously. Unlike annual calculation reviews, real-time CDR tracking means fatigue life depletion rates are visible as they change — a storm event that accelerates fatigue by six months of normal accumulation shows up within hours of the event.
03
Anomaly Detection and Alert Generation
Machine learning anomaly detection flags deviations from expected mooring system behavior — a tension reading inconsistent with the load-sharing pattern of healthy adjacent lines, corrosion rate acceleration exceeding historical baseline, or vessel offset approaching design exceedance limits. Alerts are severity-classified and routed to the responsible engineering team with supporting data context — not just an alarm number.
04
Inspection Optimization and Work Order Generation
AI-driven risk ranking replaces fixed-interval ROV inspection schedules with condition-based prioritization. Lines showing accelerated fatigue accumulation or anomalous tension signatures are automatically elevated in inspection priority — the next ROV mobilization targets the highest-risk lines, not the next lines on an alphabetical rotation. Work orders are generated with pre-populated line identification, recommended inspection scope, and compliance documentation requirements.
05
Compliance Documentation and Regulatory Reporting
Every tension event, inspection finding, fatigue calculation update, and maintenance action is recorded automatically with timestamp, engineer ID, and supporting data files. BSEE regulatory reporting packages, class society annual survey documentation, and operator internal integrity reports are generated on demand — eliminating the multi-week manual assembly that follows a conventional annual inspection campaign.
A Single FPSO Mooring Failure Can Cost $4M+ Per Day in Lost Production
Map Your Mooring System Monitoring Gaps. Close Them Before the Next Inspection.
Whether you are managing a single FPSO or a multi-vessel deepwater portfolio, we will review your current mooring integrity program, identify the highest-risk monitoring gaps, and show exactly where AI-driven analytics prevents your next failure event.
Regulatory and Classification Obligations — What U.S. and Global FPSO Operators Must Document
Mooring system compliance in deepwater production is governed by a layered framework of regulatory requirements, class society rules, and operator-specific integrity management obligations. The table below maps primary standards to documentation requirements that AI monitoring platforms automate.
Governing Body / Standard
Scope
Required Interval
Documentation Requirement
Penalty / Consequence
BSEE / 30 CFR 250
U.S. OCS production facilities — mooring incident reporting
Immediate notification on line failure
Incident report, engineering review, corrective action plan
Production shutdown + civil penalty exposure
ABS MODU Rules
Classification survey of mooring systems — annual and special surveys
Deployment Economics — What AI-Driven Mooring Monitoring Costs and Returns
The economics of AI mooring monitoring are straightforward because the cost of a mooring failure event is well-documented by the offshore insurance and regulatory record. The comparison below uses a single-vessel deepwater FPSO as the reference case — a class of asset where monitoring economics are most directly calculable, but where underinvestment in monitoring has historically been most costly.
ROV inspection optimization savings (condition-based vs. fixed-interval mobilizations)
$0–$5M+
BSEE penalty and class suspension avoidance (production stoppage at $4M+/day)
Platform investment typically recovers within 6–12 months on a single avoided emergency intervention. All figures illustrative based on industry benchmarks; vessel-specific modeling available on request.
Expert Review
Catherine Mbeki, P.E.
Principal Offshore Integrity Engineer, Deepwater Operations Division
SPE Member · DNV Certified Mooring Analyst · 19 years deepwater FPSO operations, Gulf of Mexico and West Africa
The mooring monitoring programs I have seen fail are almost always the ones where the sensor data exists but nobody has connected it to a decision workflow. You can have load pins on every fair-lead on the vessel and still miss a developing failure if your fatigue model only gets updated annually and nobody reviews the tension history between ROV campaigns. The AI platforms that are delivering measurable results are not doing anything physically different at the sensor level — they are doing something fundamentally different at the data processing and alert routing level. When a fatigue accumulation rate doubles after a Category 2 storm passes through and the duty engineer gets an alert with supporting data within four hours of the event end, that is when you see behavior change. That is when inspection scheduling adapts, procurement gets moving, and you avoid the 2 AM call from the vessel master that a line has parted. The technology has been production-ready for several years. The gap has been integration and organizational commitment to acting on the alerts, not the monitoring capability itself.
Review conducted March 2025 based on iFactory platform evaluation across two deepwater FPSO deployments in the U.S. Gulf of Mexico and one in the Santos Basin, Brazil.
Conclusion — AI Mooring Monitoring Is No Longer a Technology Bet; It Is a Risk Management Obligation
The offshore industry has moved past the point where AI mooring system monitoring for FPSOs can be framed as an emerging technology investment. The failure data, the insurance record, and the regulatory enforcement history have collectively established continuous monitoring as the minimum standard of care for deepwater production assets. The question facing U.S. deepwater operators in 2025 is not whether to implement AI monitoring, but which platform integrates most cleanly with existing vessel control systems, which line types to prioritize in initial deployment, and how fast to extend monitoring coverage to the full system.
For most operators, starting with chain tension monitoring and fatigue accumulation tracking delivers the fastest risk reduction at the lowest implementation complexity. Wire rope monitoring follows naturally, adding MFL-based broken wire detection capability that closes the remaining gap in a chain-wire hybrid system. Polyester rope monitoring and subsea anchor instrumentation typically complete the implementation as the platform matures and engineering teams build confidence in AI-generated maintenance alerts. The starting configuration matters less than building the data pipeline and decision workflow that turns sensor data into action. That organizational capability — not the sensors themselves — is what separates operators that prevent mooring failures from those that respond to them.
One Avoided Failure Event Pays for Years of AI Monitoring Platform Investment
Start With a Monitoring Gap Assessment for Your FPSO Fleet.
Our offshore integrity specialists will review your current mooring monitoring program, identify the highest-exposure gaps across chain, wire, and polyester line systems, and walk you through a deployment path that fits your operational schedule and budget.
Production loss risk from unplanned mooring failure
Real-Time CDR
Fatigue life tracking — continuous, not annual
BSEE · ABS · DNV
Compliance documentation automated
6–12 months
Typical platform payback period
Frequently Asked Questions
The primary sensor types used in FPSO mooring monitoring are load pins or tension load cells installed at chain stoppers and fair-leads to measure mooring line tension; vessel motion reference units (MRUs) to track six-degree-of-freedom vessel motion and offset; ultrasonic wall-thickness sensors deployed by ROV or crawler on chain segments to detect corrosion-driven metal loss; magnetic flux leakage (MFL) tools for broken wire detection in wire rope segments; and acoustic emission sensors at wire rope termination fittings to detect micro-crack propagation. Subsea instrumentation — including anchor leg tension sensors and riser hang-off load monitoring — uses battery-powered acoustic modems to transmit data to the vessel's data acquisition system. AI platforms ingest all data streams into a unified asset model, regardless of sensor type or manufacturer. Contact us to discuss sensor integration with your current FPSO instrumentation setup.
Real-time fatigue life calculation applies the rainflow cycle counting method to the continuous tension time history measured at each mooring line. The cycle count output is combined with the appropriate T-N fatigue design curve — API RP 2SK for U.S. OCS facilities, DNV-OS-E301 for vessels classed with DNV, or the applicable ABS curve for ABS-classed vessels — and Miner's Rule linear damage accumulation is applied to compute the cumulative damage ratio (CDR) for each line. CDR is updated continuously as new tension data arrives, meaning the platform knows — within hours of a major storm event — how much fatigue life the event consumed and how the remaining design life has changed. Alert thresholds are set at CDR fractions specified by the operator's integrity management plan, typically triggering enhanced inspection review when CDR exceeds 0.1 or 0.2 depending on line criticality and the operator's safety factor philosophy.
Under 30 CFR Part 250, operators on the U.S. Outer Continental Shelf are required to notify BSEE immediately upon discovery of any mooring line failure that affects the stationkeeping capability of a floating production facility. The immediate notification must be followed by a written incident report within a timeframe specified by the district office — typically 15 to 30 days — that includes a description of the failure, the affected line or component, the immediate corrective actions taken, and an engineering assessment of the remaining system integrity under the reduced mooring configuration. BSEE may require production stoppage until the mooring system is restored to full design configuration or a re-analysis demonstrates adequate safety factor with the failed component absent. AI monitoring platforms generate the data record and engineering documentation required for BSEE reporting from the system of record, significantly reducing the manual reconstruction work that typically follows a failure event.
Traditional mooring ROV inspection programs follow a fixed rotation — lines are inspected on a calendar schedule that treats all lines equally regardless of their actual condition or fatigue accumulation history. AI-driven inspection optimization replaces fixed rotation with a continuous risk ranking that scores each line based on its current fatigue CDR, the rate of change of that CDR, any anomalous tension readings relative to the load-sharing model, corrosion rate trend from ultrasonic monitoring, and the consequence of failure given the line's position in the mooring pattern. The risk score is updated continuously, so when a ROV mobilization is scheduled, the inspection sequence targets the highest-risk lines first — ensuring that if weather or operational constraints shorten the campaign, the most critical assets have been inspected. Over a typical five-year class survey cycle, AI-optimized inspection programs routinely reduce the total number of ROV mobilization days required while increasing inspection coverage quality on the lines that actually matter.
For an existing deepwater FPSO with partial instrumentation already installed, implementation typically follows a 4–8 month timeline from contract execution through full operational deployment. The first 6 weeks focus on existing sensor integration — data acquisition system connections, historian data backfill for fatigue model initialization, and mooring analysis model calibration against as-built system data. Weeks 6–16 cover any additional sensor installation scoped during the baseline assessment, platform configuration for the specific mooring pattern, and alert threshold setting with the operator's integrity management team. Weeks 16–24 complete compliance schedule configuration, ROV inspection prioritization setup, and offshore team training. Platform investment for a single vessel including integration, software licensing, and first-year support ranges from $180K–$450K depending on instrumentation scope. Payback is typically achieved within 6–12 months based on a single avoided emergency ROV mobilization or production stoppage event. Contact us for a vessel-specific cost and ROI model.