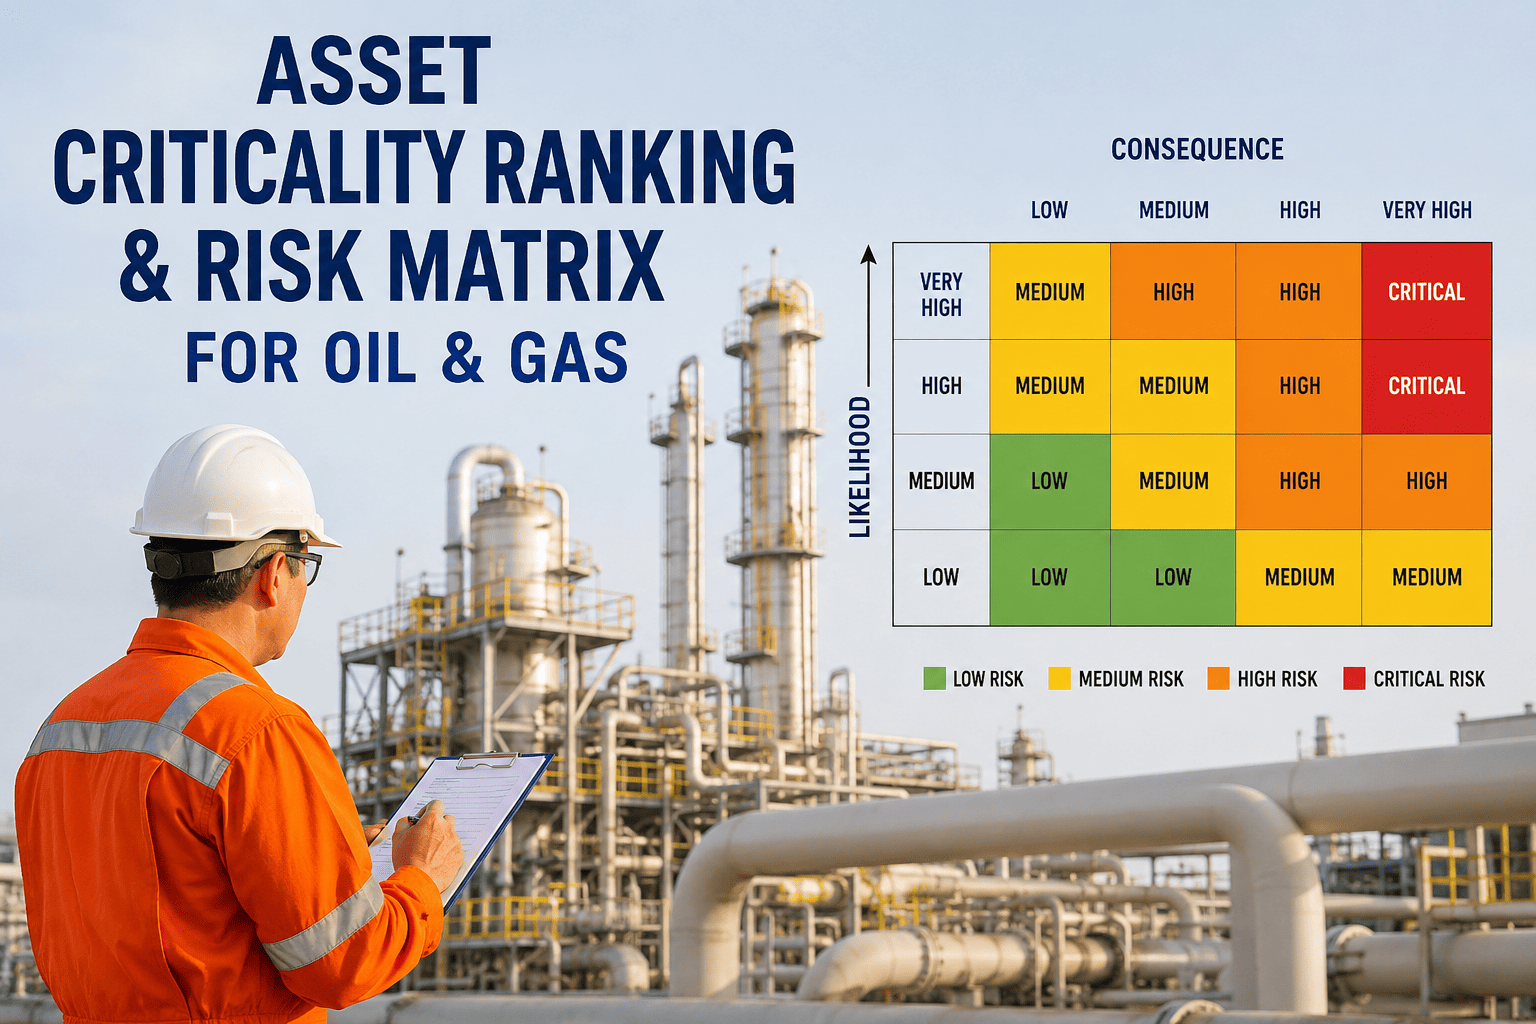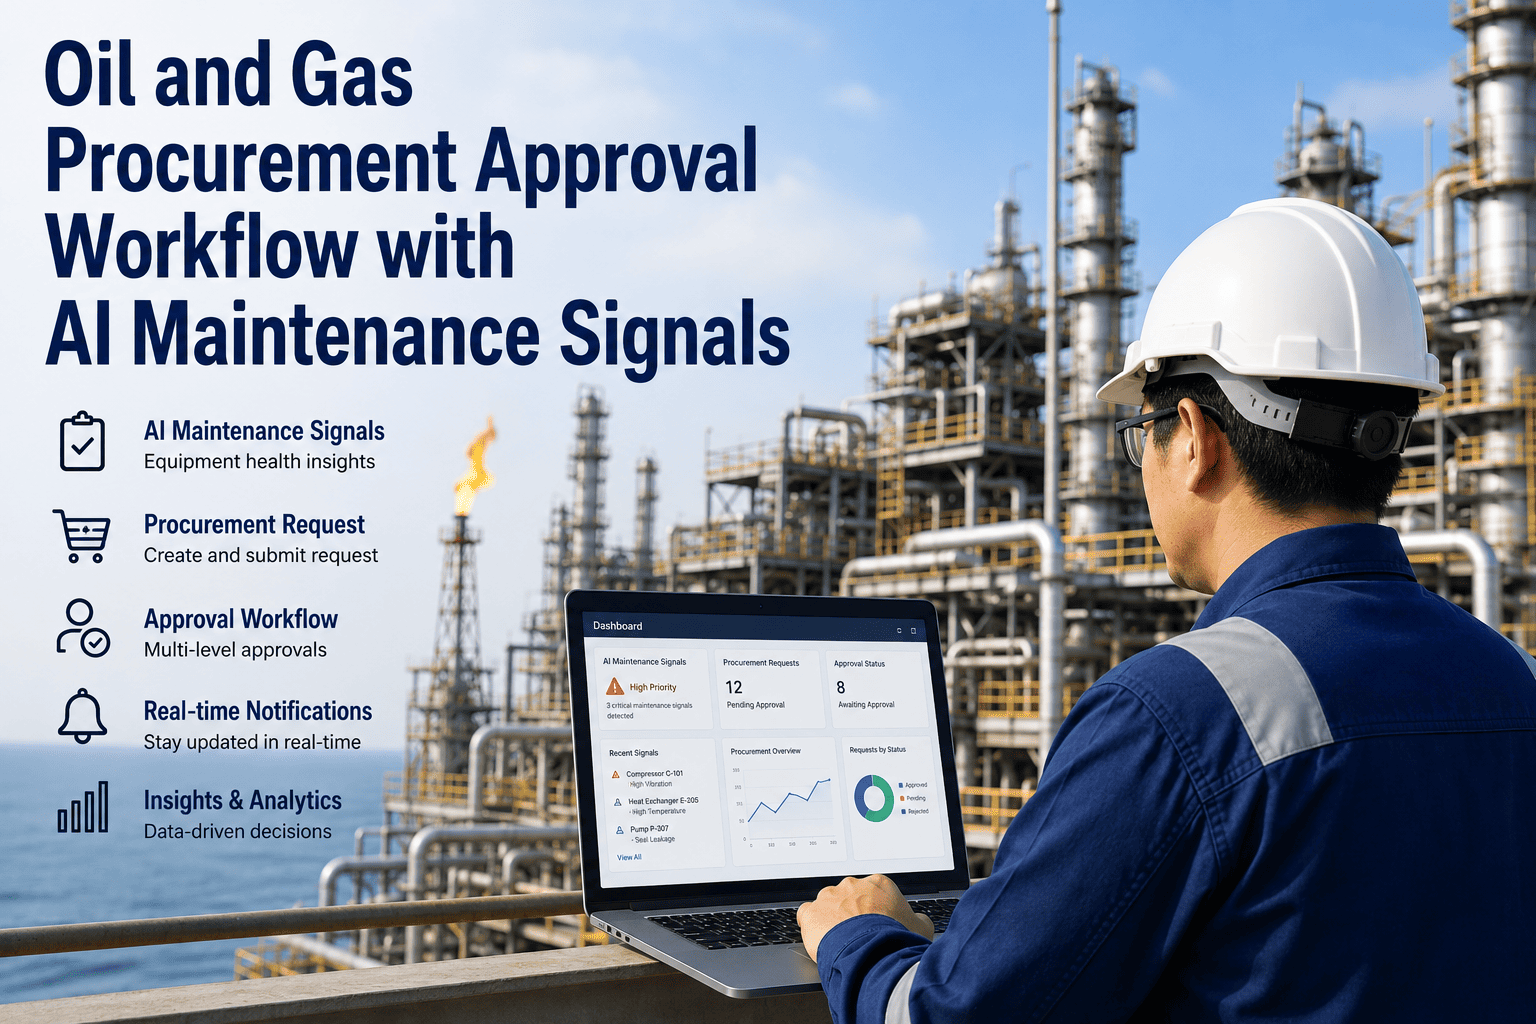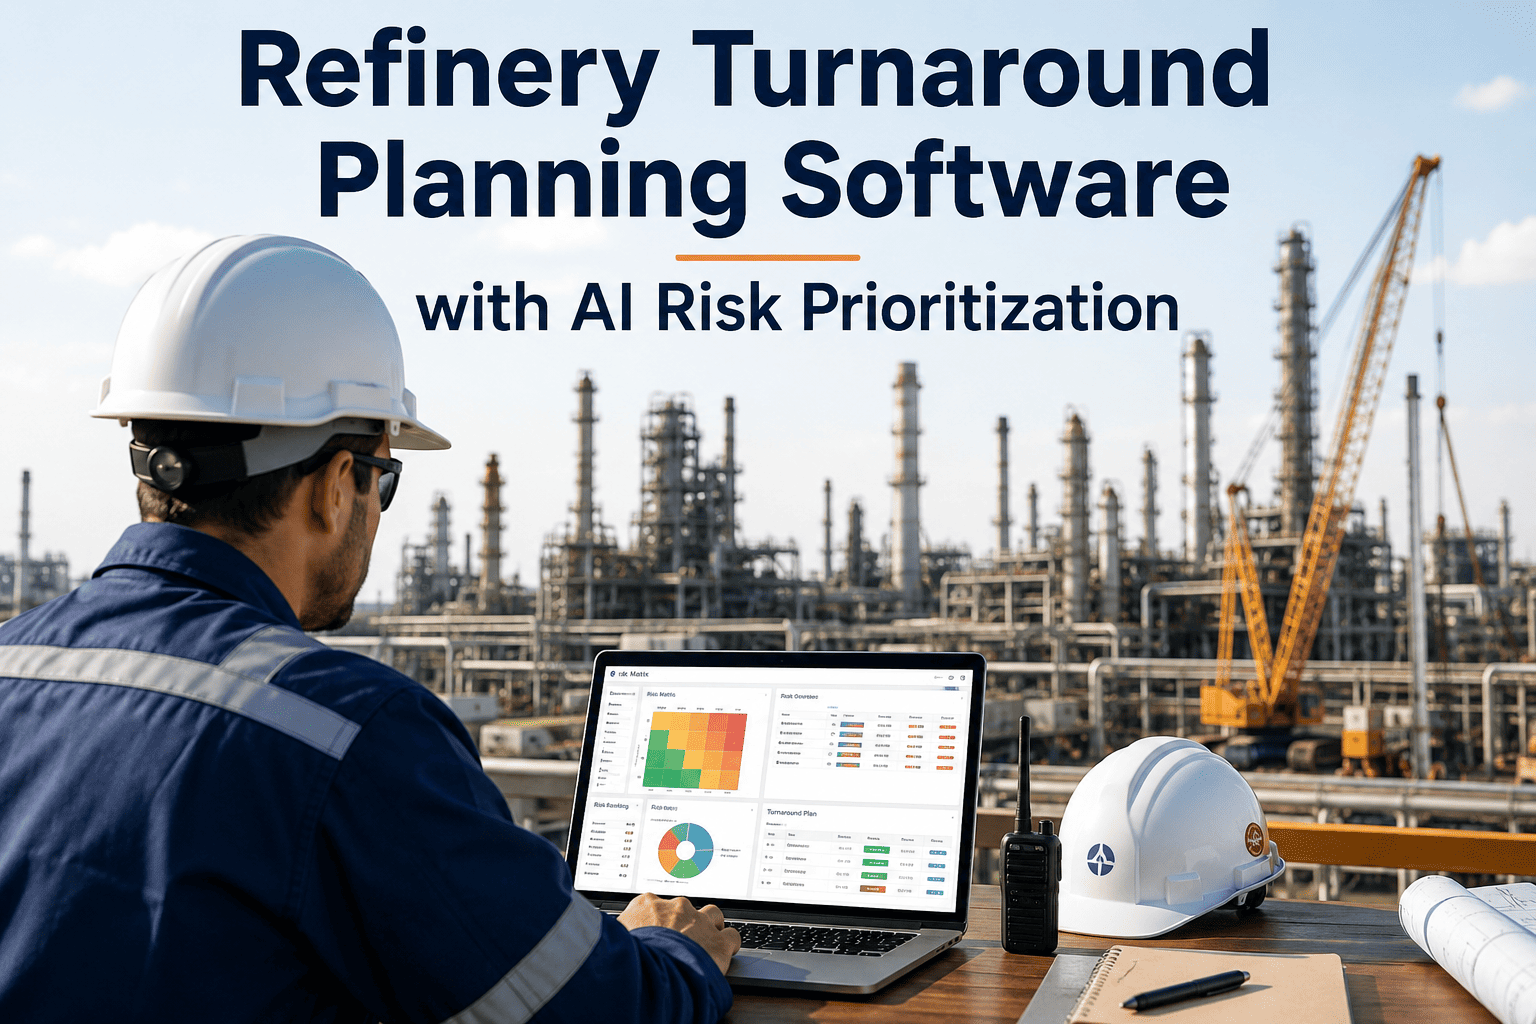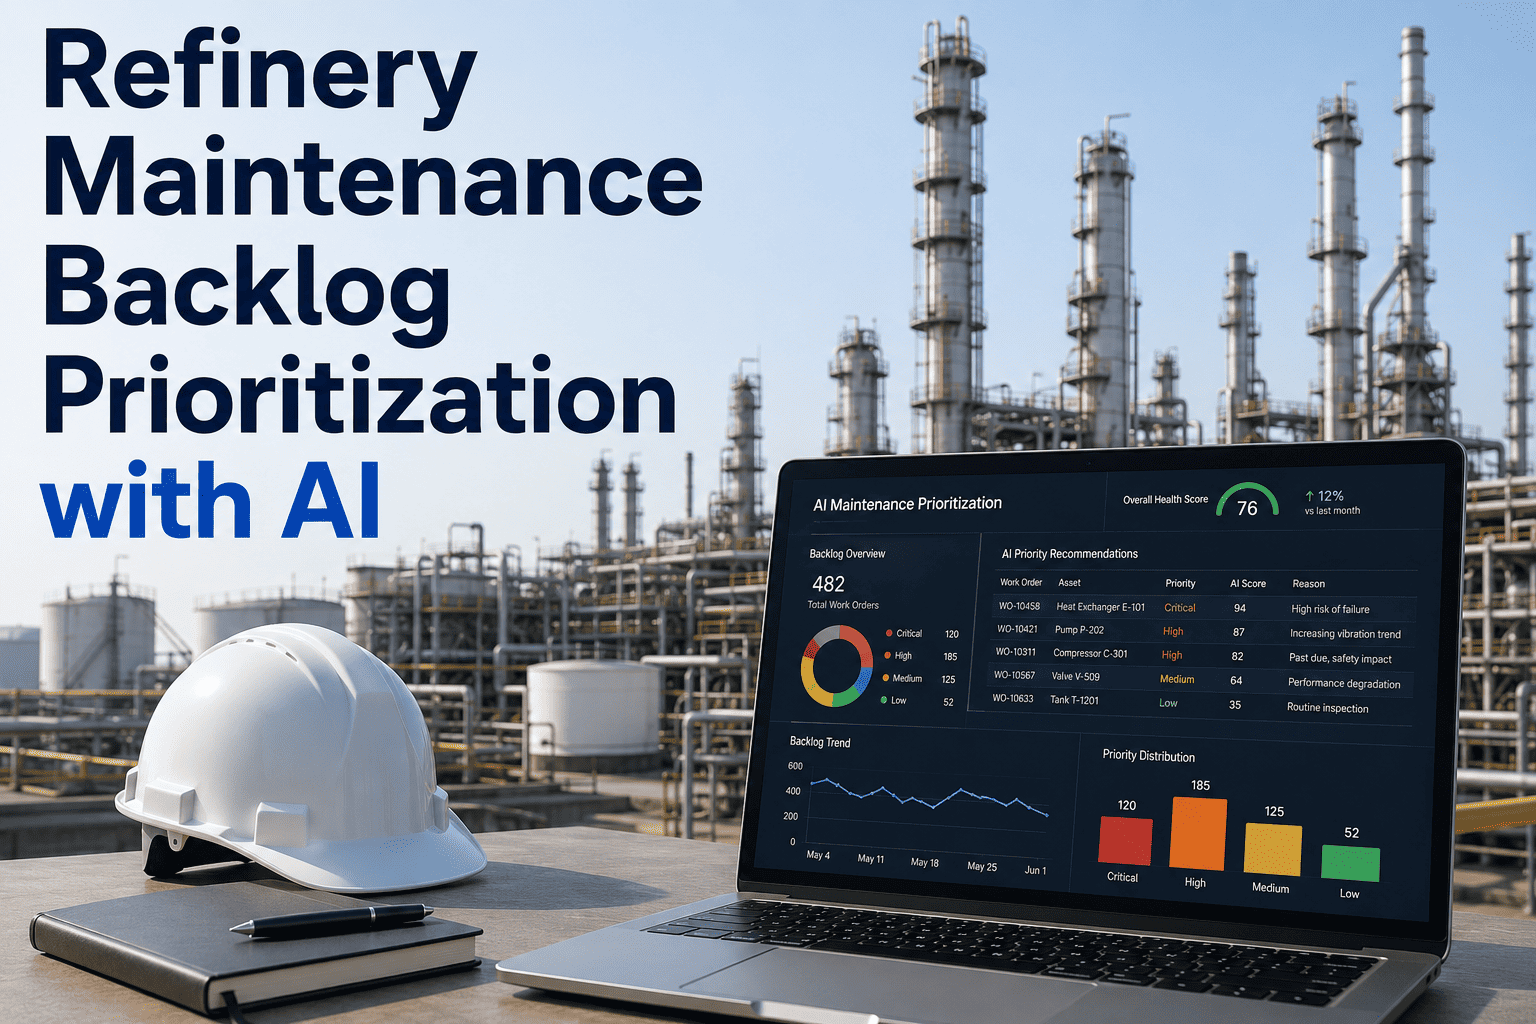
A refinery turnaround team can carry four thousand to eight thousand open work orders at any given time, and only a fraction of them close before the next planned outage. Some of those orders are cosmetic. Others are one missed inspection away from a process safety event, sitting in the same queue as a loose handrail bracket with no way to tell them apart at a glance. The real shortage on most units is not maintenance hours, it is confidence about which work order deserves the next open crew slot. AI-driven backlog prioritization removes that guesswork by scoring every open order against asset criticality, safety consequence, and inspection evidence, then re-ranking automatically as new data comes in, and you can book a working session to see it run against your own unit's backlog.
Your Backlog Isn't Too Big. It's Just Unranked.
Most CMMS platforms store thousands of open work orders in the order they were written, not the order they matter. Planners end up ranking by memory, by who shouted loudest in the morning meeting, or by whichever job has the fewest missing parts. None of those signals tell you which valve is closest to failure. iFactory's backlog prioritization engine reads your existing EAM or CMMS data, layers in criticality, risk, and inspection history, and hands the planner a ranked list that updates itself every time a new work order or inspection finding lands.
average open work orders sitting in backlog on a mid-size fuels refinery at any point in the year
of backlog hours typically spent on medium and low criticality assets while high-risk items wait
how long a corrosion-related work order can sit unranked before it becomes a shutdown-driving repair
Where an Unranked Backlog Actually Costs You Money
An unranked backlog does not fail loudly. It fails quietly, one deferred work order at a time, until a turnaround scope review turns up a repair that should have been caught two years earlier. The cost shows up in three places on every unit: emergency work that could have been planned work, extended outage scopes that blow past the budgeted window, and near-misses that trace back to a work order that was open, known, and simply outranked by something less important. Planners are not the problem. The problem is that criticality, safety consequence, and inspection evidence live in three different systems, and nobody has time to cross-reference six thousand rows by hand before Monday's meeting.
Emergency Work Creep
Jobs that sat unranked in backlog resurface as breakdown work, pulling crews off planned scope and driving overtime hours that were never budgeted.
Turnaround Scope Growth
Deferred backlog items get discovered during shutdown walkdowns, adding late scope that extends the outage window and the contractor bill.
Inspection Findings Left Open
Corrosion, thinning, and integrity findings generate work orders that compete for the same crew time as routine PMs, with no automatic weighting toward risk.
Planner Time on Triage
Senior planners spend hours each week re-sorting spreadsheets and CMMS exports just to guess at a defensible priority order for next week's crew.
The Four Factors Behind Every Ranked Work Order
The ranking engine does not treat every work order the same, and it does not rely on a single field like priority code, which is usually set once at creation and never revisited. Instead, it recalculates a composite risk score every time relevant data changes: a new inspection reading, a changed process condition, a missed PM cycle. Here is what goes into that score and how much weight each factor typically carries on a process unit.
These weightings are configurable per unit. A crude unit heater tube leak and a cooling tower fan belt do not carry the same consequence profile, and the model is tuned against your own criticality register rather than a generic industry default.
See Your Own Backlog Re-Ranked, Not a Demo Dataset
iFactory pulls a sample export from your EAM or CMMS during the working session and ranks it live against criticality, safety consequence, and inspection evidence, so you are looking at your unit's actual risk picture, not a canned example.
The Data Behind Every Score: Four Inputs, One Ranked List
A ranking is only as good as what feeds it. The engine does not ask planners to enter new data by hand. It reads from systems you already run, and it treats each source as a layer of evidence rather than a standalone number. Here is what each input contributes to the final rank.
Criticality Register
Asset criticality tiers from your reliability program, including redundancy, process role, and consequence of failure classification already defined for each tag.
Inspection History
Thickness readings, RBI intervals, corrosion rates, and open integrity findings pulled from your inspection data management system.
Work Order Metadata
Failure codes, equipment history, age of the open order, and repeat-failure patterns already logged in your CMMS or EAM system.
Process Condition Data
Live or historian tags such as vibration, temperature, and pressure trends that flag whether a deferred job is drifting toward failure.
Spreadsheet Triage vs AI-Ranked Backlog
Planners are not choosing between doing this work and not doing it. They are already ranking the backlog every week, just without a repeatable method behind it. Here is what changes when the ranking is calculated instead of guessed.
Three Work Orders, Three Very Different Scores
The clearest way to see the ranking logic is to look at how it treats work orders that look similar on paper but carry very different risk. Here are three examples pulled from a typical process unit backlog and how the engine would rank them relative to each other.
Heat Exchanger Tube Leak, Non-Critical Loop
Open six weeks, no redundancy loss, thinning trend flat over the last three inspection cycles. Ranked lower despite its age, because condition data shows the leak rate is stable, not accelerating.
Relief Valve Set Point Drift, Safety Critical
Open ten days, tied to a process safety critical device, drift confirmed against the last two proof tests. Moves to the top of the list immediately, regardless of how recently it was written.
Cooling Tower Fan Vibration, Redundant Unit
Open four months, vibration trending up but a redundant fan covers the load. Scheduled into the next planned window instead of competing for emergency crew time.
How the Ranking Engine Connects to Your Existing EAM or CMMS
This is not a new system planners have to learn, and it does not ask you to re-enter your criticality register or inspection history anywhere new. It reads from what you already run and writes the ranked list back into the same interface planners already use every morning.
Connect and Map
iFactory connects to your EAM or CMMS, your inspection data system, and process historian, then maps asset IDs across all three so every work order carries a consistent identity.
Calibrate the Score
Reliability and planning teams review the default weighting against real backlog items and adjust the model until the ranked order matches what an experienced planner would defend in an audit.
Go Live in Existing Tools
The ranked list writes back into your CMMS work order view as a priority field, so planners keep working in the system they already know, just with a defensible order already applied.
Reliability Team Perspective
Our backlog review used to be an hour of arguing about which job was really the priority. Now the list walks in already ranked, and the arguments are about scope and parts, not about whether a relief valve finding outranks a handrail repair. We closed our oldest safety-critical work orders in the first quarter after go-live, not because we worked more hours, but because we finally worked the right ones first.
— Reliability Engineering Lead, Gulf Coast Fuels Refinery
Frequently Asked Questions
Does the ranking engine replace our planners or the weekly backlog meeting?
No. It removes the manual triage step that eats up planner time before the meeting even starts, so the discussion can focus on scope, parts, and crew availability instead of arguing over which job is more important. Planners still make the final call on scheduling, and they can override a rank with a documented reason, which itself becomes part of the audit trail. The goal is a better starting point for the conversation, not a replacement for the people having it. Most teams find the meeting gets shorter and more productive within the first month.
What if our criticality register or inspection data is incomplete or out of date?
This comes up on almost every unit, and it is addressed during the calibration phase rather than treated as a blocker. The engine can run on partial data and flag which assets have low-confidence scores because of missing criticality or inspection records, which itself becomes a useful list for closing data gaps. Many plants use the rollout as the forcing function to finally clean up a criticality register that has not been touched in years. Talk to a specialist about what your current data completeness looks like before committing to a timeline.
How does the system handle a sudden change, like a new inspection finding mid-week?
The score recalculates as soon as new data lands, not on a weekly batch cycle. If an inspection finding shows accelerated corrosion on a process critical line, the associated work order moves up the ranked list immediately, and planners see the change the next time they open the work order view. This is one of the biggest differences from spreadsheet triage, where a new finding waits for the next scheduled review before anyone reprioritizes around it.
Can the weighting be adjusted for different units, like a crude unit versus a utilities area?
Yes, and it should be. A crude unit and a utilities area do not carry the same consequence profile, so the default weighting between criticality, safety consequence, inspection evidence, and downtime impact is tuned per unit during calibration. Reliability and planning teams work directly with iFactory engineers to set weightings that match how your organization already defines risk, rather than applying one generic model across every asset on site.
How long does it take to go from kickoff to a live ranked backlog in our CMMS?
Most refinery deployments move from connection to a live ranked list within a fixed timeline that depends on how many systems need to be mapped and how much calibration the reliability team wants before go-live. The heaviest lift is usually asset ID mapping across the CMMS, inspection system, and historian, which iFactory engineers lead directly. Book a scoping call to get a timeline built around your specific systems and data quality.
Rank Your Backlog Before the Next Outage Scope Review
Book a 30-minute planning session and iFactory will map your EAM or CMMS, inspection data, and criticality register into a live ranked backlog view, so your next turnaround scope is built on evidence instead of memory.