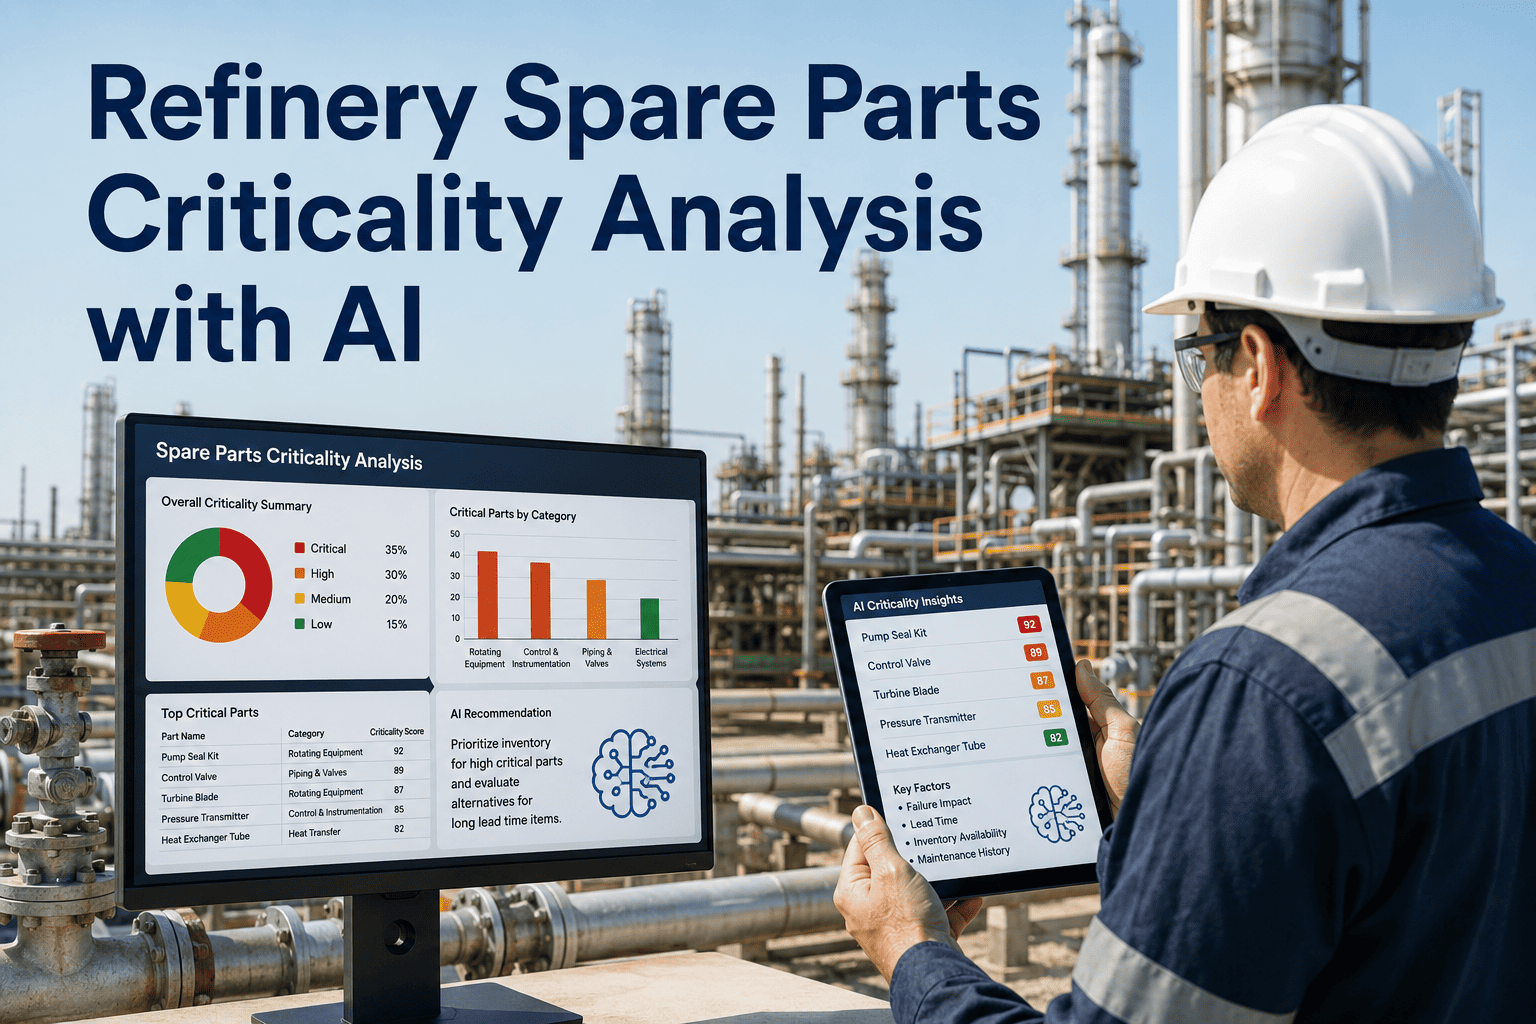
Refinery maintenance teams manage between 15,000 and 50,000 unique spare part numbers in their MRO inventory, yet industry studies reveal that 40 to 60 percent of those parts remain unused over a five-year window. At the same time, stockout events on genuinely critical components trigger unplanned shutdowns costing $1 million to $5 million per day in lost production. The root cause is that traditional criticality ranking relies on subjective judgments, broad equipment classifications, and static risk scores that ignore real-time failure probability, consumption patterns, and lead time fluctuations. AI-driven criticality analysis replaces this guesswork by continuously re-ranking every part based on its measurable contribution to operational downtime risk. Book a demo to see how AI re-ranks your entire MRO inventory in days.
AI-Powered Spare Parts Criticality Scoring for Refineries
Move beyond static ABC classification. iFactory Inventory AI analyzes asset criticality, failure impact, lead time risk, and usage history to dynamically rank every spare part in your refinery.
Why Traditional Spare Parts Criticality Ranking Fails Refineries
Conventional methods were designed for simple manufacturing environments, not complex process plants where a single pump failure can cascade into a unit-wide shutdown worth millions in lost revenue.
Five Dimensions of AI Criticality Scoring
iFactory Inventory AI evaluates every spare part across five weighted dimensions, producing a composite criticality score between 0 and 100 that reflects true operational risk rather than purchase price.
AI Criticality Distribution Across Refinery Equipment Categories
This heat map shows how AI reclassifies spare parts by equipment category, revealing concentration patterns that traditional ABC analysis completely misses. Cell intensity reflects the percentage of parts in each category assigned to each criticality tier.
Planned vs Actual Lead Time by Equipment Category
The gap between planned and actual procurement lead times represents hidden stockout risk that traditional criticality models never capture. AI tracks this variance continuously and adjusts safety stock recommendations accordingly.
Traditional vs AI Criticality Ranking Methods
Direct comparison across key evaluation parameters shows why AI-based criticality analysis produces materially different and more operationally accurate spare parts classifications.
| Evaluation Parameter | Traditional ABC / VED | AI Criticality Scoring |
|---|---|---|
| Classification Basis | Annual spend volume or single-dimension expert rating | Multi-dimensional composite score from five weighted risk factors |
| Update Frequency | Annual or biennial manual review cycle | Continuous recalculation as input data changes |
| Lead Time Treatment | Static single-value lead time per part | Dynamic lead time with variability coefficient and trend analysis |
| Failure Mode Integration | Not connected to specific failure modes or consequences | Linked to FMEA data with severity and probability weighting |
| Substitutability Factor | Rarely considered in classification | Explicitly scored based on alternative parts, rerouting, and temporary repair options |
| Demand Pattern Analysis | Based on historical averages only | Pattern recognition for intermittent, seasonal, and condition-triggered demand |
| Scalability | Degrades above 5,000 parts due to manual effort | Scales to 100,000+ parts with consistent scoring quality |
| Stockout Prediction | Reactive, discovered only when shortage occurs | Proactive, flags high-risk parts before stockout becomes imminent |
Measured Impact of AI Criticality Analysis on Refinery MRO Inventory
Refineries that have replaced traditional ABC classification with AI-driven criticality scoring report significant improvements across inventory efficiency, stockout prevention, and working capital optimization.
Five-Phase Implementation Approach
Deploying AI criticality analysis follows a structured process that integrates with your existing CMMS, ERP, and procurement systems without disrupting current operations.
Frequently Asked Questions
How does AI criticality scoring differ from traditional ABC classification for refinery spare parts?
ABC classification sorts parts into three tiers based on a single variable, typically annual purchase spend, which has no direct correlation to operational consequence. A low-cost bearing on a critical compressor may be a C item by spend but the most operationally important part in the warehouse. AI criticality scoring replaces this single-dimension approach with a composite score derived from five weighted dimensions: parent asset criticality, failure consequence severity, lead time risk, consumption predictability, and substitutability. The result is a criticality ranking that directly reflects each part's contribution to unplanned downtime risk, enabling maintenance teams to allocate inventory investment where it actually prevents production loss. Book a demo to see the scoring difference on your own parts data.
What data inputs does the AI model need to calculate accurate criticality scores?
The AI criticality model requires five categories of data inputs, though it can produce useful initial scores with partial data and improve accuracy as more sources are connected. First, equipment hierarchy and criticality ratings from your reliability team or existing RBI assessments. Second, work order history including failure codes, repair actions, and downtime duration from your CMMS. Third, purchase order history with actual lead times, supplier information, and unit costs from your ERP or procurement system. Fourth, current inventory levels, safety stock settings, and consumption history. Fifth, failure mode and effects analysis data if available, which significantly improves the failure consequence dimension. iFactory Inventory AI includes pre-built connectors for SAP, Oracle, Maximo, and other common refinery systems to automate this data extraction. Contact support for a data readiness assessment.
How often should criticality scores be recalculated for refinery spare parts?
AI criticality scores should be recalculated continuously or at minimum on a monthly cycle, which is one of the fundamental advantages over traditional methods that update annually or less frequently. In a refinery environment, several factors change frequently enough to shift criticality: equipment operating conditions and loading may change after a process optimization project, lead times fluctuate with supplier capacity and global supply chain conditions, failure patterns emerge as equipment ages past design life thresholds, and new failure modes are discovered after process upsets or corrosion events. The AI model monitors these input changes and flags any part whose composite score has shifted by more than a defined threshold, typically 10 points, triggering an automatic review. This continuous reassessment ensures that safety stock levels and procurement priorities always reflect current risk rather than outdated assumptions from the last manual review. Book a demo to see continuous recalculation in action.
Can AI criticality analysis handle spare parts that have no failure history at all?
Yes, this is one of the most valuable capabilities of AI-based criticality analysis compared to purely data-driven statistical methods. Parts with zero failure history present a challenge for frequency-based models but are handled effectively through the multi-dimensional scoring approach. The asset criticality dimension scores the part based on its parent equipment importance regardless of whether the specific part has failed before. The failure consequence dimension uses FMEA data or engineering judgment about what would happen if the part failed, independent of failure frequency. The lead time risk and substitutability dimensions evaluate supply chain and alternative options without requiring failure data. For completely new installations with no history, the model can also leverage transfer learning from similar equipment types at other refineries in the iFactory database to establish reasonable initial scores that are then refined as actual operating data accumulates. Contact support to learn about transfer learning capabilities.
How does AI-based criticality analysis reduce total MRO inventory costs for a refinery?
AI criticality analysis reduces MRO inventory costs through three distinct mechanisms that compound into significant total savings. First, it identifies and enables disposition of dead stock and non-critical overstock that typically represents 15 to 25 percent of total MRO inventory value in refineries still using ABC classification. Parts reclassified from A or B to C or D based on AI scoring can have their safety stock reduced or converted to just-in-time procurement. Second, it concentrates safety stock investment on genuinely critical parts, which means the same or better stockout protection is achieved with less total inventory value. Rather than holding 6 months of safety stock across 20,000 parts, you hold targeted safety stock on the 2,000 parts that actually matter. Third, proactive stockout prediction prevents emergency procurement premiums that typically run 50 to 200 percent above standard pricing for critical refinery components. Refineries using iFactory Inventory AI report 25 to 40 percent total MRO inventory reduction within the first year while simultaneously improving critical part availability. Book a demo to model savings potential for your inventory.
Stop Overstocking Non-Critical Parts While Risking Stockouts on the Ones That Matter
iFactory Inventory AI re-ranks every spare part in your refinery by true operational risk, so your inventory dollars protect production instead of sitting on shelves.