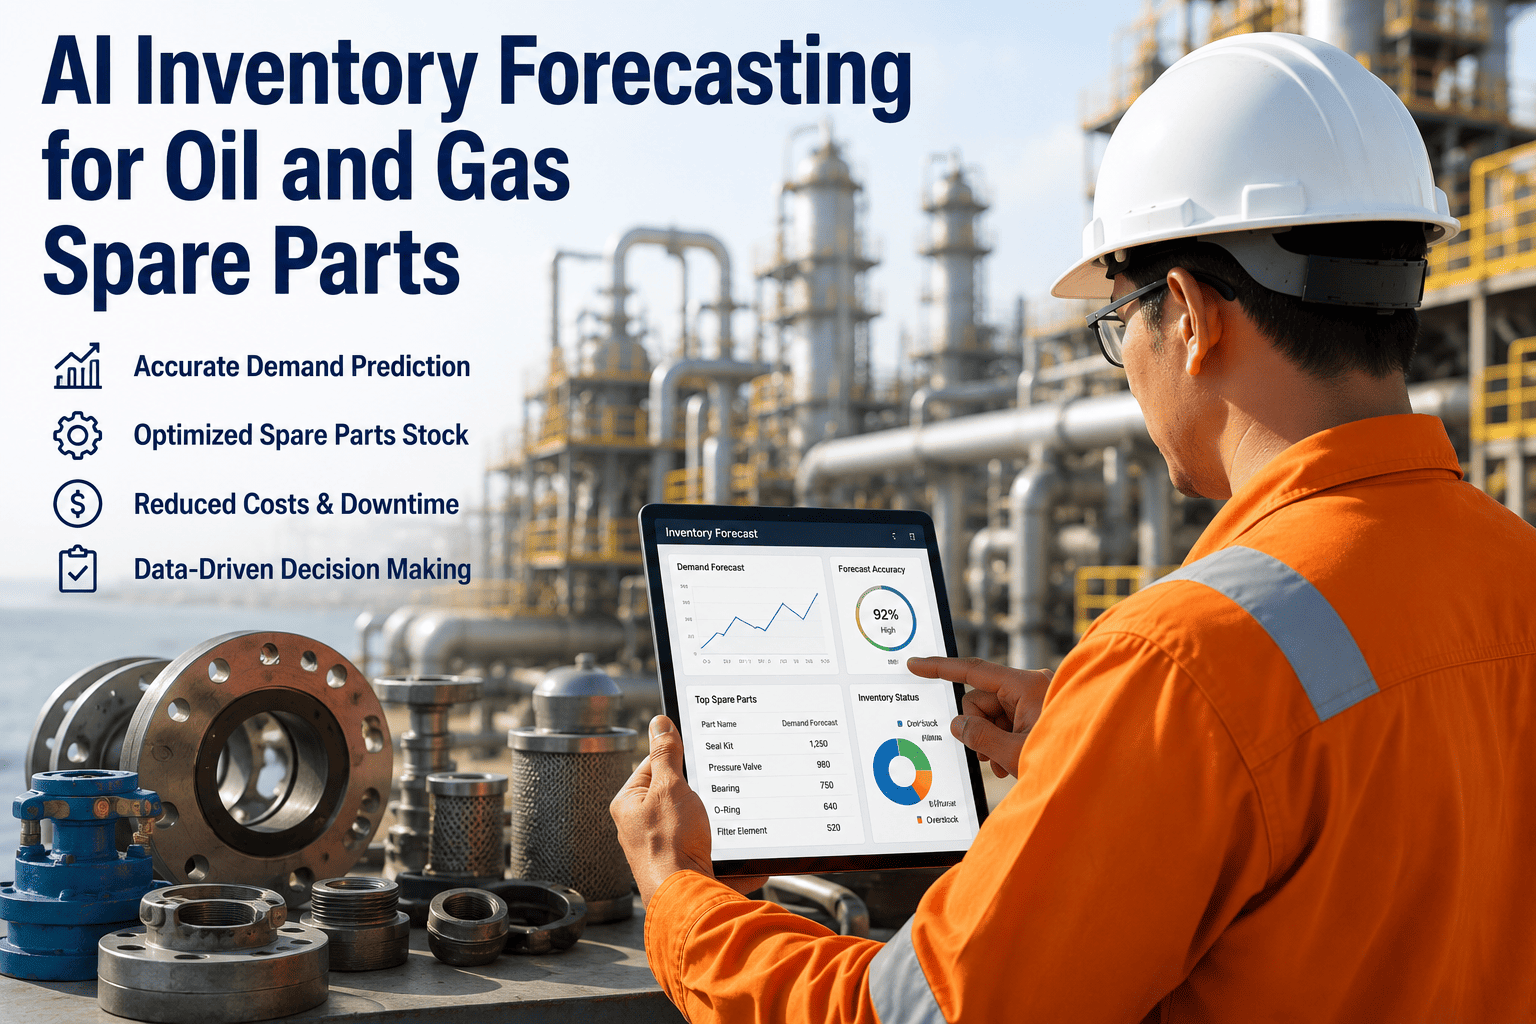
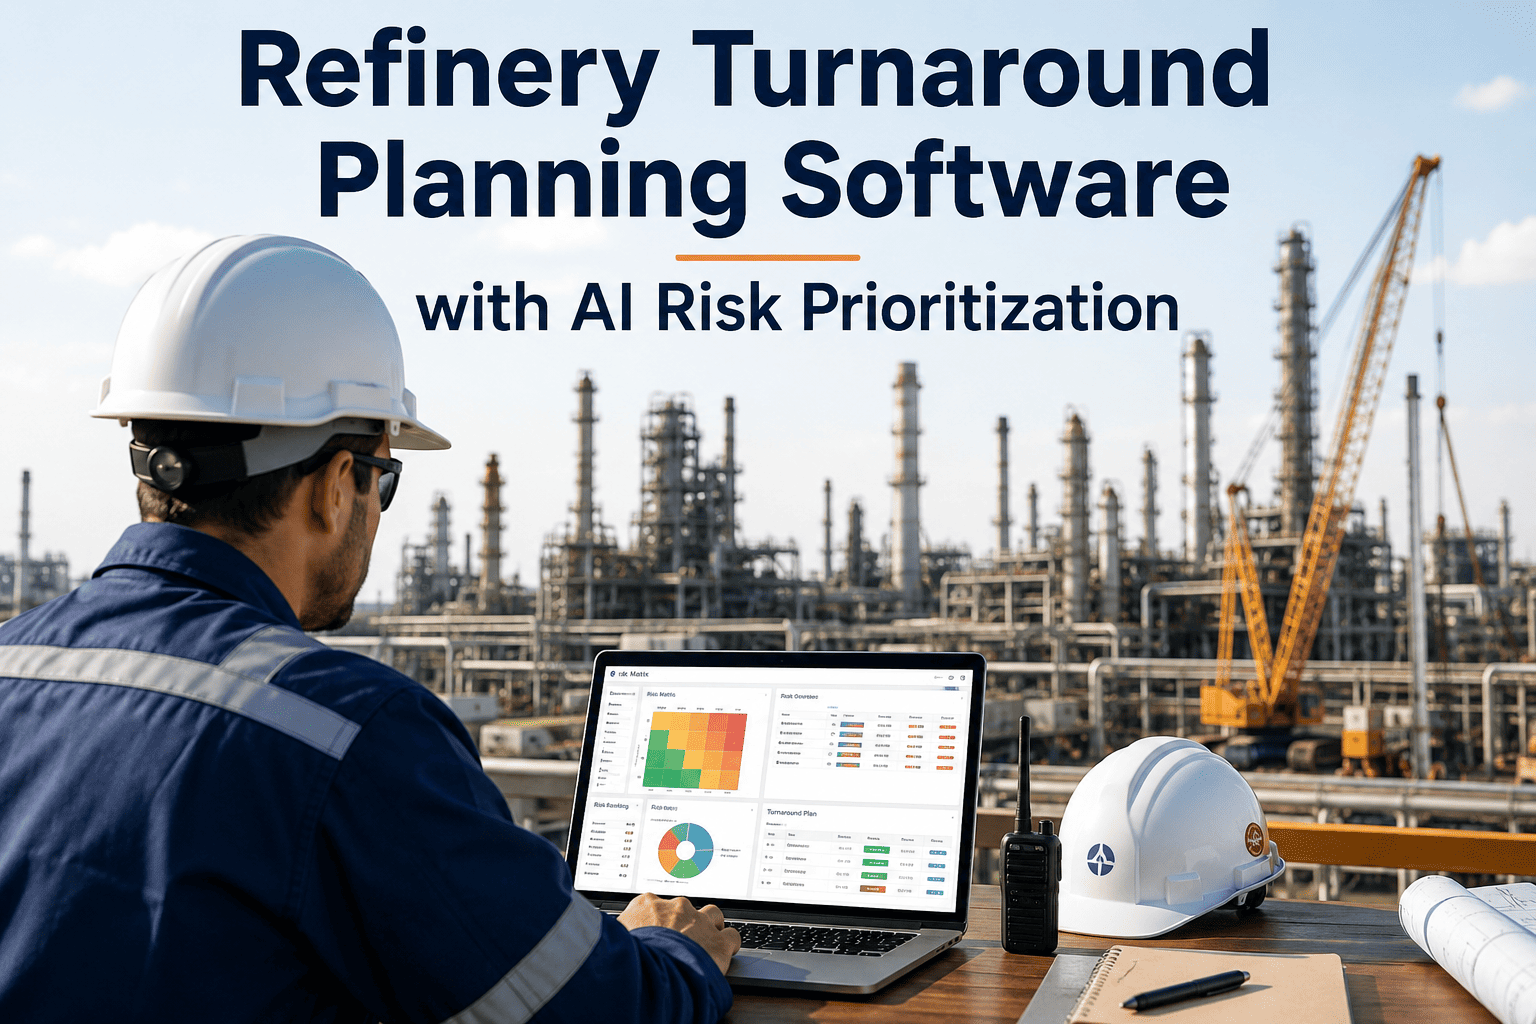
A conveyor bearing that costs less than fifty dollars can sit out of stock for over a week while the production line it feeds sits idle, because nobody connected the maintenance history that predicted the failure to the storeroom shelf that was supposed to hold the replacement. That gap between what maintenance already knows and what the storeroom actually stocks shows up on almost every plant floor, usually in one of two costly directions: a stockout that halts production, or a storeroom shelf of parts nobody has touched in years. Traditional reorder points are built on fixed averages set once and rarely revisited, so they never adjust when an asset ages, a production run intensifies, or a supplier's lead time quietly gets longer. iFactory's Inventory AI reads the same maintenance signals your team already generates and turns them into a live, part-by-part demand forecast, and you can book a demo to see it run against your own current spare parts list.
MRO · SPARE PARTS · INVENTORY AI
Every Stockout Was Predictable. The Data Was Just Never Asked the Right Question.
iFactory's Inventory AI connects maintenance history, asset condition, and PM schedules into a continuously updating demand forecast, so critical spare parts are on the shelf before the failure that needs them.
TWO WAYS INVENTORY PLANNING FAILS
Every Spare Parts Storeroom Fails in One of Two Directions, Often at the Same Time
Ask any plant manager where their inventory problem sits and the honest answer is usually both. A single storeroom can carry thousands of dollars in slow-moving parts on one shelf while the part that actually matters, the one tied to a compressor that's already trending toward failure, sits unavailable two aisles over. Static reorder points treat every part the same way, which guarantees this imbalance keeps repeating month after month.
Overstock
Capital sits idle on shelves in parts that rarely move, storage space fills up, and shelf life quietly expires on components nobody scheduled a use for.
Stockout
A predictable failure arrives on schedule, the part isn't there, and an emergency order at rush pricing becomes the only option while the asset stays down.
WHAT AN ACCURATE FORECAST ACTUALLY NEEDS
Six Data Streams Feed Every Reliable Spare Parts Forecast — No Spreadsheet Can Track Them All at Once
Accurate forecasting isn't a single number pulled from last year's average. It's the intersection of everything your maintenance, operations, and procurement teams already record, brought together in one place instead of six disconnected ones.
01
Work Order History
Every corrective and preventive work order reveals which parts were consumed, at what rate, and under which operating conditions.
02
Asset Condition Trends
As condition scores decline with age, failure frequency rises in a way that a flat monthly average can never capture on its own.
03
PM Calendars
Scheduled preventive tasks carry known parts requirements that can be pre-staged weeks ahead of the work order actually opening.
04
Failure History
Past failure patterns by asset class expose which components fail together, informing bundled replenishment instead of single-part guesses.
05
Production Schedules
Run-rate changes shift wear rates on the equipment behind them, and a forecast that ignores production intensity falls behind quickly.
06
Supplier Lead Times
Actual historical delivery performance, not the catalog promise, determines how early a reorder point genuinely needs to trigger.
CRITICALITY VS CONSUMPTION VELOCITY
Not Every Part Deserves the Same Stocking Strategy — This Matrix Shows Why
Treating every SKU the same way is the root cause behind most storeroom imbalance. A criticality-versus-velocity view separates the parts that genuinely need a forecasting model from the ones that don't.
High Criticality · Low Velocity
Critical Reserve
Rarely used but essential; a stockout here means a shutdown, so mandatory local safety stock stays in place regardless of how infrequently the part moves.
High Criticality · High Velocity
Dynamic Reorder
Consumed regularly on essential equipment; AI-triggered reorder points keep stock lean without ever risking availability on these lines.
Low Criticality · Low Velocity
Vendor Managed
Low impact and easy to source; minimal internal stock is held, with replenishment left largely to the supplier relationship.
Low Criticality · High Velocity
Lean Consumables
High turnover, low risk; these parts are managed with simple, high-frequency replenishment rather than dedicated forecasting attention.
Stop Managing Every Part the Same Way
iFactory scores every SKU by criticality and velocity automatically, so stocking strategy matches actual operational risk.
STATIC REORDER POINTS VS AI FORECASTING
What Changes When Reorder Points Stop Being a Fixed Number Set Once a Year
HOW THE FORECAST GETS BUILT
From Existing Maintenance Records to a Live Demand Forecast, Without New Sensors
Inventory AI doesn't wait for a new hardware rollout before it starts helping. The highest-value signal is almost always already sitting inside your CMMS, waiting to be connected.
1
Connect Existing Records
Work order history, PM schedules, asset condition data, and current inventory counts are unified from the systems you already run.
2
Build Consumption Profiles
The model builds a consumption velocity profile for every part against the specific asset class it serves, not a generic plant-wide average.
3
Layer In Condition and Schedule Data
Asset health scores and the upcoming PM calendar adjust the forecast forward, flagging demand spikes before they hit the storeroom.
4
Surface Risk Before It Becomes a Stockout
A live dashboard compares on-hand quantity against the 30/60/90-day forecast and flags any SKU projected to fall below safety threshold.
WHAT TEAMS NOTICE FIRST
The Shift Operators Report Once Forecasting Replaces Guesswork
Fewer
Parts-caused stoppages once high-risk SKUs are flagged before the safety threshold is crossed
Leaner
Storeroom footprint as slow-moving overstock is identified and gradually worked down
Freed
Working capital previously tied up in excess parts nobody had scheduled a use for
Consistent
Reorder timing across every site instead of one storeroom guessing differently from the next
FREQUENTLY ASKED QUESTIONS
Questions Maintenance and Procurement Teams Ask About AI Spare Parts Forecasting
Do we need new sensors or IoT hardware before this works?
No, the highest-value signal for an initial forecast is almost always already sitting inside your existing CMMS, including work order history, failure records, and PM schedules, and the model builds its first demand forecast from that data alone. Condition-monitoring sensors and SCADA feeds can improve accuracy further once connected, but they aren't required to start seeing value. This means most operators can begin forecasting from data they already have, without a hardware project ahead of it.
Book a demo to see what your current maintenance data can already produce.
How does this integrate with our current CMMS or ERP?
Inventory AI connects to your existing CMMS and ERP rather than replacing either one, reading work order history, inventory counts, and purchase order data directly from the systems you already operate. Forecasted demand and flagged reorder recommendations are surfaced back into those same systems so your team isn't switching between platforms to act on them. This keeps your current financial and maintenance record-keeping exactly where it already lives.
Contact our support team to review your specific CMMS and ERP setup.
How is a part's criticality actually determined?
Criticality combines the operational consequence of the asset the part serves, including production impact and safety classification, with how frequently the part is actually consumed against that asset. A rarely used part on a single-train compressor is treated very differently than a frequently used part on redundant, non-critical equipment. This classification updates automatically as asset conditions and consumption patterns shift, rather than being recalculated manually once a year.
Book a demo to see how criticality scoring would map to your own asset hierarchy.
Can this reduce excess inventory without increasing stockout risk?
Yes, because the two problems share the same root cause: static reorder points that never adjust to real consumption patterns. As the forecast identifies genuinely slow-moving parts, safety stock on those SKUs can be trimmed with confidence, while the parts tied to real failure risk get tighter, more responsive coverage instead of a flat blanket buffer. The goal is matching stock to actual risk in both directions at once, not simply cutting inventory across the board.
Contact our support team to walk through your current overstock and stockout patterns together.
How long before we see results after rollout?
Most operators see meaningful forecasting improvement within the first several weeks of connecting their existing maintenance records, since the model can generate an initial demand curve from historical work order data without waiting on new data collection. Full rollout across every storeroom and asset class typically continues over subsequent weeks as additional sites and SKU categories are added. The pace depends mainly on how many source systems need to be connected upfront.
Book a demo to get a rollout timeline scoped to your facility.
Turn Your Existing Maintenance Data Into a Forecast That Prevents the Next Stockout
iFactory's Inventory AI connects the data you already have into a live, part-by-part demand forecast.