AI Risk Scoring for Oil and Gas Critical Assets

By Johnson on July 4, 2026

ai-risk-scoring-oil-gas-critical-assets

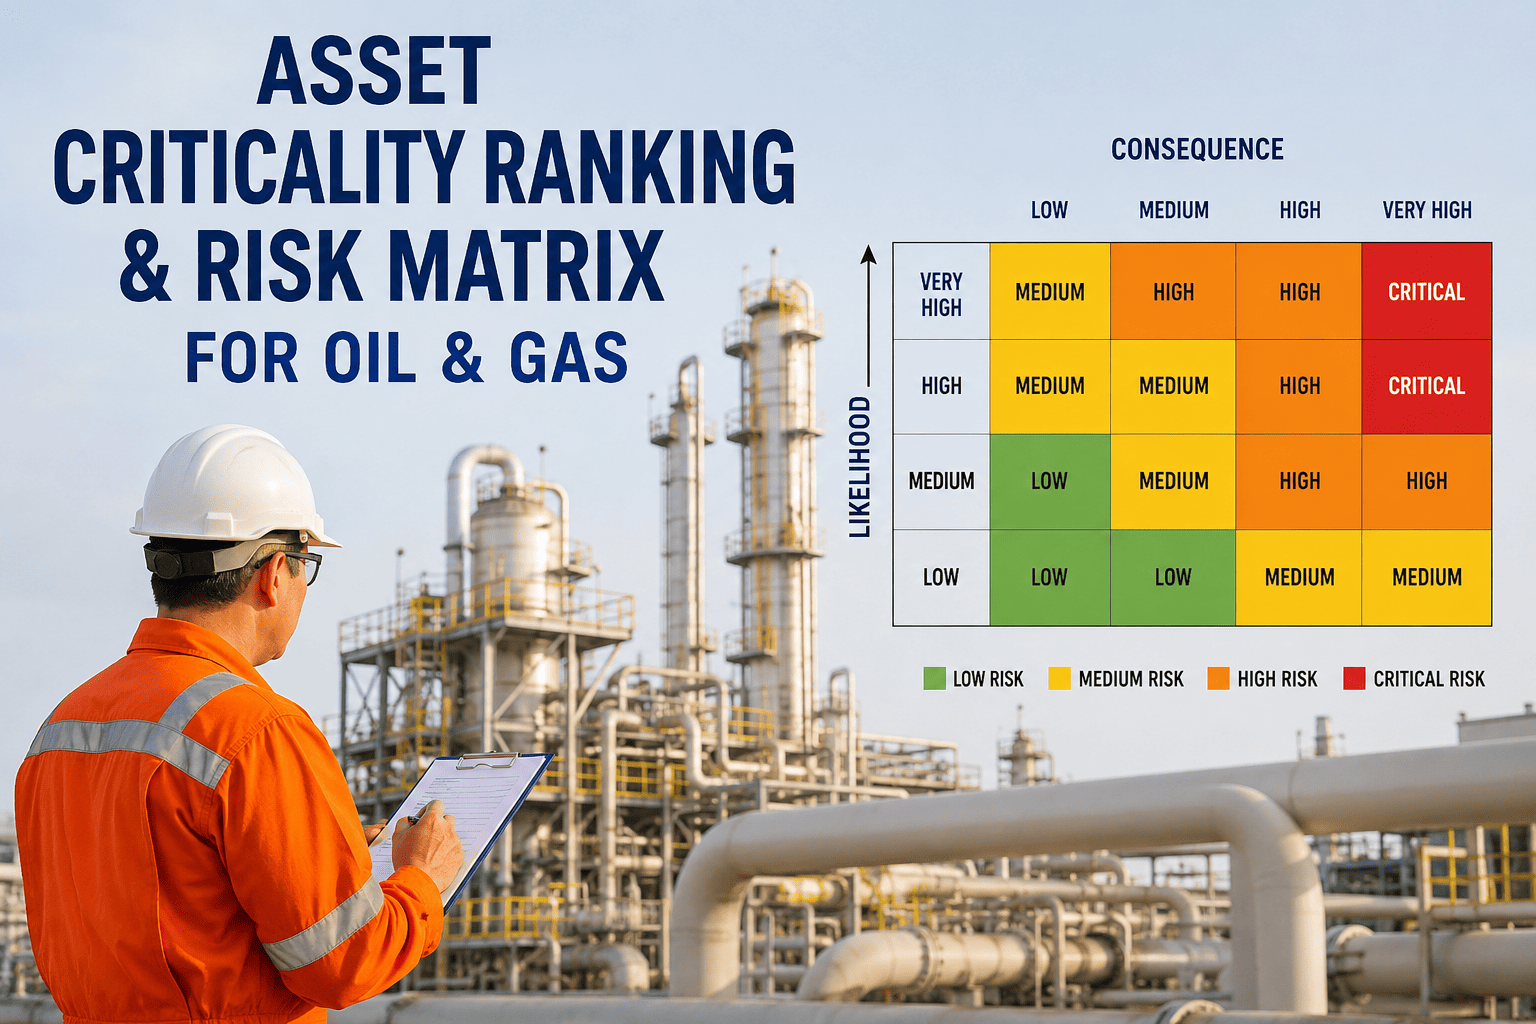
Oil and gas facilities typically manage hundreds to thousands of critical assets ranging from rotating equipment and pressure vessels to heat exchangers and safety systems. Traditional asset criticality ranking relies on static risk matrices evaluated annually — a method that cannot reflect the real-time condition changes occurring between reviews. When a compressor's vibration trends upward or a heat exchanger's fouling accelerates, the actual risk profile has changed but the matrix still shows last year's score. AI-powered risk scoring from iFactory continuously recalculates asset risk using live process data, inspection findings, and failure history to deliver dynamic priority rankings.

Failure Probability · Safety Impact · Production Loss · Compliance · Maintenance Urgency

AI Risk Scoring for Oil and Gas Critical Assets: From Static Matrices to Dynamic Prioritization

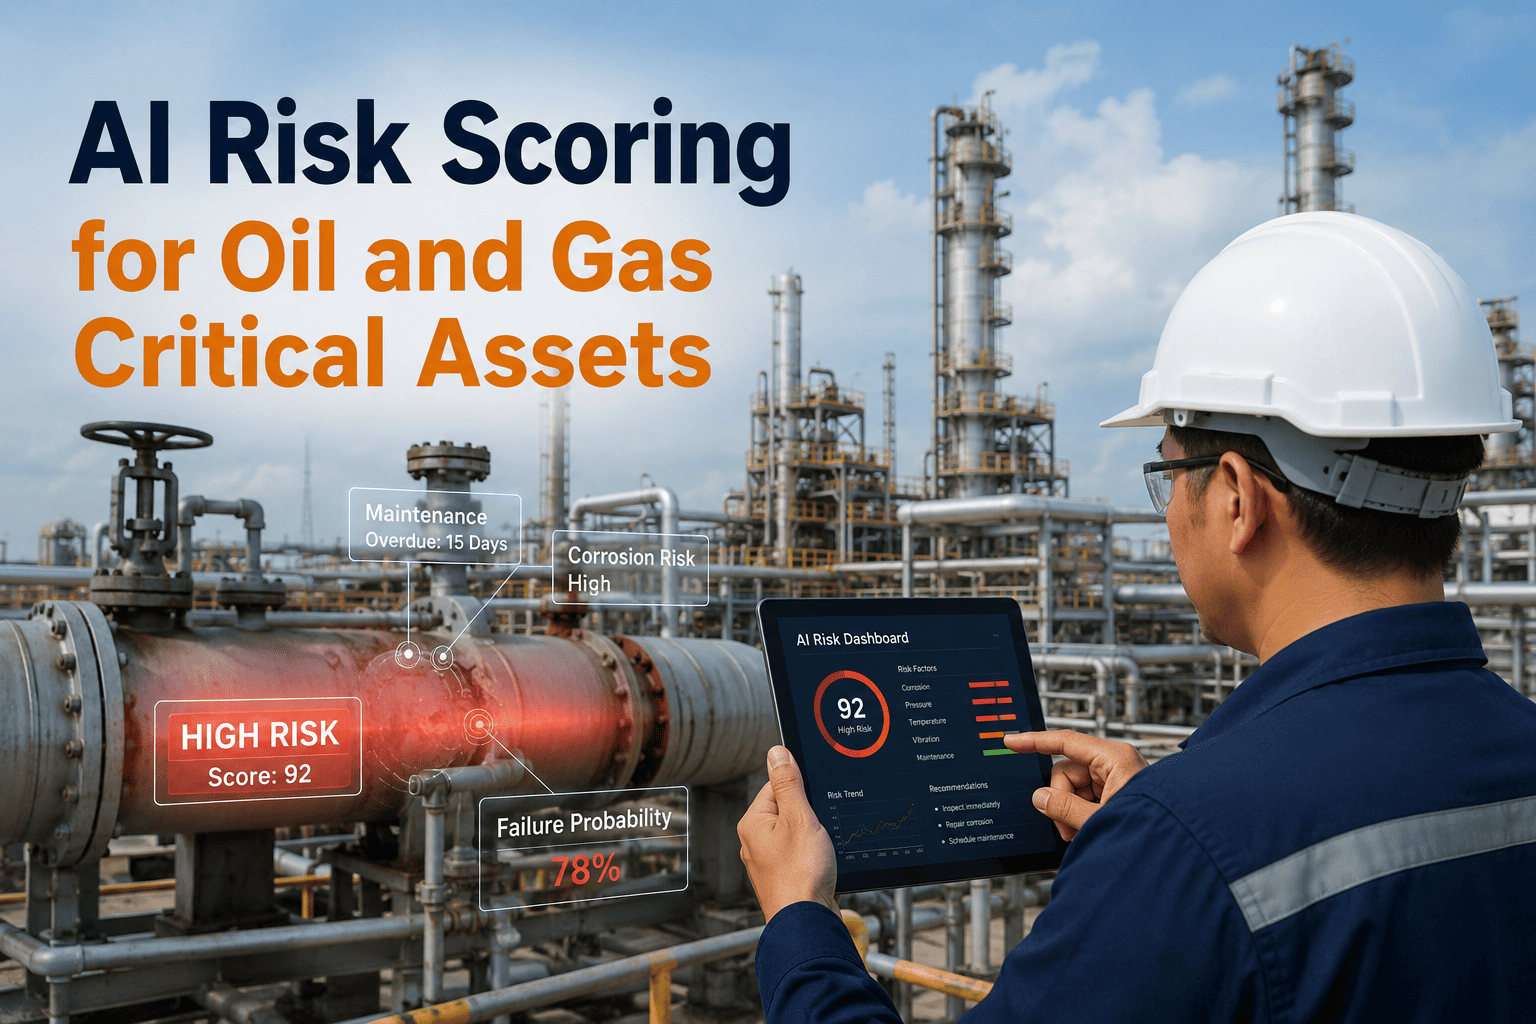
iFactory calculates a composite risk score (0–100) for every critical asset in your facility by weighting five distinct risk dimensions against real-time condition data — replacing annual subjective rankings with continuously updated priority intelligence.

87 / 100
500–2,000+ Critical assets in a typical refinery requiring risk-ranked prioritization
12 Months Average interval between static risk matrix reviews in most facilities
40–60% Of risk score changes occurring between annual reviews go undetected with static methods
3–5x Improvement in maintenance prioritization accuracy with continuous AI risk scoring

The Five Dimensions That Determine Critical Asset Risk

Every asset risk score calculated by iFactory is built from five weighted dimensions that collectively capture the full spectrum of risk facing that equipment. Each dimension is scored independently on a 0–100 scale using data from specific sources — vibration and process data for failure probability, equipment type and operating conditions for safety impact, production dependency mapping for production loss, regulatory and inspection records for compliance exposure, and spare parts and scheduling data for maintenance urgency. The composite score is the weighted sum of all five dimensions, and because each dimension updates independently as new data arrives, the composite score moves continuously to reflect the asset's actual current risk posture.

30%
Failure Probability
Scores the likelihood of unplanned failure based on vibration trend analysis, process deviation frequency, thermal cycle counting, age-based degradation models, and historical failure patterns for the same equipment type across your facility and industry databases.
25%
Safety Impact
Evaluates the potential consequence to personnel and facility safety if the asset fails — considering operating pressure and temperature, contained fluid type and toxicity, proximity to occupied areas, and whether the asset is part of a safety instrumented function or fire protection system.
20%
Production Loss
Quantifies the estimated production impact of asset failure including direct unit downtime hours, affected production rate, downstream unit dependency cascade, and time-to-restore estimates based on spare parts availability and repair complexity for the specific equipment type.
15%
Compliance Exposure
Assesses regulatory and permit risk including whether the asset is subject to specific regulatory requirements such as API 510 pressure vessel inspection, OSHA process safety management covered equipment, or environmental permit conditions with associated reporting obligations.
10%
Maintenance Urgency
Captures the practical urgency of intervention based on spare parts lead time, specialized contractor availability, alignment with upcoming turnaround windows, and whether deferral increases repair complexity or cost — factors that determine optimal timing for maintenance action.

From Static Risk Matrix to Dynamic AI Scoring: How the Calculation Works

The transition from a traditional risk matrix to AI-powered risk scoring is not just an automation upgrade — it is a fundamentally different approach to understanding which assets need attention first. A static matrix places each asset in a cell once per year and leaves it there. AI scoring recalculates every asset's position on a continuous scale every time new data arrives from any connected source. The following process shows how iFactory transforms raw operational data into actionable risk rankings.

01
Data Ingestion
Process data from DCS, vibration signatures from monitoring systems, work order history from CMMS, inspection findings from reliability databases, and failure records — all connected through standard industrial protocols
DCS Vibration CMMS

02
Dimension Scoring
Each of the five risk dimensions is independently scored 0–100 using multivariable models calibrated to your facility's operating context, equipment types, and historical failure patterns
Probability Safety Production

03
Composite Calculation
The five dimension scores are combined using the configured weight distribution to produce a single composite risk score between 0 and 100 for each tracked asset, updated every scan cycle
Weighted Sum 0–100 Scale

04
Dynamic Ranking
All assets are re-ranked by composite score every cycle — any asset crossing a tier threshold generates an automatic notification, and the ranked list drives work order prioritization in your CMMS
Tier Alerts CMMS Sync

Traditional Risk Matrix vs AI-Powered Risk Scoring: A Direct Comparison

The limitations of static risk matrices become clear when compared side by side with AI-driven scoring across the dimensions that matter most to reliability engineering teams. The table below highlights the operational differences that translate directly into missed risks, delayed responses, and preventable failures under traditional methods.

Scroll to compare approaches
Scoring Aspect Traditional Risk Matrix iFactory AI Risk Scoring
Update Frequency Annual review cycle — asset placement unchanged for 12 months regardless of condition changes Continuous recalculation every 1–5 minutes as new process, vibration, and inspection data arrives
Data Inputs Used Subjective probability and consequence estimates from a small group of engineers during a ranking workshop Objective data from DCS historian, vibration monitoring, CMMS work orders, inspection records, and failure databases
Condition Awareness No reflection of real-time equipment condition — asset ranked same whether degrading or stable Fully condition-responsive — score increases as vibration trends upward, fouling accelerates, or inspection findings deteriorate
Output Granularity 3 to 5 tier categories (A/B/C or High/Medium/Low) — many assets share the same ranking with no differentiation Continuous 0–100 score with per-dimension breakdown — every asset has a unique, precisely differentiated risk position
Response to Upsets No mechanism to escalate priority after a process upset — waits for next annual review to reassess Score recalculated immediately after any data change — upset-affected assets automatically rise in priority ranking
Audit Trail Workshop meeting notes and spreadsheet — limited traceability of why each asset received its ranking Complete data-driven audit trail showing every score change, contributing data points, and dimension-level drivers
See Your Facility's Asset Risk Scores Calculated Live

iFactory connects to your existing DCS, vibration monitoring, and CMMS infrastructure to calculate composite risk scores for every critical asset — deployed in five weeks with no new instrumentation required. Watch your asset risk rankings update in real time during a live demo.

Risk Tier Response Framework: What Each Score Range Demands

Every composite risk score falls into one of four action tiers, each with a defined response timeline and set of required actions. The tier framework transforms a numerical score into operational guidance that reliability engineers, maintenance planners, and operations managers can act on immediately without interpreting what the number means in the context of their specific facility.

80 – 100
CRITICAL
Asset is in active failure progression or has an imminent safety or compliance exposure requiring immediate intervention. Production impact is likely within 24–72 hours if no action is taken.
Response Time: Immediate — within 24 hours
Required Action: Emergency work order, potential unit rate reduction or shutdown to prevent failure
Notification: Automatic alert to reliability manager, operations supervisor, and plant manager
60 – 79
HIGH
Asset condition is degrading toward critical threshold with a clear trend indicating accelerating risk. Maintenance intervention within the next 7 days can prevent escalation to critical tier and avoid unplanned shutdown.
Response Time: Within 7 days — plan and execute intervention
Required Action: Priority work order generated, spare parts verified, repair plan developed
Notification: Alert to reliability engineer and maintenance planner with daily score tracking
40 – 59
MEDIUM
Asset is operating with detectable condition deviation but degradation rate is stable or slow. No immediate production or safety threat exists but the trend warrants monitoring and advance planning for the next maintenance window.
Response Time: Schedule in next available maintenance window
Required Action: Add to planned maintenance backlog, verify parts availability, monitor trend
Notification: Included in weekly reliability review with score trend report
0 – 39
LOW
Asset is operating within normal condition parameters with no detectable degradation trends. Standard surveillance and routine maintenance scheduling applies — no elevated intervention required at this time.
Response Time: Routine — follow standard maintenance schedule
Required Action: Continue normal surveillance, no priority escalation needed
Notification: Monthly summary inclusion only — no active alerts generated

Expert Perspective: Why Static Criticality Ranking Fails the Monday Morning Test

The most frustrating part of managing asset reliability with a static criticality matrix is the Monday morning conversation where you discover that the B-critical pump that failed over the weekend had been showing increasing vibration for six weeks. The criticality matrix said B. The actual risk on Friday was an A. But nobody knew because the matrix does not change — it is a snapshot from a workshop held eleven months ago that does not account for anything that has happened since. With iFactory's risk scoring, that pump's score would have been climbing from 45 toward 78 over those six weeks, and it would have crossed the high-risk threshold with enough lead time to schedule the bearing replacement during a normal maintenance window instead of responding to an emergency failure on a Saturday night. That single capability — having a risk number that moves when the condition changes — transforms the entire reliability organization from reactive responders into proactive risk managers. We went from discovering degradation after failure to catching it before it crosses the action threshold, and the reduction in weekend emergency callouts alone justified the platform within the first quarter.
— Reliability Engineering Manager, Gulf Coast Refinery · 20 Years Asset Management Experience · Certified Reliability Engineer (CRE) · Managed Criticality Ranking Programs Across Four Refinery Complexes

Frequently Asked Questions

Q: What data sources does iFactory use to calculate asset risk scores?
iFactory ingests data from your existing DCS historian, vibration monitoring systems, CMMS work order records, inspection management platforms, and equipment failure history databases. The platform connects through standard industrial protocols with no new instrumentation required. Each source feeds specific risk dimensions: vibration and process data drive failure probability, work order history informs maintenance urgency, and inspection findings update compliance exposure and safety impact. Book a Demo to see how your data sources map to risk scoring dimensions.
Q: How is the risk score weight distribution determined for each asset type?
The default distribution of 30% failure probability, 25% safety impact, 20% production loss, 15% compliance exposure, and 10% maintenance urgency follows industry-standard criticality methodology used across refining and upstream operations. iFactory allows facility-specific weight customization per asset category — for example, safety instrumented systems can have safety impact weighted at 40% while utility pumps may have production loss weighted higher. The configuration interface lets your reliability team adjust weights to match your facility risk tolerance framework.
Q: Can iFactory integrate with our existing CMMS for work order prioritization?
iFactory integrates with major CMMS platforms including SAP PM, IBM Maximo, and Infor EAM through standard API connections. The dynamic risk score is written back to the CMMS as a priority field that maintenance planners use to sort work order backlogs and inspection schedules without changing their daily workflow. Integration completes in under seven days as part of the standard five-week deployment. Contact our team to discuss your specific CMMS environment.
Q: How frequently are risk scores recalculated for each asset?
iFactory recalculates risk scores for every tracked asset on each scan cycle, typically every 1 to 5 minutes depending on data source configuration and facility preferences. The failure probability dimension updates most frequently as it is driven by real-time process and vibration data, while compliance and maintenance urgency dimensions update when new inspection findings or work order status changes arrive. Any asset crossing a tier threshold generates an immediate notification to the responsible reliability engineer.
Q: What is the fundamental difference between asset criticality ranking and AI risk scoring?
Asset criticality ranking assigns each asset a fixed tier — typically A, B, or C — based on subjective probability and consequence estimates evaluated once per year. AI risk scoring calculates a numeric 0–100 score using real-time data across five weighted dimensions, updating continuously as conditions change. A compressor ranked B-critical in January can have its AI score increase from 45 to 82 by March if vibration data shows accelerating bearing degradation, triggering immediate priority escalation that static ranking cannot provide. Book a Demo to see the difference in a live environment.
Dynamic Asset Risk Scoring That Moves When Your Equipment Condition Changes

iFactory calculates a composite 0–100 risk score for every critical asset in your facility by weighting failure probability, safety impact, production loss, compliance exposure, and maintenance urgency against real-time data — replacing static annual rankings with continuously updated priority intelligence that drives better maintenance decisions.

Share This Story, Choose Your Platform!