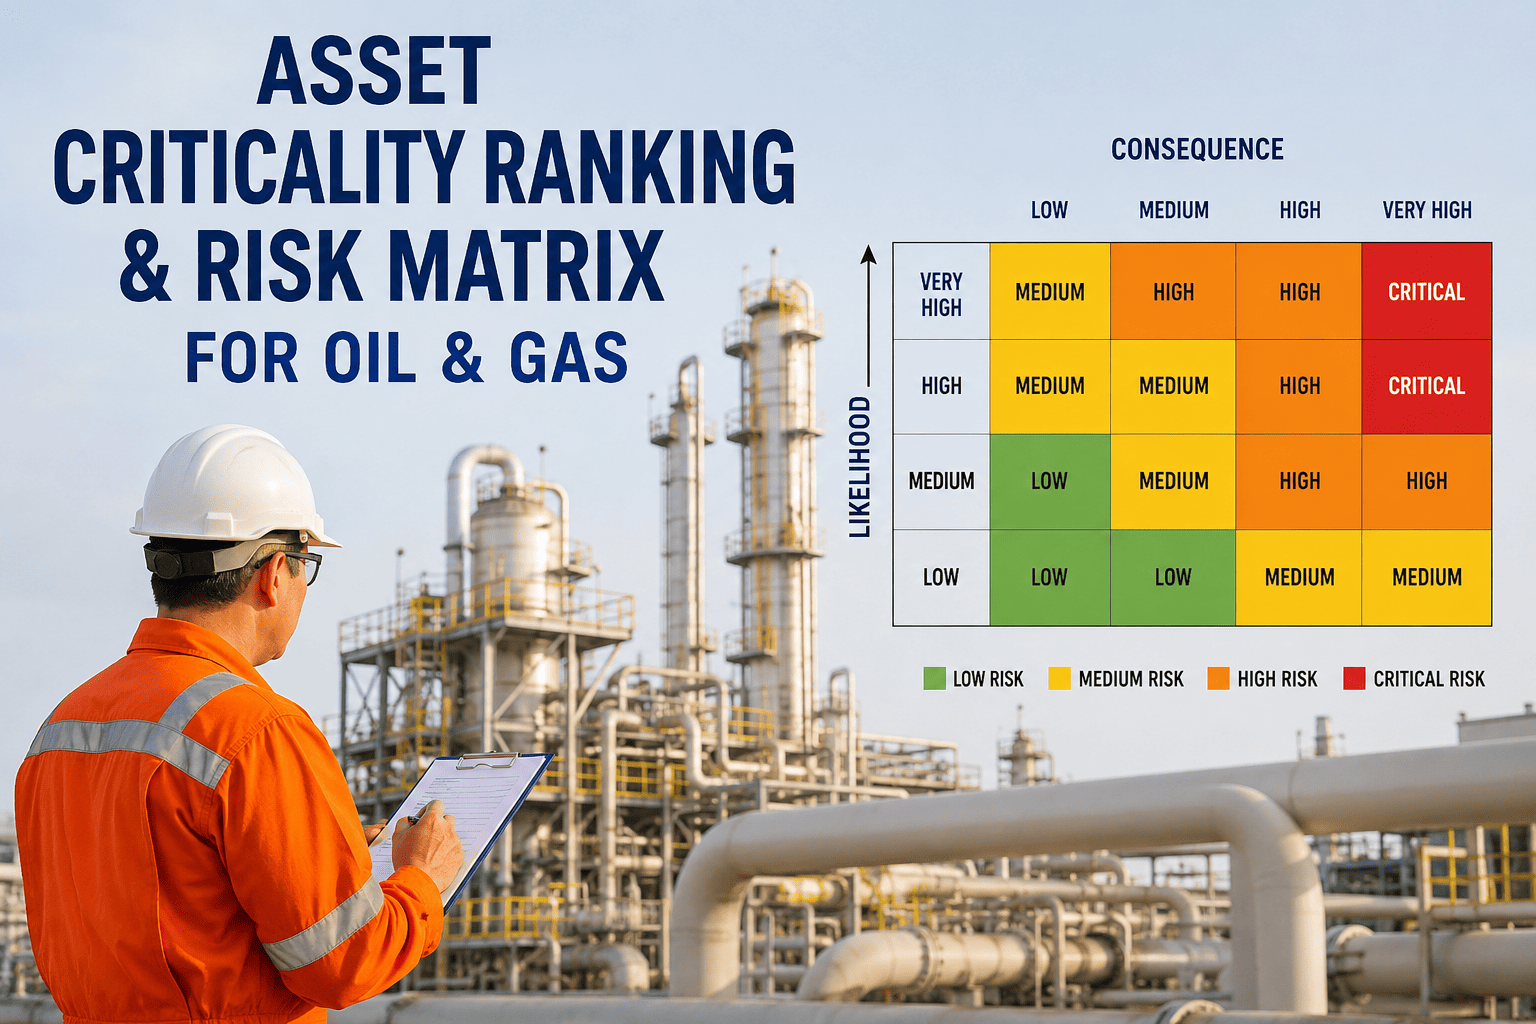
A refinery or upstream facility can carry thousands of tagged assets, and no maintenance team has the budget or headcount to inspect, spare, and monitor every single one at the same intensity. The gap between assets that genuinely threaten safety and production versus ones that barely register if they fail is exactly what a criticality ranking is supposed to capture, yet most plants still rely on a static spreadsheet built years ago and rarely revisited. iFactory rebuilds that ranking as a living model tied to real operating data, and you can book a demo to see how your own asset register would score.
A Risk Matrix Only Works If the Criticality Score Behind It Is Actually Current
iFactory ranks every tagged asset on consequence and probability using live production, safety, and failure history data, then keeps the matrix updated automatically as conditions change.
Most Criticality Rankings Are Built Once and Never Touched Again
A typical criticality exercise happens during a reliability improvement project or an RCM initiative, gets documented in a spreadsheet, and then sits untouched while the plant around it keeps changing. Production rates shift, equipment ages, spare parts availability changes, and failure modes that seemed unlikely five years ago start showing up in the maintenance history. None of that gets reflected back into the ranking, so maintenance planners keep working from a picture of risk that no longer matches reality.
See Your Asset Register Scored Against Live Data
iFactory pulls production impact, safety consequence, and failure history together into one consequence-probability score per asset.
Consequence Isn't Just Downtime Cost, It's Four Factors Combined
How much throughput is lost, and whether the loss is instant, ramped, or bottlenecked elsewhere in the process, is scored against actual historical outage data rather than a rough estimate.
Assets tied to process safety, containment, or emissions limits carry a higher consequence floor regardless of production impact, reflecting regulatory and incident history.
Long lead-time spares or specialized repair crews push consequence higher even when the failure itself is not catastrophic, because the asset stays down longer.
Assets with no standby unit or bypass path score higher than an identical asset that has a parallel train able to absorb the load temporarily.
What Each Tier Actually Means for Maintenance Strategy
| Tier | Typical Strategy | Spare Parts Policy |
|---|---|---|
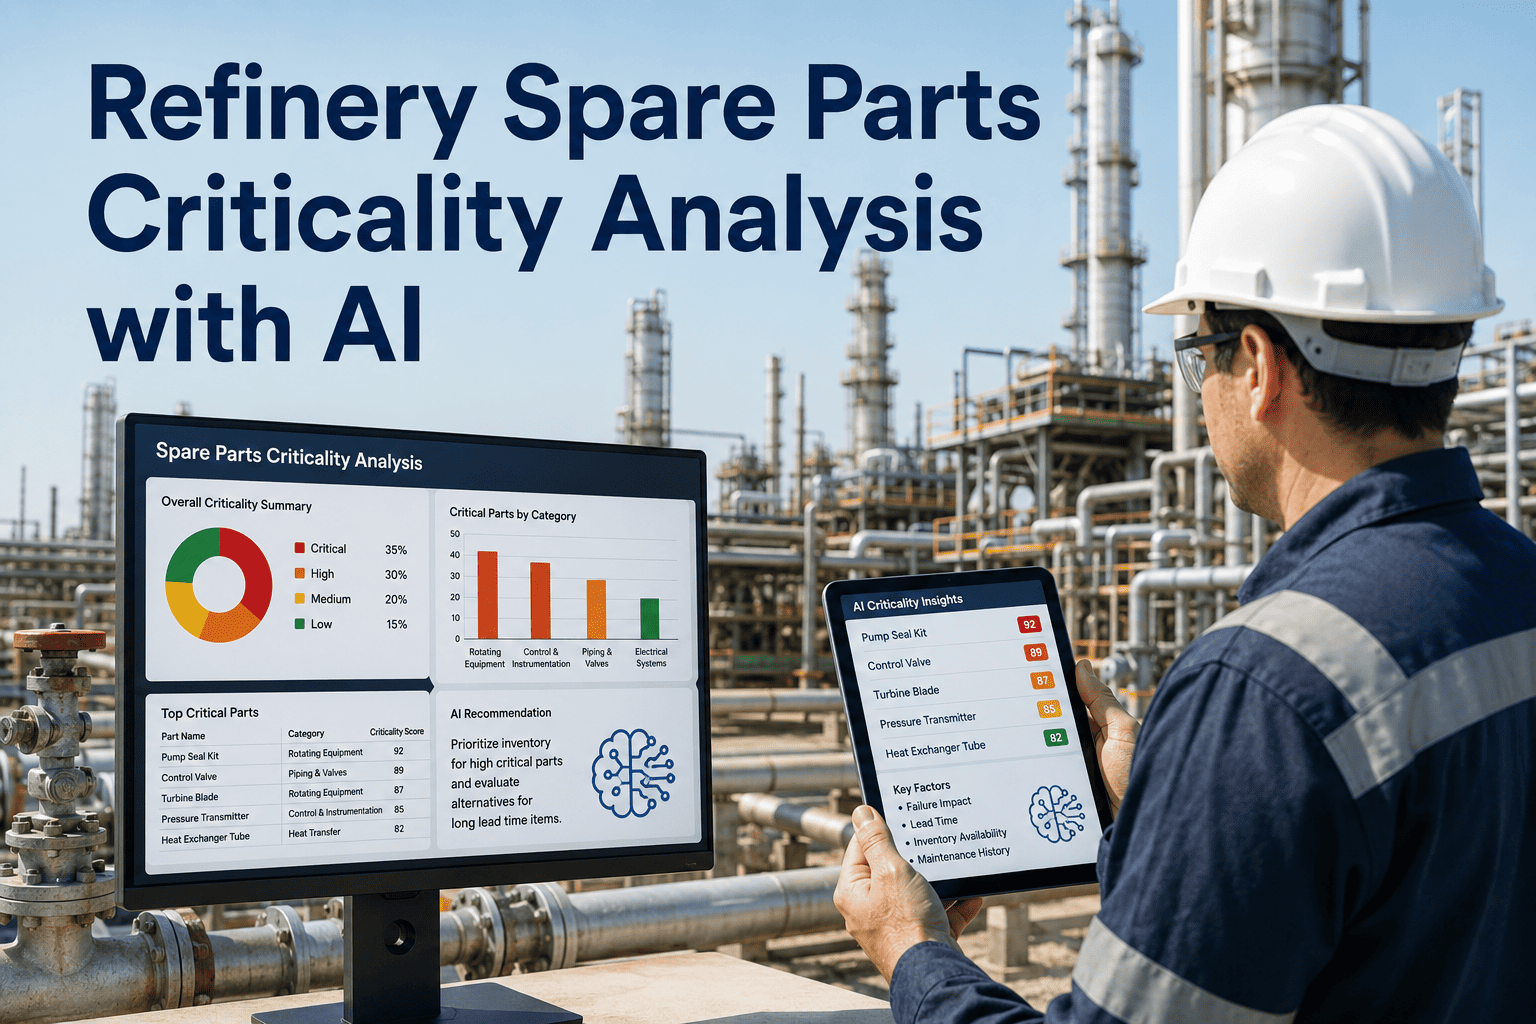
| Critical | Condition-based monitoring, redundant sensors, short inspection intervals | Stock on-site, dedicated reserve |
| High | Scheduled preventive maintenance with condition checks | Stock on-site, shared pool acceptable |
| Medium | Time-based preventive maintenance, standard intervals | Vendor lead-time acceptable |
| Low | Run-to-failure or reactive maintenance | Order on failure |
Outcomes Reported After Moving to a Live Criticality Model
Moving From a Static Spreadsheet to a Live Criticality Model
Import the Existing Asset Register
Your current CMMS or spreadsheet-based asset list is imported as the starting point, preserving any prior criticality work already done.
Connect Production and Failure Data
Historical downtime, safety incident logs, and production throughput data are linked so consequence scoring reflects real plant history.
Generate the Risk Matrix
Every asset is plotted on the consequence-probability matrix, with tiering rules configurable to match your site's existing risk framework.
Push Tiers Into Maintenance Planning
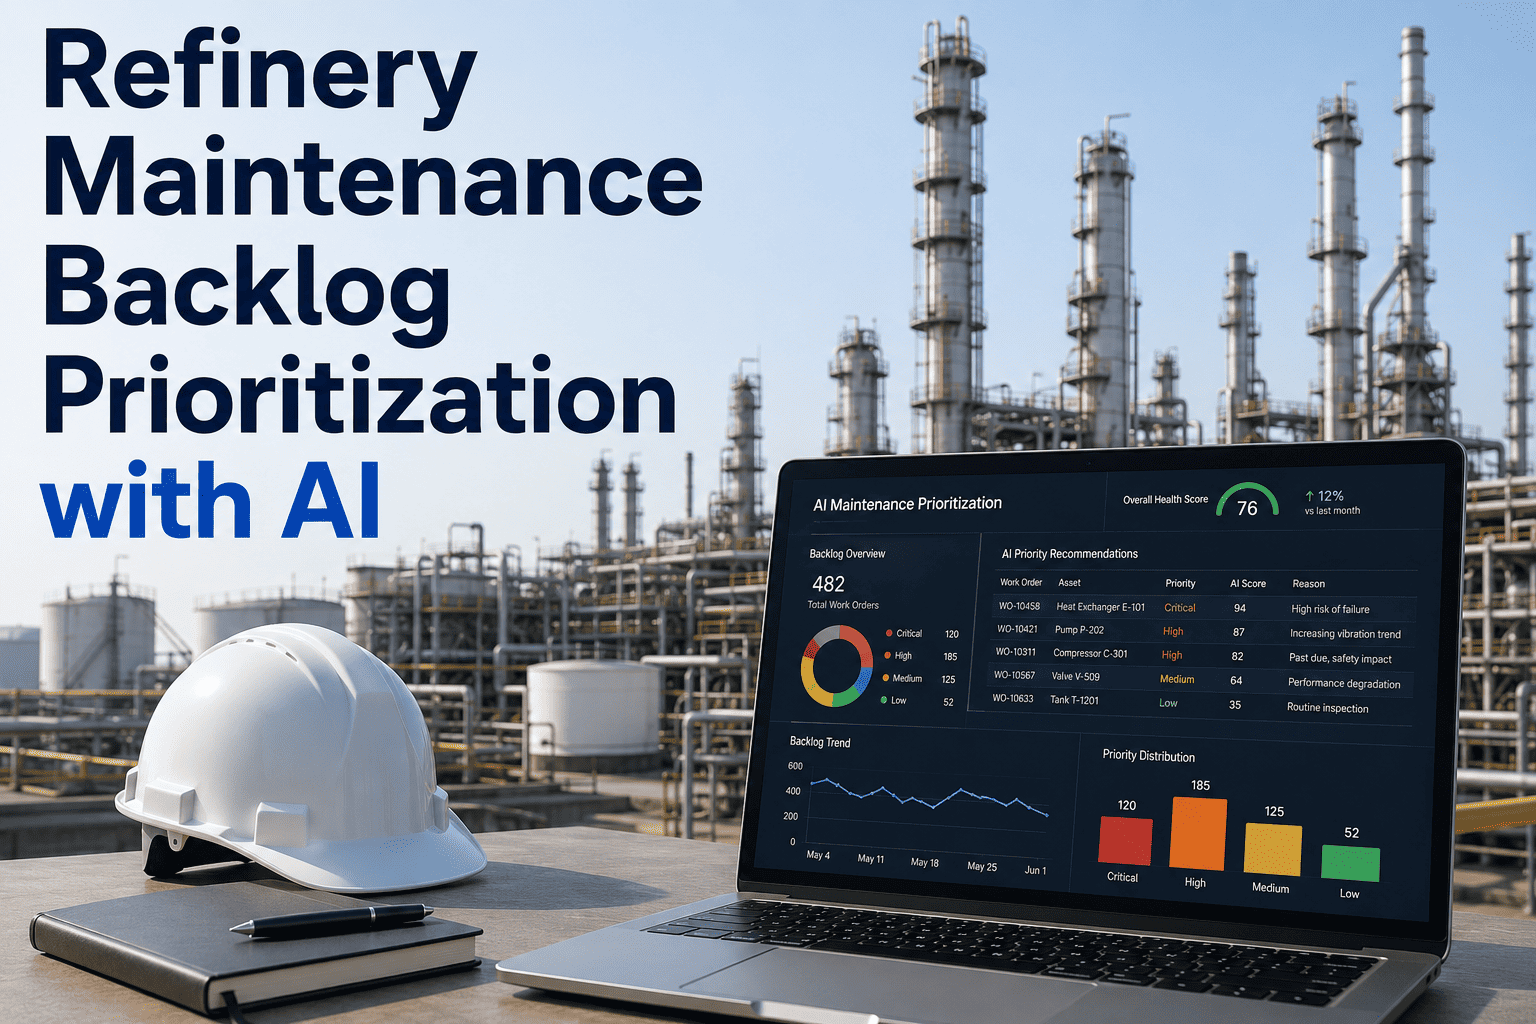
Criticality tiers flow into your CMMS to drive inspection frequency, spare parts policy, and work order prioritization automatically.
Probability Isn't a Guess Either, It's Built From Four Failure Signals
Consequence tells you what happens if an asset fails, but probability tells you how likely that failure actually is right now, and that side of the matrix is where most spreadsheet-based rankings go stale fastest. A pump that was low-probability three years ago may now be running past its expected bearing life, or a valve that recently had a string of unplanned repairs may deserve a higher probability score than the original workshop ever assigned it.
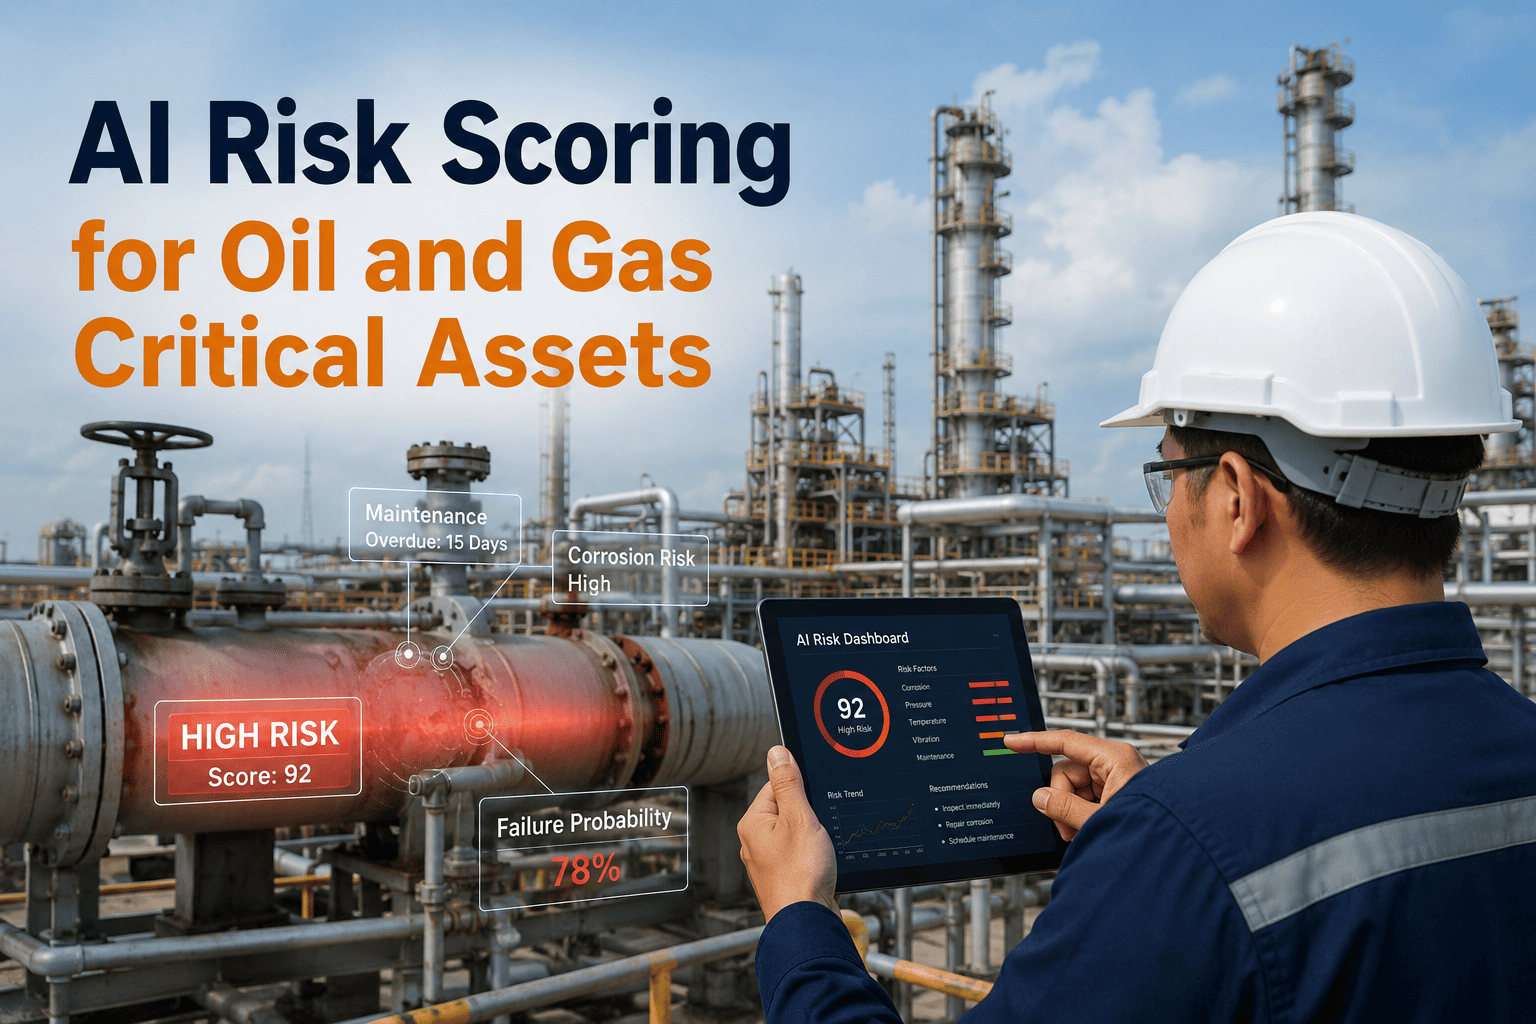
Repeat failures or repair work orders against the same asset over a rolling window push probability higher than a single isolated incident from years ago.
Vibration, temperature, or oil analysis trends moving toward an alarm threshold raise probability even before a formal failure has occurred.
An asset with overdue preventive work sitting in the backlog carries a higher probability score than one on schedule, regardless of its age.
Assets running above design duty, outside normal temperature range, or through frequent start-stop cycles wear faster than their nameplate rating suggests.
Where Criticality Rankings Break Down Even When the Framework Is Sound
Two pumps of the same model can carry very different real risk depending on run hours, spares availability, and repair history, yet many rankings assign one score per asset type.
A standby unit that was decommissioned or repurposed elsewhere quietly raises the probability and consequence of the remaining asset, but the ranking rarely gets updated to reflect it.
A criticality ranking produced for an audit or a project milestone is treated as finished, when the real value comes from it staying current as conditions change.
Questions Reliability Teams Ask About Criticality Ranking
Stop Prioritizing Maintenance Off a Ranking Built Years Ago
iFactory keeps your asset criticality matrix current so inspection intervals and spares policy match today's actual risk.


-rollout.png)
-in-oil-&-gas-a-practical-guide.png)