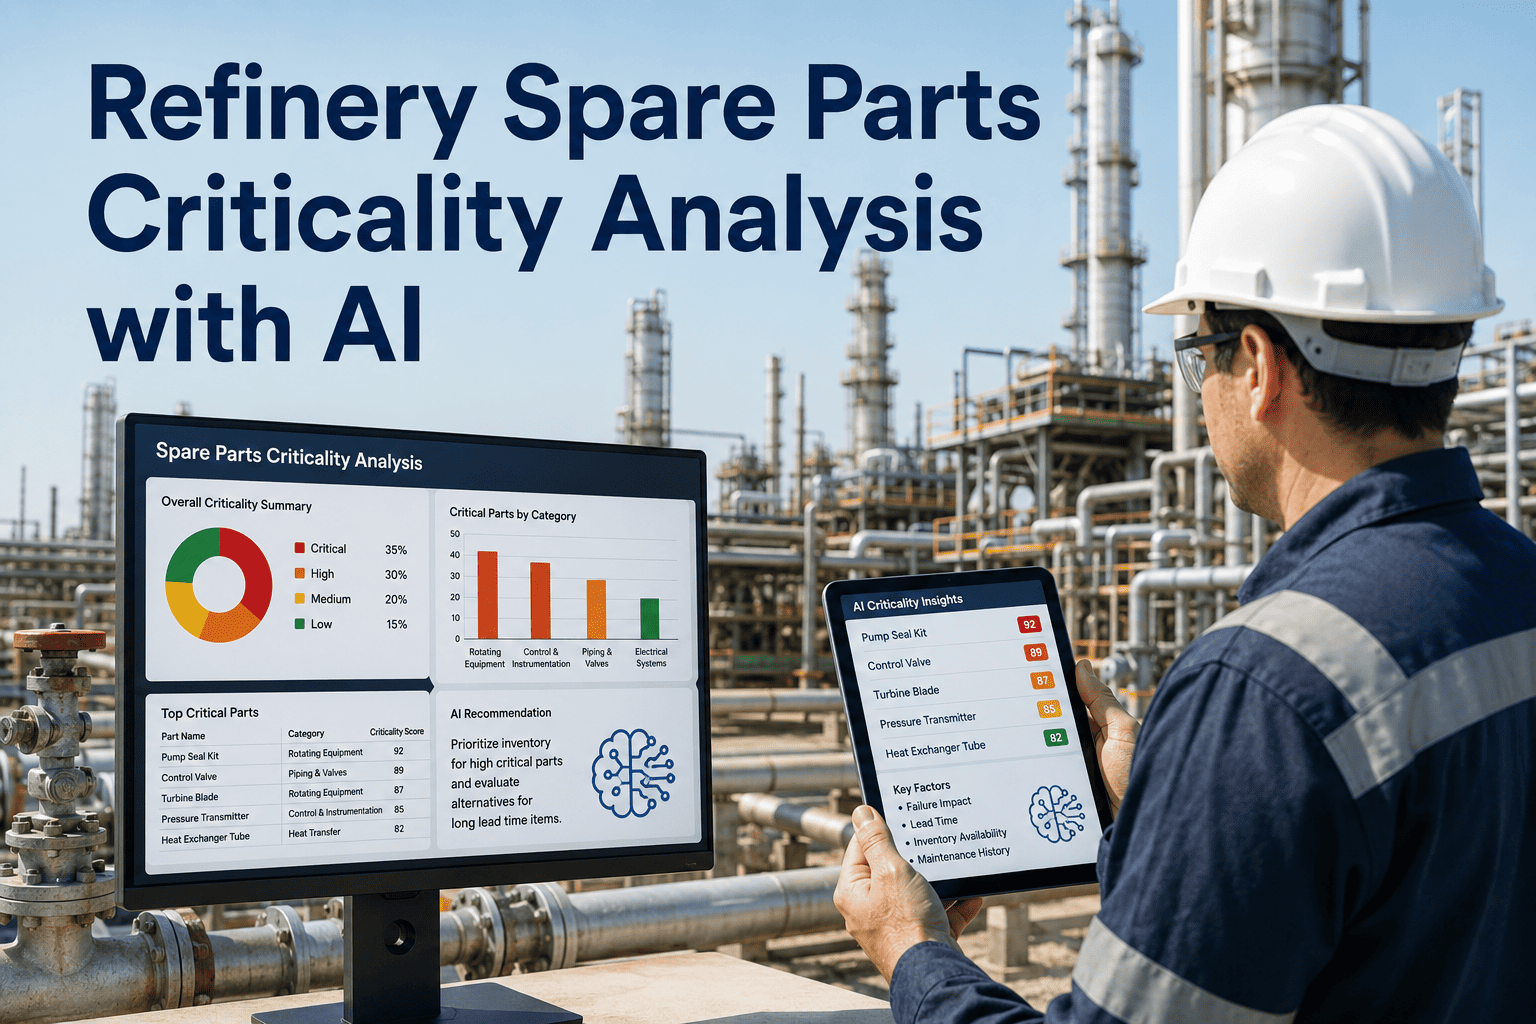
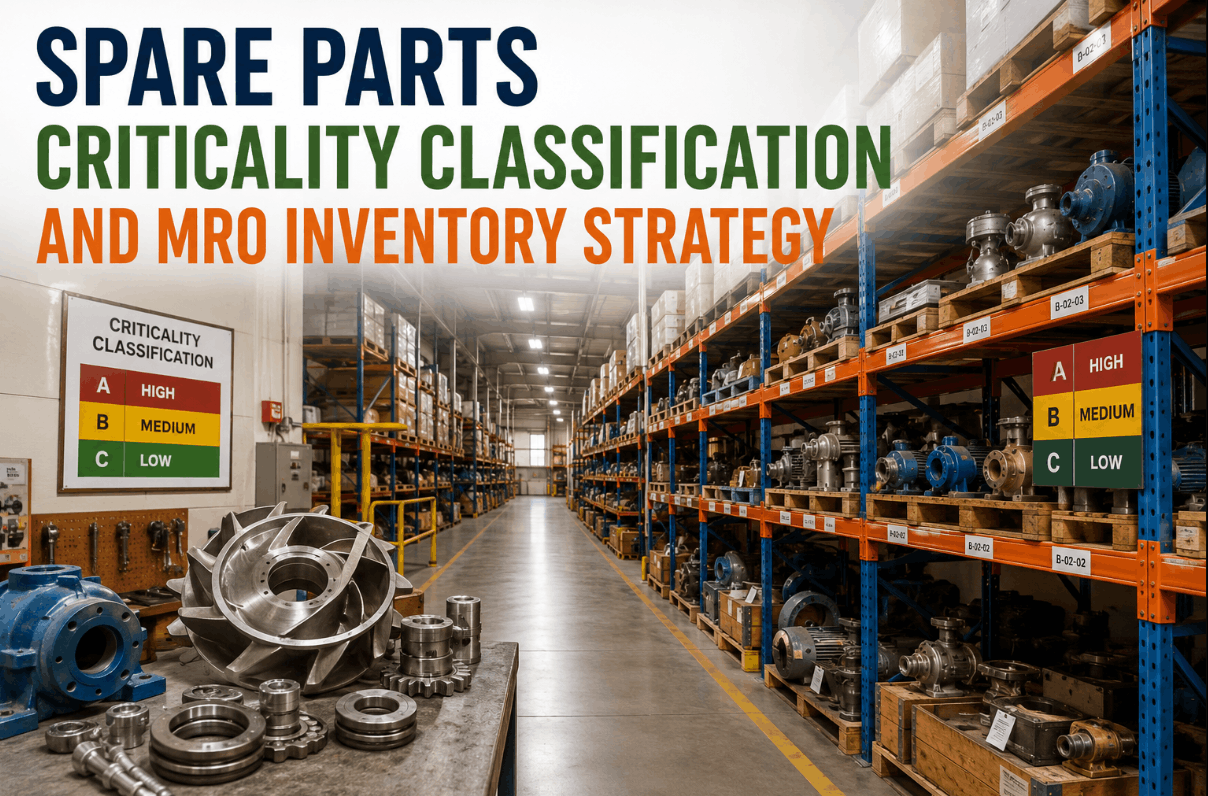
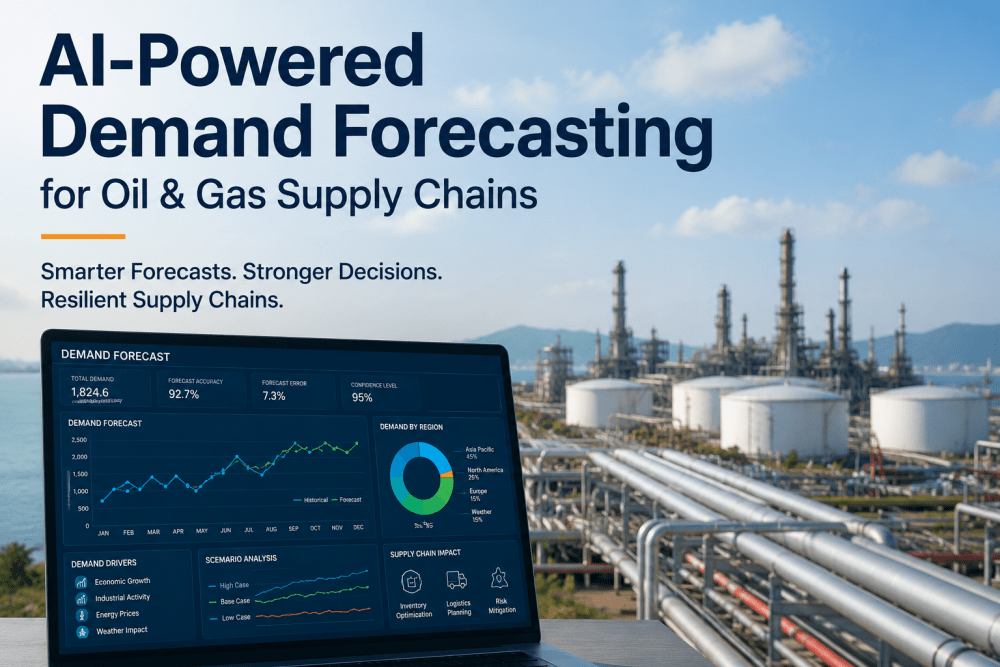
Oil and gas operations carry between 15 and 25 percent more spare parts inventory than they actually need, while simultaneously experiencing stockouts on critical components that force multimillion-dollar production shutdowns. This paradox exists because MRO inventory decisions are still made using historical consumption averages, vendor minimum order quantities, and planner intuition rather than demand patterns linked to actual equipment condition and maintenance schedules. The result is warehouses full of parts that will never be used and empty shelves where the one part that prevents a shutdown is missing. AI-driven demand forecasting and criticality-based classification resolve this by tying inventory levels to real failure probability rather than blanket stocking rules. Book a demo to see how predictive spare parts optimization works across oil and gas MRO operations.
Oil & Gas · Predictive Maintenance ROI
Spare Parts Optimization for Oil & Gas MRO Operations
How AI demand forecasting, criticality classification, and reorder point optimization reduce inventory carrying costs while eliminating the stockouts that cause production shutdowns.
22%
Average carrying cost as a percentage of MRO inventory value per year
$4.2M
Average value of excess and obsolete spare parts in a mid-size upstream operator
38%
Reduction in MRO inventory value achieved within 12 months of AI-driven optimization
The Spare Parts Paradox: Too Much and Never Enough
Every MRO manager in oil and gas lives with the same contradiction. Audits show too much inventory. Shutdowns show too little. The two-column breakdown below quantifies both sides of the paradox with numbers that explain why traditional stocking rules create this impossible situation.
Overstock Problem
$1.8M
Capital tied up in parts with zero consumption in 24 months
12%
Annual carrying cost on slow-moving inventory including storage, insurance, and depreciation
3,400
Duplicate part numbers in typical MRO catalog from uncontrolled procurement across sites
Stockout Problem
$890K
Average production loss per stockout event on a critical rotating equipment spare
72 hrs
Average lead time for emergency procurement of a non-stocked critical component
4x
Price premium paid for emergency orders versus planned replenishment purchases
Spare Parts Classification Pyramid
Not every spare part deserves the same stocking strategy. The pyramid below shows the four-tier classification system that separates parts by criticality and consumption pattern. Each tier demands a fundamentally different approach to stocking levels, reorder points, and procurement strategy. Applying the same rules to all parts is what creates the overstock-and-stockout paradox.
Tier 1
Insurance Spares
Low consumption, extreme consequence if unavailable. Turbine rotors, large compressor impellers, custom-machined pressure vessel internals. Stock one, validate condition annually, accept the carrying cost as insurance against a multi-million-dollar shutdown.
Tier 2
Critical Consumables
Predictable consumption, high consequence if unavailable. Mechanical seals, bearings for critical rotating equipment, control valve trim kits, SCADA system circuit boards. Stock to optimized min-max levels driven by maintenance schedule and lead time analysis.
Tier 3
Reorder Spares
Moderate consumption, moderate consequence. Standard pumps, heat exchanger gasket sets, filter elements, standard valve internals. Managed with automated reorder points and economic order quantity calculations tied to actual demand patterns.
Tier 4
General MRO
High consumption, low consequence. Fasteners, pipe fittings, lubricants, standard electrical components. Managed through vendor-managed inventory or just-in-time delivery with minimal on-site stocking.
The Inventory Cost Iceberg
When MRO inventory is reported as a single dollar value on a balance sheet, it hides the full cost of carrying that inventory. The visible costs are just the purchase price. The hidden costs below the surface often exceed the purchase value within three to four years. The iceberg below breaks down the true cost structure that most inventory reports never show.
Hidden Costs
Obsolescence & Write-Offs
15-25%
Warehouse Space & Handling
8-12%
Deterioration & Shelf-Life Loss
5-10%
Planning & Procurement Overhead
6-9%
AI Demand Forecasting: The Continuous Optimization Cycle
Traditional reorder point calculations use average monthly consumption and a fixed safety stock multiplier. AI forecasting replaces this static approach with a dynamic cycle that continuously updates demand predictions based on equipment health data, maintenance schedules, and actual consumption patterns. The four-stage cycle below shows how predictions improve over time.
01
Data Ingestion
Maintenance work order history, equipment failure records, planned turnaround schedules, PM task lists, and current inventory levels are loaded into the forecasting model continuously.
02
Demand Prediction
The model generates part-level demand forecasts for the next 1 to 12 months, weighting planned maintenance demand higher than statistical failure probability for critical components.
03
Reorder Optimization
Forecasted demand is combined with supplier lead times, economic order quantities, and criticality weightings to calculate optimized reorder points and order quantities for each part.
04
Feedback Loop
Actual consumption is compared against forecast. Forecasting errors are measured, model weights are adjusted, and classification tiers are reviewed as equipment condition and operating context change.
Spare Parts Rationalization Funnel
Most oil and gas MRO catalogs contain 30 to 50 percent more part numbers than necessary because parts have been added over decades without systematic review. The rationalization funnel below shows the filtering process that reduces a bloated catalog to an optimized one without eliminating any part that a maintenance team actually needs.
Start
Full MRO Catalog
18,000 active part numbers
Filter 1
Remove Duplicates & Superseded Parts
14,200 unique part numbers remaining
Filter 2
Zero Consumption in 36 Months Without Criticality Justification
9,800 active part numbers remaining
Filter 3
Consolidate to Preferred Vendors & Standard Specifications
7,400 optimized part numbers
Result
Rationalized Catalog With AI-Managed Reorder Points
59% reduction in catalog size, 0% loss of critical coverage
Inventory Profile: Before and After Optimization
The most visible evidence of successful spare parts optimization is not a single number but a shift in how inventory value is distributed across the classification tiers. The before-and-after comparison below shows the typical distribution change that occurs when AI-driven optimization replaces blanket stocking rules.
Before Optimization
Total Value: $12.4M
After Optimization
Total Value: $7.7M
Documented Savings From MRO Inventory Optimization
Verified outcomes from oil and gas operators that replaced static stocking rules with AI-driven demand forecasting and criticality-based classification across their MRO spare parts operations.
$4.7M Released
Gulf of Mexico Production Company
Identified and dispositioned $4.7 million in excess and obsolete inventory across six offshore platforms by rationalizing the MRO catalog from 22,000 to 9,400 active part numbers over 14 months.
Zero Stockouts
Midstream Pipeline Operator
Maintained zero critical spare stockouts for 18 consecutive months while reducing total inventory value by 31 percent through AI-driven reorder point optimization across 22 compressor stations.
28% Fewer POs
Refinery MRO Department
Reduced purchase order volume by 28 percent by consolidating to preferred vendors and standardizing part specifications during catalog rationalization, freeing procurement capacity for strategic sourcing.
Your MRO storeroom has the parts to prevent your next shutdown. The problem is they are buried under ten thousand parts you will never use. AI-driven optimization does not cut inventory blindly. It moves investment from low-criticality, zero-consumption parts toward the critical spares that actually prevent production losses. The total inventory value drops while the protection level increases.
Expert Insight
I have walked into MRO storerooms at offshore platforms where the aisles are so full of boxed parts that you cannot reach the back shelves, and then had the maintenance manager tell me they had a three-day production loss last month because a specific bearing size was not in stock. The parts that caused the shutdown were worth maybe four hundred dollars. The parts collecting dust in those aisles represented millions in tied-up capital. The issue was never that they did not spend enough on spares. The issue was that their spending had no intelligence behind it. Every part was stocked based on what the previous planner ordered, who was following what the planner before them ordered. AI optimization breaks that chain of inherited decisions by asking a simple question for every part in the catalog: given what we know about this equipment's condition, its maintenance schedule, and its failure history, how many of these do we actually need and when will we need them?
Laura Martinez — MRO Supply Chain Director, 17 years in oil and gas spare parts management, former VP of Supply Chain at two mid-cap E&P companies
Traditional vs. AI-Driven Inventory Management
The table below captures the operational differences between conventional MRO stocking approaches and AI-optimized methods across the decisions that determine whether inventory protects production or just occupies warehouse space.
| Decision |
Traditional Approach |
AI-Optimized Approach |
Impact |
| Demand forecasting |
Three-year rolling average consumption multiplied by a safety factor |
Machine learning model using maintenance schedules, equipment health, and seasonal patterns |
Forecast accuracy improves by 40 to 60 percent for critical spares |
| Reorder point calculation |
Fixed formula updated annually during budget cycle |
Dynamically recalculated monthly based on updated demand forecast and supplier lead time |
Reorder points reflect current reality instead of last year's assumptions |
| Criticality assignment |
Planner judgment, often over-classifying parts as critical to avoid stockout risk |
Data-driven scoring using failure consequence, lead time, and consumption frequency |
Critical tier reduced by 30 to 40 percent, freeing safety stock investment |
| Obsolescence review |
Conducted during physical inventory counts, typically every two to three years |
Continuous monitoring flags parts with zero demand and no equipment linkage for immediate review |
Obsolete inventory identified months earlier, write-off exposure reduced |
| Catalog rationalization |
Ad hoc cleanup projects triggered by warehouse space constraints |
Systematic duplicate detection, standardization, and vendor consolidation as ongoing process |
Catalog size reduced and maintained without periodic crash projects |
Frequently Asked Questions
How long does it take to implement AI-driven spare parts optimization?
A pilot deployment on a single site or business unit typically takes 10 to 14 weeks, including data extraction from the CMMS and ERP systems, catalog cleansing, criticality classification, initial model training, and first-round reorder point recommendations. Full multi-site deployment across an upstream or midstream operation usually requires 6 to 9 months using a phased approach. The longest lead item is rarely the technology itself but the data quality work required to clean the MRO catalog, resolve duplicate part numbers, and link spare parts to specific equipment assets in the CMMS. Most operators find they have significant data quality debt that must be addressed before the forecasting models can produce reliable outputs.
Book a demo to see a scoped implementation plan for your operation.
Will optimization reduce our safety stock on critical parts and increase shutdown risk?
No. AI optimization typically increases safety stock on truly critical parts while reducing it on parts that were over-classified as critical. The criticality scoring process often reveals that 30 to 40 percent of parts in the critical tier have no business being there because their failure consequence is low, their lead time is short, or a substitute part is available. The investment freed from over-stocked non-critical parts is redirected to ensure that genuinely critical insurance spares are adequately stocked, condition-validated, and immediately accessible. The net effect is lower total inventory value with higher protection against the failures that actually cause production losses.
Contact support to understand how criticality scoring protects your highest-risk spares.
What data sources does the AI forecasting model require?
The minimum viable data set includes spare parts consumption history from the ERP or storeroom management system, the active MRO catalog with current stock levels and lead times, and equipment bill of materials linking parts to specific assets in the CMMS. The model improves substantially with additional inputs such as planned maintenance schedules, equipment failure history, turnaround work scope lists, and operating condition data from condition monitoring systems. Most oil and gas operators have all of this data in existing systems. The challenge is not collecting it but connecting it into a unified analysis layer that can correlate equipment condition with part demand at the individual component level.
Book a demo to see what your existing data can produce.
How does the system handle parts with very low or zero historical consumption?
Low and zero-consumption parts are the most important category in oil and gas MRO because they include the insurance spares that prevent the highest-consequence failures. For these parts, the AI model shifts from consumption-based forecasting to risk-based stocking, using equipment criticality, failure mode probability, lead time, and the cost of downtime to calculate an optimal stocking decision. A turbine rotor that has never been replaced in 15 years still gets a stocking recommendation based on what would happen if it failed tomorrow and how long it would take to procure. This is fundamentally different from traditional methods that either over-stock everything or under-stock low-consumption items because the consumption average approaches zero.
Contact support to understand risk-based stocking for your insurance spares.
Can this integrate with our existing ERP and warehouse management systems?
Yes. The optimization platform connects to existing ERP and warehouse management systems through standard integration interfaces. It reads current inventory levels, consumption transactions, and purchase order history from the ERP, and writes back optimized reorder points, recommended order quantities, and classification tier assignments. The ERP continues to handle all transactional processing including purchase orders, goods receipts, and inventory movements. The optimization platform acts as an intelligence layer on top of existing systems, not a replacement for them. This means no disruption to current warehouse operations, procurement workflows, or financial reporting during or after deployment.
Book a demo to see integration options for your ERP platform.
Your MRO Inventory Is Costing More Than It Is Protecting
AI-driven spare parts optimization that reduces total inventory value while increasing protection against the stockouts that actually cause production shutdowns.